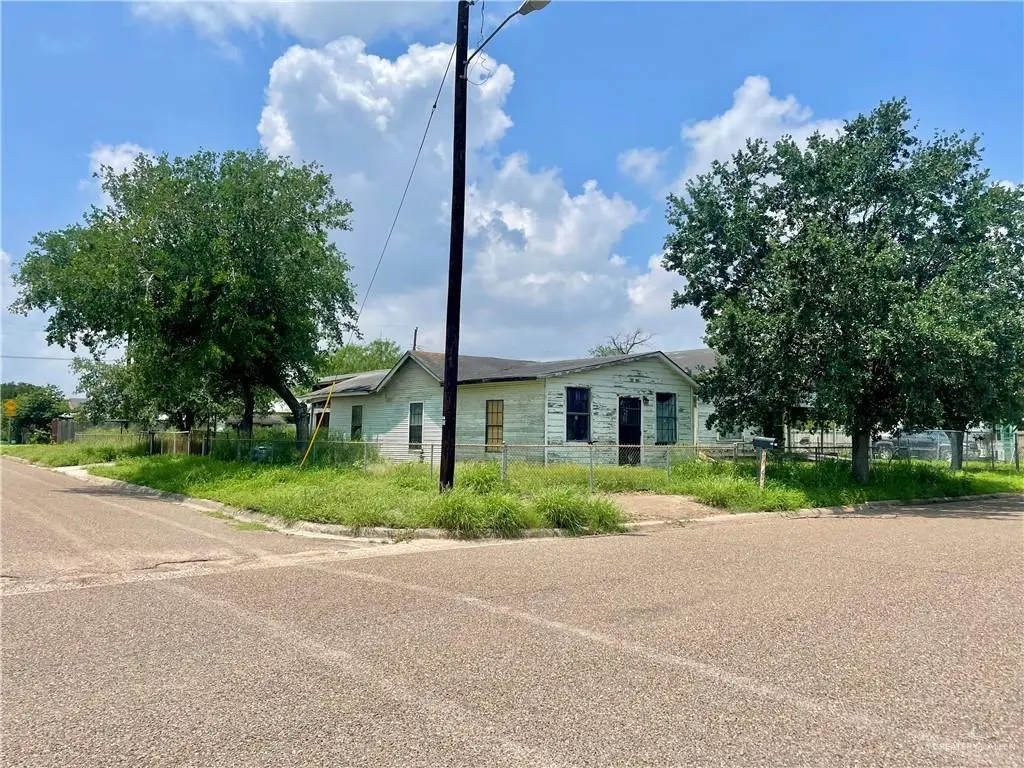
622 E Samano St · Edinburg, TX
Flood risk 6/10 · Moderate
- FEMA flood zone
- X (shaded)
- Chance of flooding over 30 yrs
- 0.69%
- Est. flood insurance / yr
- $507 – $1,088
Fire risk 7/10 · Major
- Est. fire insurance / yr
- $1,222 – $2,270
Heat risk 9/10 · Severe
- Hot days now (above 111°F)
- 7 days/yr
- Hot days in 30 yrs
- 23 days/yr
Wind risk 8/10 · Major
- Chance of severe wind over 30 yrs
- 99.0%
Air-quality risk 2/10 · Minimal
- Unhealthy air days now
- 0 days/yr
- Unhealthy air days in 30 yrs
- 1 days/yr
Risk factors via First Street. Map © Google.
Why this score? — see what drove the B grade
The composite is a weighted blend of 9 inputs, each scored 0–100. Each bar is that input's sub-score; the figure is the points it added to the 100-point composite (weight × sub-score).
- Cash flow +28.4/30.0
- ARV discount +15.0/15.0
- 1% rule +10.0/10.0
- DSCR +10.0/10.0
- Livability +3.2/5.0
- Condition / age +2.5/5.0
- Rent growth +2.4/5.0
- Schools +2.2/10.0
- Appreciation +0.0/10.0
$75,000
🖨 Deal sheet 📄 Offer letter ✓ Due diligence
Listing remarks
Discover a prime residential lot opportunity at 622 E. Samano St. , Edinburg, TX! This spacious lot, measuring approximately 50' x 142', is ideally situated in the heart of Edinburg, just north of Freddy Gonzalez and east of S. Closner Blvd, and west of Expressway 83. Perfect for building your dream home in an established neighborhood, Though property is being sold for lot value only, it does have a frame home on pier and beam, built in 1984, which requires reconstruction or demolition. Located at the southwest corner of Samano St. and S. 17th Ave and has a back alley for added convenience. Enjoy easy access to local amenities in a welcoming community atmosphere. Don’t mis
Key facts
- 7,099 sq ft lot
- Garage
- Built 1984
Tags
Property features AI
Finance
- HOA & community: No homeowners association
Exterior
- Parking: No garage; Garage faces side (property lists garage-facing side but no garage spaces)
- Utilities: City sewer
- Home design: Single-story (implied by building size and details)
- Construction: Frame/wood construction; Pillar/post/pier foundation; Composition shingle roof; Building area approximately 1,032 (unit not shown per instructions)
- Exterior features: Chain-link fencing; Corner lot; Paved road access
Interior
- Kitchen: No conveying appliances
- Flooring: No flooring specified
- Bathrooms: 1 full bathroom
- Interior features: Countertops: other / unspecified; No window coverings
- Laundry & utility: Electric water heater; Water heater located in nonstandard location
Neighborhood map
What this means for you Summary
Snapshot
- This is a 3-bed/1.0-bath single-family listed at $75k.
Deal economics
- At list price, monthly cash flow is $242 ($3k/yr) — positive.
- The deal already cash-flows at list — no discount required.
- Meets the 1% rule at list price ($1k rent vs $75k).
- Recommended offer: $74k (1.5% below list) — sets the bar for market timing.
- Cap rate 10.2% vs local median 2.4% in Edinburg — top-decile yield for the area; either an underpriced asset or a hidden risk that comps aren't pricing in. Stress-test before assuming the spread holds.
Location & tenants
- Location reads 64/100 on livability (#784 in TX) — a middle-class / working-renter tenant base. Strengths: cost of living A+, housing A+; Watch: employment D, amenities F, commute F.
- Edinburg CISD (urban): math 20% / reading 34% proficiency, ranked #699 of 826 in TX (top 85%) — low school quality limits family demand, transient renter base, plan for 1-2y turnover; 62% free/reduced lunch — lower-income household profile, screen leases tightly.
- Zoned schools: Jefferson Elem (math 44% / reading 64%, grade C, #621 of 4,322 statewide, top 15%, 491 students, 64% FRL); Francisco Barrientes Middle (math 12% / reading 33%, grade F, #1,341 of 1,662 statewide, top 82%, 1,215 students, 83% FRL); Edinburg H S (math 14% / reading 35%, grade F, #1,264 of 1,632 statewide, top 82%, 2,433 students, 83% FRL).
- Market conditions: Rents soft (-0.5%/yr); 406 active listings in the ZIP; 40 comparable units currently listed for rent nearby; rentals lingering (median 44d on market — plan ~5-8 weeks vacancy on turnover, expect pricing pressure); 60% of comp listings sitting > 30 days — soft ceiling on asking rent; 7,378 units permitted in Hidalgo County in 2024 (641 in 5+ unit buildings).
Forward outlook
- Local home prices are declining (-3.0%/yr); year-one equity from $519 of loan paydown is wiped out by about $2k of value loss. Plan a longer hold.
- Hidalgo County population projected at +28% by 2050 — long-run rental-demand tailwind backs the buy-and-hold thesis.
Negotiation context
- It's been on market 21 days — a 2% lower offer ($74k) is reasonable based on typical stale-listing flexibility.
- 2 sale attempts since 2y ago with the ask held roughly flat each time — persistent listings suggest the price (not the market) is what's stuck; bring a comps-based counter.
Risks & watch-outs
- Watch-outs: property tax is 3.9% of price.
- Climate carrying-cost: major flood risk; severe wind risk, 99% chance of damaging wind over 30y; major wildfire risk; extreme-heat days projected 7→23/yr by 2055 (HVAC capex compounding) — expect insurance premiums to compound above CPI over the hold.
Questions for the listing agent
- Property tax is high relative to price — has the assessment been appealed recently, and will the sale trigger a re-assessment?
- Is there a deadline driving the sale (1031 exchange, divorce, estate, relocation)? That informs how much negotiation room exists.
- Schools are D-rated, which usually means shorter tenancies and higher turnover. Who's the typical renter profile here, and what's been the actual vacancy rate?
- What's the average days-on-market for RENTAL listings here right now (not sales)? A rising rental-DOM trend means longer vacancies and softer asking-rent achievability than the comps imply.
- What's the recent tenant-quality profile in this submarket — average credit score on applications, eviction rate, late-payment / NSF rate, and stable-employment percentage? A property-management company in the area should have these aggregated.
- How much new for-sale + rental construction is in the pipeline within 1–3 miles? Heavy new supply typically softens prices + rents 12–24 months out; constrained supply supports both.
Investment metrics
- 1% rule
- 1.54% ✓
- Cap rate
- 10.16%
- Cash-on-cash
- 13.82%
- DSCR
- 1.61
- GRM
- 5.4
CMA / ARV
- ARV (on-the-fly)
- $146,544
- Comps found
- 9
Show comp detail 9 sales within ~0.75 mi
| Address | Dist | Beds/Ba | Sqft | Sold | Price | $/sf | Match |
|---|---|---|---|---|---|---|---|
| 609 E Sprague St | 0.05mi | 2/1.0 (-1) | 996 (-4%) | 11mo | $155,000 | $156 | 78 |
| 902 S 16th Ave | 0.13mi | 3/2.0 | 1,054 (+2%) | 14mo | $149,900 | $142 | 75 |
| 811 S 19th Ave | 0.18mi | 3/1.0 | 1,102 (+7%) | 21mo | $139,999 | $127 | 63 |
| 413 W Mahl St | 0.72mi | 3/1.0 | 1,009 (-2%) | 5mo | $148,888 | $148 | 58 |
| 1014 E Peter St | 0.74mi | 3/2.0 | 1,008 (-2%) | 14mo | $155,000 | $154 | 46 |
| 401 W Champion St | 0.63mi | 3/1.0 | 1,080 (+5%) | 22mo | $130,000 | $120 | 44 |
| 901 E Peter St | 0.74mi | 3/1.0 | 1,066 (+3%) | 22mo | $159,900 | $150 | 41 |
| 902 S 8th Ave S | 0.61mi | 3/1.0 | 1,116 (+8%) | 22mo | $115,000 | $103 | 40 |
| 1421 S 12th Ave | 0.61mi | 2/2.0 (-1) | 1,124 (+9%) | 10mo | $144,900 | $129 | 39 |
Match score weights: distance 35% · size 25% · config 20% · recency 20%. Top-matched comps best support the ARV.
Projected returns pro-forma
-3.0% appreciation · 0.0% rent growth · sell at horizon
- IRR
- -0.0%
- Equity multiple
- 1.00×
- Total profit
- $-27
- Equity at exit
- $11,183
- IRR
- 5.5%
- Equity multiple
- 1.34×
- Total profit
- $7,178
- Equity at exit
- $6,485
Cash invested: $21,000 (down + closing). Projections, not guarantees.
Landlord ↔ Tenant lean methodology
- Overall (STATE)
- 87 Strongly Landlord-Friendly
- State Texas
- 87 Strongly Landlord-Friendly · R+5
- County
- — inherits STATE
- City
- — inherits STATE
ZIP-level market 78539
- Home prices YoY
- -19.6%
- Rents YoY
- -0.5%
- Active inventory
- 406
- Price-to-rent
- 5.4×
Monthly cashflow live
- Estimated rent
- $1,155 high interval (Pro) →
- Mortgage (P&I)
- −$393
- Tax from tax record
- −$246 /mo · $2,952/yr
- Insurance
- −$31
- HOA
- −$0
- Vacancy / Maint / Mgmt
- −$243
- Net cashflow
- $242
Break-even live
UW: 25.0% down · 7.5% · 30yr · 1.5% tax · 5.0% vac · 8.0% maint · 8.0% mgmt
Financing live
Cash to close
- Down payment
- $18,750
- Closing costs
- $2,250
- Reserves months
- —
- Total cash needed
- —
Loan-product check · same deal, 3 products live
Conventional
25% down · 7.5% · 30yr
- Down + closing
- —
- Monthly P&I
- —
- Monthly cashflow
- —
- DSCR
- —
- Eligible?
- —
Personal DTI + credit; lowest rate.
DSCR
20% down · 8.5% · 30yr
- Down + closing
- —
- Monthly P&I
- —
- Monthly cashflow
- —
- DSCR
- —
- Eligible?
- —
No personal income docs; deal must DSCR.
Hard money
10% down · 12.0% · 12mo
- Down + closing
- —
- Monthly P&I
- —
- Monthly cashflow
- —
- DSCR
- —
- Eligible?
- —
Short-term bridge; refi at stabilization.
Rent comps 40 comps
| Address | Beds | Baths | Sqft | Rent | $/sqft | DOM | Units | Dist |
|---|---|---|---|---|---|---|---|---|
| 811 S 19th Ave Edinburg, TX | 3.0 | 2.0 | 1102 | $1,500 | $1.36 | 43d | 1 | 0.17mi |
| 1005 Saltillo St Edinburg, TX | 4.0 | 1.0 | 1368 | $1,400 | $1.02 | 23d | 1 | 0.25mi |
| 220 S 25th Ave Edinburg, TX | 1.0–3.0 | 1.0 | 773 | $899 | $1.16 | 14d | 6 | 0.77mi |
| 112 E Peter St Unit 3 Edinburg, TX | 2.0 | 1.0 | 850 | $975 | $1.15 | 43d | 1 | 0.80mi |
| 805 Dove Ave Unit 1 Edinburg, TX | 2.0 | 2.0 | 945 | $1,150 | $1.22 | 43d | 1 | 0.91mi |
| 604 E Schunior St Edinburg, TX | 3.0 | 2.0 | 1100 | $1,150 | $1.05 | 43d | 1 | 0.92mi |
| 816 Dove Ave Unit 2 Edinburg, TX | 2.0 | 2.0 | 1000 | $1,250 | $1.25 | 43d | 1 | 0.93mi |
| 1814 E Iowa Rd Edinburg, TX | 2.0 | 2.5 | 1200 | $950 | $0.79 | 23d | 1 | 1.12mi |
| 1105 W Stubbs St Unit C Edinburg, TX | 2.0 | 1.5 | 960 | $800 | $0.83 | 23d | 1 | 1.14mi |
| 1105 W Stubbs St Unit C Edinburg, TX | 2.0 | 1.5 | 960 | $800 | $0.83 | 43d | 1 | 1.14mi |
| 2218 S Tourist Dr Unit J Edinburg, TX | 2.0 | 2.5 | 1172 | $850 | $0.73 | 21d | 1 | 1.16mi |
| 1920 E Iowa Rd Edinburg, TX | 2.0 | 1.0 | 725 | $695 | $0.96 | 44d | 1 | 1.17mi |
| 1920 E Iowa Rd Apt 2 Edinburg, TX | 2.0 | 1.0 | 725 | $695 | $0.96 | 43d | 1 | 1.17mi |
| 1920 E Iowa Rd Edinburg, TX | 2.0 | 1.0 | 735 | $695 | $0.95 | 23d | 1 | 1.17mi |
| 2314 W Stubbs St Unit A Edinburg, TX | 2.0 | 2.0 | 1069 | $875 | $0.82 | 43d | 1 | 1.19mi |
| 2120 S Oakview Dr Unit 2 Edinburg, TX | 2.0 | 2.0 | 972 | $1,250 | $1.29 | 43d | 1 | 1.20mi |
| 305 S Raul Longoria Rd Edinburg, TX | 2.0 | 2.0 | 1000 | $1,350 | $1.35 | 43d | 1 | 1.20mi |
| 1920 E Iowa Rd Apt 5 Edinburg, TX | 2.0 | 1.0 | 725 | $725 | $1.00 | 23d | 1 | 1.20mi |
| 2200 S Oakview Dr Unit 2 Edinburg, TX | 2.0 | 2.0 | 972 | $1,250 | $1.29 | 43d | 1 | 1.22mi |
| 420 W Chavez St Unit 4 Edinburg, TX | 3.0 | 2.0 | 1100 | $1,250 | $1.14 | 43d | 1 | 1.25mi |
| 414 Pirul St Unit 1 Edinburg, TX | 2.0 | 2.0 | 750 | $800 | $1.07 | 43d | 1 | 1.28mi |
| 2301 S Oakview Dr Unit 2 Edinburg, TX | 3.0 | 2.0 | 1164 | $1,225 | $1.05 | 43d | 1 | 1.28mi |
| 1415 W Freddy Gonzalez Dr Edinburg, TX | 1.0–3.0 | 1.0–2.0 | 806 | $975 | $1.21 | 23d | 1 | 1.31mi |
| 406 N Lotto Ln Unit 4 Edinburg, TX | 2.0 | 2.0 | 850 | $850 | $1.00 | 43d | 1 | 1.31mi |
| 110 Teak Dr Unit 3 Edinburg, TX | 2.0 | 2.0 | 1021 | $900 | $0.88 | 23d | 1 | 1.32mi |
| 106 Teak Dr Unit 3 Edinburg, TX | 2.0 | 2.0 | 1100 | $1,100 | $1.00 | 43d | 1 | 1.32mi |
| 106 Teak Dr Unit 4 Edinburg, TX | 2.0 | 2.0 | 1100 | $1,100 | $1.00 | 14d | 1 | 1.32mi |
| 136 E Wells St Edinburg, TX | 3.0 | 1.0 | 961 | $1,200 | $1.25 | 43d | 1 | 1.32mi |
| 204 Teak Dr Unit 3 Edinburg, TX | 2.0 | 2.0 | 1050 | $1,000 | $0.95 | 43d | 1 | 1.32mi |
| 204 Teak Dr Unit 1 Edinburg, TX | 2.0 | 2.0 | 1050 | $900 | $0.86 | 23d | 1 | 1.32mi |
| 418 Lotto Ln Edinburg, TX | 2.0 | 2.0 | 850 | $900 | $1.06 | 14d | 1 | 1.33mi |
| 1210 Upas Dr Unit 3 Edinburg, TX | 3.0 | 2.0 | 1130 | $1,150 | $1.02 | 43d | 1 | 1.35mi |
| 507 Lotto Ln Unit 1 Edinburg, TX | 2.0 | 2.0 | 861 | $800 | $0.93 | 14d | 1 | 1.36mi |
| 1212 White Oak Dr Unit 2 Edinburg, TX | 3.0 | 2.0 | 1250 | $1,100 | $0.88 | 43d | 1 | 1.39mi |
| 1211 White Oak Dr Unit 3 Edinburg, TX | 2.0 | 2.0 | 1050 | $1,050 | $1.00 | 43d | 1 | 1.39mi |
| 1211 White Oak Dr Unit 4 Edinburg, TX | 3.0 | 2.0 | 1150 | $1,050 | $0.91 | 23d | 1 | 1.39mi |
| 2208 Taxco Ct Unit 4 Edinburg, TX | 2.0 | 2.0 | 980 | $975 | $0.99 | 43d | 1 | 1.40mi |
| 2208 Taxco Ct Unit 3 Edinburg, TX | 3.0 | 2.0 | 1120 | $1,075 | $0.96 | 43d | 1 | 1.40mi |
| 1222 Upas Dr Unit C Edinburg, TX | 2.0 | 2.0 | 862 | $900 | $1.04 | 23d | 1 | 1.40mi |
| 1222 Upas Dr Edinburg, TX | 2.0 | 2.0 | 862 | $900 | $1.04 | 14d | 1 | 1.40mi |
Listing history 18 events
-
2026-06-18days on market $75,000 Active 21 DOM
-
2026-06-17days on market $75,000 Active 20 DOM
-
2026-06-16days on market $75,000 Active 19 DOM
-
2026-06-15days on market $75,000 Active 18 DOM
-
2026-06-14days on market $75,000 Active 16 DOM
-
2026-06-13days on market $75,000 Active 15 DOM
-
2026-06-10days on market $75,000 Active 13 DOM
-
2026-06-09days on market $75,000 Active 12 DOM
-
2026-06-08days on market $75,000 Active 11 DOM
-
2026-06-07days on market $75,000 Active 10 DOM
-
2026-06-03days on market $75,000 Active 6 DOM
-
2026-06-02days on market $75,000 Active 5 DOM
-
2026-06-01days on market $75,000 Active 4 DOM
-
2026-05-31days on market $75,000 Active 3 DOM
-
2026-05-31days on market $75,000 Active 2 DOM
-
2026-05-28$75,000 Active
-
2024-01-10$119,000 Active
-
1995-01-10soldstatus
ⓘ Source: listings_history table (triggers on properties + properties_extension) + one-shot
backfill from property_details.listing_events for pre-trigger history.
Tax reassessment forecast TX · Resets to sale price
- Current annual tax
- $2,952 · $246/mo
- Projected year-2 tax
- $2,952 · $246/mo
- Expected delta
- $0/yr ($0/mo · 0.0%)
ⓘ Screening estimate from a state-policy table — verify with the county assessor before closing.
Climate risk First Street
- Flood 6/10 Major FEMA zone X (shaded) · 69% chance over 30 yrs
- Wildfire 7/10 Severe
- Heat 9/10 Extreme 7 d/yr ≥111°F today · 23 d/yr by 30 yrs out
- Wind 8/10 Severe 99% chance of damaging wind over 30 yrs
- Air quality 2/10 Low 0 unhealthy d/yr today · 1 by 30 yrs out
Nearby sold comps map
Loading sold comps map…
Walkable amenities ~0.75 mi
Loading nearby amenities…
Taxation est. · year 1
- Rental income
- $13,858
- − Mortgage interest
- −$4,201
- − Property taxes
- −$2,952
- − Insurance
- −$375
- − Repairs & maintenance
- −$1,109
- − Management
- −$1,109
- − Depreciation
- −$2,182
- Taxable income
- $1,931
- Est. tax owed @ 24.0%
- −$463
- After-tax cash flow
- $2,438/yr
For passive investors: Depreciation is non-cash, so a rental often shows a tax loss while cash-flowing — sheltering income. Rental losses are passive: they offset passive income freely, and up to $25,000/yr can offset ordinary (W-2) income if you actively participate and your MAGI is under $100k (phasing out to $0 by $150k); unused losses carry forward. On sale, claimed depreciation is recaptured at up to 25%, and gains may owe capital-gains tax (a 1031 exchange can defer both). Figures are a year-1 estimate at your 24.0% rate — not tax advice; consult a CPA.
Schools (NCES district)
- District
- Edinburg CISD
- NCES district ID
- 4818180
- Math proficiency
- 20% ▼ -34.00%
- Reading proficiency
- 34% ▼ -11.00%
- Median HH income
- $36,985
- Composite
- 22.42/100
- National rank
- #8114
- State rank
- #699 of 826 in TX
Livability — Edinburg
- Score
- 64/100
- State rank
- #784
- US rank
- #14319
Category grades
Schools grade is shown separately in the Schools card above.
Census & demographics
- Census place
- Edinburg, TX
- County
- Hidalgo County · 623,128 people
- City population
- 178,279
- Metro
- McAllen-Edinburg-Mission, TX
- Population (ZIP)
- 37,168
- Household income
- $66,967
- Rent vs Own
- Severe rent burden
- 1525.0
Population outlook (Hidalgo County) Hauer SSP2
- Today (2025)
- 955,232 people
- By 2030
- 1,009,774 · +5.7%
- By 2040
- 1,120,332 · +17.3%
- By 2050
- 1,225,036 · +28.2%
- By 2075
- 1,439,189 · +50.7%
- By 2100
- 1,533,429 · +60.5%
Race, ethnicity, and origin ACS 2023
- Neighborhood character
- Predominantly Hispanic (85%)
- Race & ethnicity
- Hispanic / Latino 85% Two or more races 45% White 10% Asian 4%
- Hispanic origin (detail)
- Mexican 77% Puerto Rican 1%
- Common ancestry
- Lithuanian 1% Italian 1% Romanian 1%
- Foreign-born
- 19% · Canada
- Languages at home
- 32% English-only · Spanish 64% Tagalog/Filipino 2% Other Asian/Pacific 1%
Political lean MEDSL · Hidalgo
- 2024 margin
- Toss-up / Even · D 48.1% · R 51.0%
- 2008→2024 swing
- -41.6pp toward R · 2008: 38.7pp · 2024: -2.9pp
- All cycles
- 2024: R+2.9 2020: D+17.1 2016: D+40.5 2012: D+41.8 2008: D+38.7
Not yet ingested
- Civics
- —
Market trends
- HPI YoY
- ▼ -51.52%
- Current HPI
- 211.4723
- Rent YoY
- ▼ -0.52%
- Metro
- McAllen-Edinburg-Mission, TX
- State GDP YoY
- ▲ 3.95%
- F500 in state
- 110
Industry mix (Fortune 500 HQ in TX)
| Industry | F500 HQs | Revenue |
|---|---|---|
| Energy | 16 | $1,198B |
|
||
| Technology | 5 | $198B |
|
||
| Engineering / Construction | 4 | $72B |
|
||
| Energy Services | 3 | $60B |
|
||
| Utilities | 3 | $41B |
|
||
| Healthcare | 2 | $330B |
|
||
Price history
-37.0% since first listed3 events — show timeline
- 2026-05-28 Listed $75,000 MCALLENMLS
- 2024-01-10 Listed $119,000 MCALLENMLS
- 1995-01-10 Sold (Public Records) — Public Records
Property tax history
+9.2%/yrLatest (2025): $2,952 · +19.5% YoY. Source: county tax records.
Cash-flow waterfall
monthlySold comps — $/sqft
last 12 mo · ≤1 miLoading sold comps…