 🏷️ Likely Rental
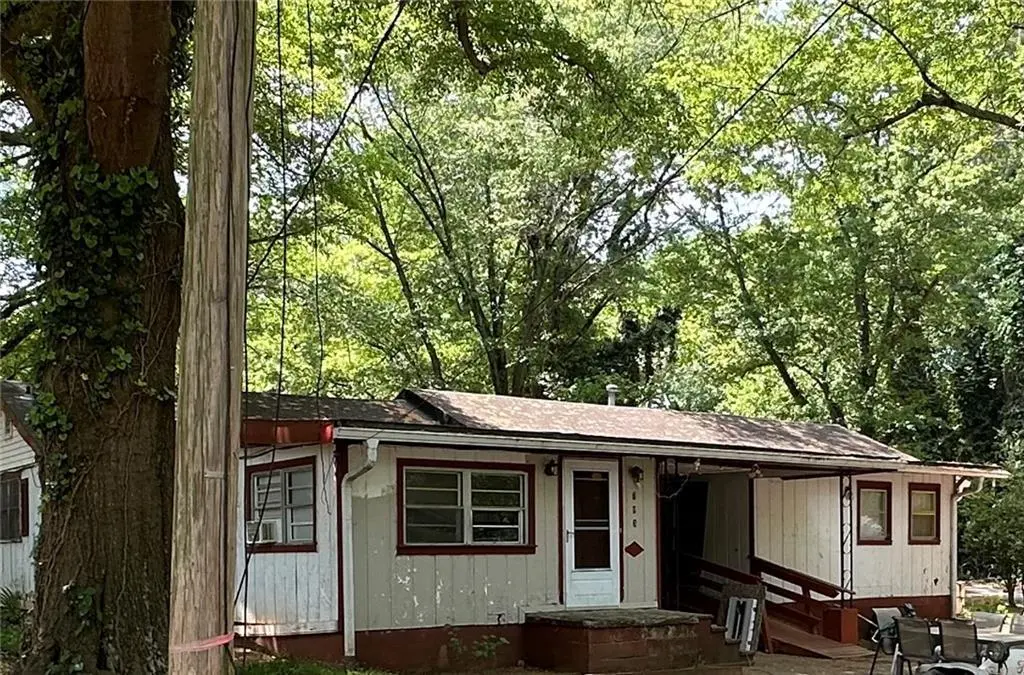
703 Ruby St · Marietta, GA
Flood risk 1/10 · Minimal
- FEMA flood zone
- X (unshaded)
- Chance of flooding over 30 yrs
- 0.0%
- Est. flood insurance / yr
- $507 – $1,088
Fire risk 1/10 · Minimal
- Est. fire insurance / yr
- $963 – $1,789
Heat risk 5/10 · Moderate
- Hot days now (above 102°F)
- 7 days/yr
- Hot days in 30 yrs
- 17 days/yr
Wind risk 4/10 · Minor
- Chance of severe wind over 30 yrs
- 20.0%
Air-quality risk 4/10 · Minor
- Unhealthy air days now
- 5 days/yr
- Unhealthy air days in 30 yrs
- 8 days/yr
Risk factors via First Street. Map © Google.
Why this score? — see what drove the C+ grade
The composite is a weighted blend of 9 inputs, each scored 0–100. Each bar is that input's sub-score; the figure is the points it added to the 100-point composite (weight × sub-score).
- Cash flow +23.1/30.0
- ARV discount +15.0/15.0
- DSCR +7.4/10.0
- 1% rule +5.0/10.0
- Livability +4.2/5.0
- Schools +3.2/10.0
- Condition / age +2.5/5.0
- Rent growth +2.4/5.0
- Appreciation +0.0/10.0
$270,000
🖨 Deal sheet 📄 Offer letter ✓ Due diligence
Multi-family units
County records classify this as Multi-Family (2-4 Unit). Listing-text estimate: 1 unit. estimate disagrees with records
Listing remarks MLS
Investor special with endless potential! 703 Ruby St is one of four available properties, offering a great opportunity for investors, builders, or redevelopment projects. Property is being sold AS-IS and is currently zoned residential with future commercial potential. Excellent teardown opportunity for builders or investors looking to maximize value. Three of the four available homes are currently tenant occupied, creating additional investment opportunities nearby. Convenient location with strong upside for rental income, redevelopment, or long-term hold.
Key facts
- Zoned residential
- Teardown opportunity
- Convenient location
Tags
Property features AI
Exterior
- Parking: Driveway with open parking
- Utilities: Public water; Public sewer; Other electric; Other utilities
- Home design: One-level home; Fixer condition
- Construction: Shingle roof; Slab foundation; Other construction materials; Built on WEST OAK LOT 9 BLOCK C
- Exterior features: Paved road access
Interior
- Kitchen: Breakfast room
- Bedrooms: Master suite on the main level; Four main-level bedrooms
- Flooring: Other flooring
- Bathrooms: Six full bathrooms (all on main level)
- Heating & cooling: Other heating; Other cooling
- Interior features: No common walls; Crawl space basement; Open-concept dining area; Breakfast room off the kitchen; Main-level laundry
- Laundry & utility: Laundry on the main level
Neighborhood map
What this means for you Summary
Snapshot
- This is a 3-bed/3.0-bath multifamily listed at $270k.
Deal economics
- At list price, monthly cash flow is $484 ($6k/yr) — positive.
- The deal already cash-flows at list — no discount required.
- Meets the 1% rule at list price ($3k rent vs $270k).
- Recommended offer: $262k (3.0% below list) — sets the bar for market timing.
- Cap rate 8.4% vs local median 3.2% in Marietta — top-decile yield for the area; either an underpriced asset or a hidden risk that comps aren't pricing in. Stress-test before assuming the spread holds.
Location & tenants
- Location reads 83/100 on livability (#7 in GA, #976 nationally) — a professional / high-income tenant draw. Strengths: amenities A+, commute A+, housing A+.
- Marietta City (urban): math 37% / reading 38% proficiency, ranked #55 of 174 in GA (top 32%) — families likely to look elsewhere, expect single-tenant / working-renter base with shorter leases.
- Zoned schools: Lockheed Elementary School (math 17% / reading 13%, grade F, #981 of 1,228 statewide, top 80%, 736 students, 85% FRL); Marietta Middle School (math 36% / reading 37%, grade F, #167 of 470 statewide, top 38%, 1,316 students, 62% FRL); Marietta High School (math 20% / reading 15%, grade F, #264 of 424 statewide, top 63%, 2,626 students, 55% FRL).
- Zoned-school proficiency averages 23% at this address vs 38% district-wide (-14 pts) — the specific schools serving this property underperform the Marietta City average; the district grade overstates school quality for this exact location.
- Market conditions: Rents soft (-0.4%/yr); 443 active listings in the ZIP; 4 comparable units currently listed for rent nearby; rentals at typical pace (median 24d on market — plan ~3-4 weeks tenant-placement turnaround); high-income renter base; 1,625 units permitted in Cobb County in 2024 (389 in 5+ unit buildings).
Forward outlook
- Local home prices are declining (-3.0%/yr); year-one equity from $2k of loan paydown is wiped out by about $8k of value loss. Plan a longer hold.
- Cobb County population projected at +33% by 2050 — long-run rental-demand tailwind backs the buy-and-hold thesis.
Negotiation context
- It's been on market 38 days — a 3% lower offer ($262k) is reasonable based on typical stale-listing flexibility.
- 2 sale attempts with the ask held roughly flat each time — persistent listings suggest the price (not the market) is what's stuck; bring a comps-based counter.
- Current owner paid $205k; 32% above their basis — modest negotiation headroom, anchor on the comps not their cost.
Risks & watch-outs
- Watch-outs: built in 1953 — expect roof / HVAC / electrical / plumbing capex.
- Climate carrying-cost: extreme-heat days projected 7→17/yr by 2055 (HVAC capex compounding) — expect insurance premiums to compound above CPI over the hold.
Questions for the listing agent
- It's been on market 38 days. Have you received any prior offers? Is the seller open to a 3% concession, seller financing, or rate buy-down credit?
- Built in 1953 — when were the roof, HVAC, electrical panel, plumbing, and water heater last replaced?
- Is there a deadline driving the sale (1031 exchange, divorce, estate, relocation)? That informs how much negotiation room exists.
- Schools are B-rated — typically a magnet for longer-tenancy family renters. What's the average tenant stay here, and is there a school-zone premium baked into asking?
- What's the average days-on-market for RENTAL listings here right now (not sales)? A rising rental-DOM trend means longer vacancies and softer asking-rent achievability than the comps imply.
- What's the recent tenant-quality profile in this submarket — average credit score on applications, eviction rate, late-payment / NSF rate, and stable-employment percentage? A property-management company in the area should have these aggregated.
- How much new apartment / multifamily construction is in the pipeline within 1–3 miles? Heavy new supply (>2% of stock underway) typically softens rents 12–24 months out; light construction supports rent growth.
Investment metrics
- 1% rule
- 1.00% ✓
- Cap rate
- 8.44%
- Cash-on-cash
- 7.68%
- DSCR
- 1.34
- GRM
- 8.3
CMA / ARV
- ARV (median comp)
- $508,779
- List price
- $270,000
- Delta
- -46.93%
- Verdict
- UNDERPRICED
- Comps
- 20 within 1.0 mi
Projected returns pro-forma
-3.0% appreciation · 0.0% rent growth · sell at horizon
- IRR
- -7.7%
- Equity multiple
- 0.72×
- Total profit
- $-20,977
- Equity at exit
- $40,258
- IRR
- -2.2%
- Equity multiple
- 0.87×
- Total profit
- $-9,663
- Equity at exit
- $23,345
Cash invested: $75,600 (down + closing). Projections, not guarantees.
Landlord ↔ Tenant lean methodology
- Overall (STATE)
- 90 Strongly Landlord-Friendly
- State Georgia
- 90 Strongly Landlord-Friendly · R+3
- County
- — inherits STATE
- City
- — inherits STATE
ZIP-level market 30066
- Rents YoY
- -0.4%
- Active inventory
- 443
- Price-to-rent
- 8.3×
Monthly cashflow live
- Estimated rent
- $2,712 medium interval (Pro) →
- Mortgage (P&I)
- −$1,416
- Tax from tax record
- −$131 /mo · $1,568/yr
- Insurance
- −$112
- HOA
- −$0
- Vacancy / Maint / Mgmt
- −$570
- Net cashflow
- $484
Break-even live
UW: 25.0% down · 7.5% · 30yr · 1.5% tax · 5.0% vac · 8.0% maint · 8.0% mgmt
Financing live
Cash to close
- Down payment
- $67,500
- Closing costs
- $8,100
- Reserves months
- —
- Total cash needed
- —
Loan-product check · same deal, 3 products live
Conventional
25% down · 7.5% · 30yr
- Down + closing
- —
- Monthly P&I
- —
- Monthly cashflow
- —
- DSCR
- —
- Eligible?
- —
Personal DTI + credit; lowest rate.
DSCR
20% down · 8.5% · 30yr
- Down + closing
- —
- Monthly P&I
- —
- Monthly cashflow
- —
- DSCR
- —
- Eligible?
- —
No personal income docs; deal must DSCR.
Hard money
10% down · 12.0% · 12mo
- Down + closing
- —
- Monthly P&I
- —
- Monthly cashflow
- —
- DSCR
- —
- Eligible?
- —
Short-term bridge; refi at stabilization.
Rent comps 4 comps
| Address | Beds | Baths | Sqft | Rent | $/sqft | DOM | Units | Dist |
|---|---|---|---|---|---|---|---|---|
| 552 Duke Dr Marietta, GA | 4.0 | 3.0 | 3362 | $2,450 | $0.73 | 43d | 1 | 0.51mi |
| 1986 Bells Ferry Rd Marietta, GA | 3.0 | 2.0 | 2125 | $1,950 | $0.92 | 12d | 1 | 0.93mi |
| 1362 Valmont Trce NE Marietta, GA | 4.0 | 3.5 | 2262 | $2,700 | $1.19 | 24d | 1 | 1.04mi |
| 146 Willowfern Ln Marietta, GA | 4.0 | 3.5 | 2890 | $5,000 | $1.73 | 1d | 1 | 1.19mi |
Listing history 16 events
-
2026-06-18days on market $270,000 Active 38 DOM
-
2026-06-17days on market $270,000 Active 37 DOM
-
2026-06-16days on market $270,000 Active 36 DOM
-
2026-06-15days on market $270,000 Active 35 DOM
-
2026-06-13days on market $270,000 Active 33 DOM
-
2026-06-09days on market $270,000 Active 29 DOM
-
2026-06-08days on market $270,000 Active 28 DOM
-
2026-06-07days on market $270,000 Active 27 DOM
-
2026-06-04days on market $270,000 Active 24 DOM
-
2026-06-03days on market $270,000 Active 23 DOM
-
2026-06-02days on market $270,000 Active 22 DOM
-
2026-06-01days on market $270,000 Active 21 DOM
-
2026-05-31days on market $270,000 Active 20 DOM
-
2026-05-11$270,000 Active 562-char remark
-
2026-05-10$270,000 New 562-char remark
Show marketing remark (562 chars)
Investor special with endless potential! 703 Ruby St is one of four available properties, offering a great opportunity for investors, builders, or redevelopment projects. Property is being sold AS-IS and is currently zoned residential with future commercial potential. Excellent teardown opportunity for builders or investors looking to maximize value. Three of the four available homes are currently tenant occupied, creating additional investment opportunities nearby. Convenient location with strong upside for rental income, redevelopment, or long-term hold.
-
2008-04-10soldstatus $205,000
ⓘ Source: listings_history table (triggers on properties + properties_extension) + one-shot
backfill from property_details.listing_events for pre-trigger history.
Tax reassessment forecast GA · Resets to sale price
- Current annual tax
- $1,568 · $131/mo
- Projected year-2 tax
- $2,484 · $207/mo
- Expected delta
- +$916/yr (+$76/mo · 58.4%)
ⓘ Screening estimate from a state-policy table — verify with the county assessor before closing.
Climate risk First Street
- Flood 1/10 Low FEMA zone X (unshaded) · 0% chance over 30 yrs
- Wildfire 1/10 Low
- Heat 5/10 Major 7 d/yr ≥102°F today · 17 d/yr by 30 yrs out
- Wind 4/10 Moderate 20% chance of damaging wind over 30 yrs
- Air quality 4/10 Moderate 5 unhealthy d/yr today · 8 by 30 yrs out
Nearby sold comps map
Loading sold comps map…
Walkable amenities ~0.75 mi
Loading nearby amenities…
Taxation est. · year 1
- Rental income
- $32,549
- − Mortgage interest
- −$15,124
- − Property taxes
- −$1,568
- − Insurance
- −$1,350
- − Repairs & maintenance
- −$2,604
- − Management
- −$2,604
- − Depreciation
- −$7,855
- Taxable income
- $1,445
- Est. tax owed @ 24.0%
- −$347
- After-tax cash flow
- $5,458/yr
For passive investors: Depreciation is non-cash, so a rental often shows a tax loss while cash-flowing — sheltering income. Rental losses are passive: they offset passive income freely, and up to $25,000/yr can offset ordinary (W-2) income if you actively participate and your MAGI is under $100k (phasing out to $0 by $150k); unused losses carry forward. On sale, claimed depreciation is recaptured at up to 25%, and gains may owe capital-gains tax (a 1031 exchange can defer both). Figures are a year-1 estimate at your 24.0% rate — not tax advice; consult a CPA.
Schools (NCES district)
- District
- Marietta City
- NCES district ID
- 1303510
- Math proficiency
- 37% ▼ -8.00%
- Reading proficiency
- 38% ▼ -8.00%
- Median HH income
- $46,226
- Composite
- 32.06/100
- National rank
- #5818
- State rank
- #55 of 174 in GA
Livability — Marietta
- Score
- 83/100
- State rank
- #7
- US rank
- #976
Category grades
Schools grade is shown separately in the Schools card above.
Census & demographics
- Census place
- Marietta, GA
- County
- Cobb County · 777,758 people
- City population
- 331,369
- Metro
- Atlanta-Sandy Springs-Alpharetta, GA
- Population (ZIP)
- 61,761
- Household income
- $116,074
- Rent vs Own
- Severe rent burden
- 1101.0
Population outlook (Cobb County) Hauer SSP2
- Today (2025)
- 868,385 people
- By 2030
- 929,614 · +7.1%
- By 2040
- 1,047,533 · +20.6%
- By 2050
- 1,155,537 · +33.1%
- By 2075
- 1,405,030 · +61.8%
- By 2100
- 1,555,058 · +79.1%
Race, ethnicity, and origin ACS 2023
- Neighborhood character
- Diverse neighborhood (Simpson 0.57)
- Race & ethnicity
- White 62% Black 16% Hispanic / Latino 10% Two or more races 10% Asian 6%
- Hispanic origin (detail)
- Mexican 4% Puerto Rican 1% Cuban 1%
- Common ancestry
- Italian 2% Slovak 2% Lithuanian 2%
- Foreign-born
- 15% · Canada, Vietnam, China
- Languages at home
- 82% English-only · Spanish 7% Other Indo-European 4% Other Asian/Pacific 1%
Political lean MEDSL · Cobb
- 2024 margin
- D (+14.9) · D 56.9% · R 42.0% · Other 1.1%
- 2008→2024 swing
- +24.3pp toward D · 2008: -9.4pp · 2024: 14.9pp
- All cycles
- 2024: D+14.9 2020: D+14.3 2016: D+2.1 2012: R+12.6 2008: R+9.4
Not yet ingested
- Civics
- —
Market trends
- HPI YoY
- ▼ -269.40%
- Current HPI
- 250.037
- Rent YoY
- ▼ -0.38%
- Metro
- Atlanta-Sandy Springs-Alpharetta, GA
- State GDP YoY
- ▲ 2.66%
- F500 in state
- 28
Industry mix (Fortune 500 HQ in GA)
| Industry | F500 HQs | Revenue |
|---|---|---|
| Paper / Packaging | 2 | $29B |
|
||
| Retail | 1 | $160B |
|
||
| Transportation / Logistics | 1 | $91B |
|
||
| Airlines | 1 | $62B |
|
||
| Consumer Goods | 1 | $47B |
|
||
| Utilities | 1 | $25B |
|
||
Price history
+31.7% since first listed3 events — show timeline
- 2026-05-11 Listed $270,000 FMLS
- 2026-05-10 Listed $270,000 GAMLS
- 2008-04-10 Sold (Public Records) $205,000 Public Records
Property tax history
+14.8%/yrLatest (2025): $1,568 · +24.7% YoY. Source: county tax records.
Cash-flow waterfall
monthlySold comps — $/sqft
last 12 mo · ≤1 miLoading sold comps…