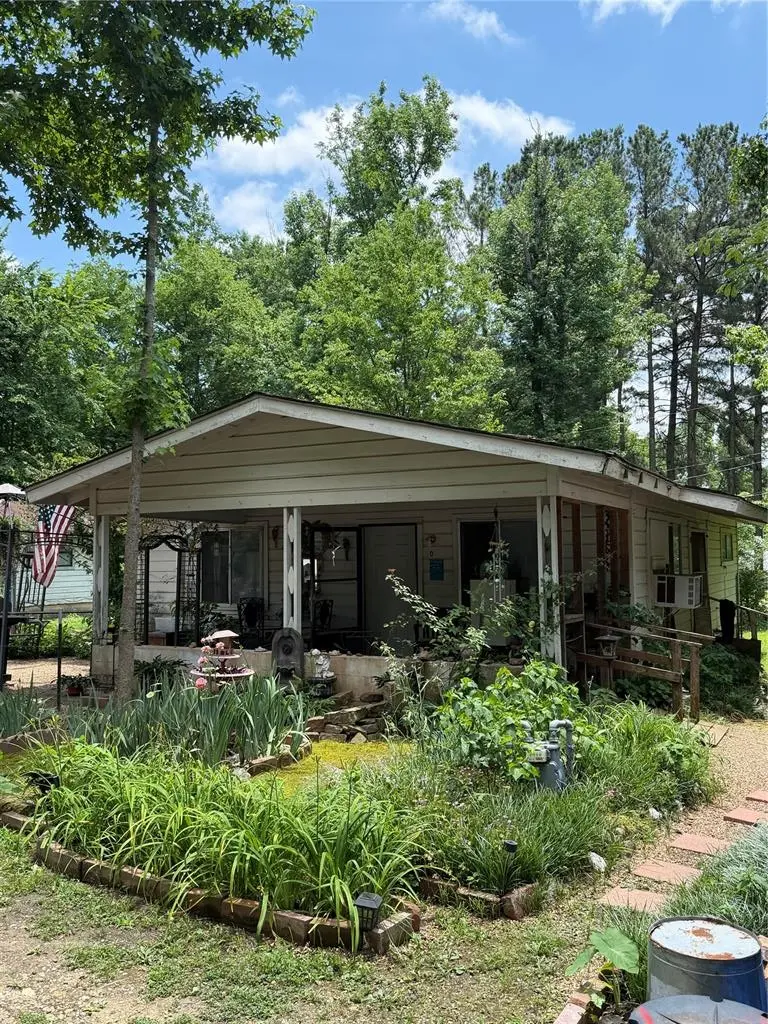
203 Tanglewood St · Broken Bow, OK
Flood risk 1/10 · Minimal
- FEMA flood zone
- X (unshaded)
- Chance of flooding over 30 yrs
- 0.0%
- Est. flood insurance / yr
- $507 – $1,088
Fire risk 6/10 · Moderate
- Est. fire insurance / yr
- $2,463 – $4,575
Heat risk 6/10 · Moderate
- Hot days now (above 112°F)
- 7 days/yr
- Hot days in 30 yrs
- 22 days/yr
Wind risk 4/10 · Minor
- Chance of severe wind over 30 yrs
- 10.0%
Air-quality risk 1/10 · Minimal
- Unhealthy air days now
- 0 days/yr
- Unhealthy air days in 30 yrs
- 0 days/yr
Risk factors via First Street. Map © Google.
Why this score? — see what drove the B grade
The composite is a weighted blend of 9 inputs, each scored 0–100. Each bar is that input's sub-score; the figure is the points it added to the 100-point composite (weight × sub-score).
- Cash flow +28.9/30.0
- DSCR +10.0/10.0
- Appreciation +9.4/10.0
- ARV discount +7.5/15.0
- 1% rule +6.8/10.0
- Livability +3.4/5.0
- Rent growth +2.5/5.0
- Condition / age +2.5/5.0
- Schools +1.5/10.0
$75,000
🖨 Deal sheet 📄 Offer letter ✓ Due diligence
Listing remarks
Located in Broken Bow, this older home at 203 Tanglewood St offers great investment potential with an established renter already in place. The property could benefit from remodeling and updates, making it an excellent opportunity for investors looking to add value. Conveniently situated just 2 minutes from town and approximately 10 minutes from Hochatown, the location provides easy access to shopping, dining, and area attractions. The home sits on a beautiful lot next to another property also listed for sale by the same owner, creating the unique possibility of purchasing two neighboring rental homes together.
Key facts
- Beautiful lot
- 0.28 acre lot
- Built 1962
Tags
Property features AI
Finance
- Other: Located in Pine View addition
- Financial info: Assumability unknown; Loan qualification unknown
- HOA & community: No mandatory association dues
Exterior
- Utilities: Homestead not claimed
- Home design: Single-family residence; One-story; Existing property
- Construction: Frame construction; Composition roof; Slab foundation; Built (year not provided)
- Exterior features: Covered porch; Rural lot
Interior
- Bedrooms: 2 bedrooms
- Bathrooms: 1 full bathroom
- Heating & cooling: Floor furnace heating; Window air conditioning units
- Interior features: One living area; No fireplace
Neighborhood map
What this means for you Summary
Snapshot
- This is a 2-bed/1.0-bath single-family listed at $75k.
Deal economics
- At list price, monthly cash flow is $254 ($3k/yr) — positive.
- The deal already cash-flows at list — no discount required.
- Meets the 1% rule at list price ($888 rent vs $75k).
- Recommended offer: $74k (1.5% below list) — sets the bar for market timing.
- Cap rate 10.4% vs local median 0.5% in Broken Bow — top-decile yield for the area; either an underpriced asset or a hidden risk that comps aren't pricing in. Stress-test before assuming the spread holds.
Location & tenants
- Location reads 67/100 on livability (#91 in OK) — a middle-class / working-renter tenant base. Strengths: cost of living A+, housing A+, health & safety A+; Watch: crime F, amenities F, commute F.
- Broken Bow (town): math 17% / reading 20% proficiency, ranked #199 of 270 in OK (top 74%) — low school quality limits family demand, transient renter base, plan for 1-2y turnover; 77% free/reduced lunch — lower-income household profile, screen leases tightly.
- Zoned schools: Bennett Es (math 27% / reading 23%, grade F, #348 of 845 statewide, top 42%, 285 students, 0% FRL); Broken Bow Hs (math 17% / reading 27%, grade F, #222 of 447 statewide, top 52%, 609 students, 0% FRL) — zoned schools average 0% FRL vs 77% district-wide (77 pts lower); this property's tenant base skews higher-income than the district average.
- Market conditions: 911 active listings in the ZIP; 16 units permitted in McCurtain County in 2024 (0 in 5+ unit buildings).
Forward outlook
- In year one you build about $7k of equity ($519 loan paydown + $7k appreciation (8.9% local appreciation)).
- McCurtain County population projected to shrink 4% by 2050 — rents likely to lag national; underwrite the cash flow, not the appreciation.
- At projected returns (8.9% appreciation + 3.0% rent growth), your $21k cash investment doubles in ~2 years — after that, you're playing with house money.
- By year 5, paydown + projected appreciation supports a ~$33k cash-out refi (75% LTV) — recoverable capital for the next deal without selling this one.
Negotiation context
- It's been on market 20 days — a 2% lower offer ($74k) is reasonable based on typical stale-listing flexibility.
Risks & watch-outs
- Climate carrying-cost: major wildfire risk; extreme-heat days projected 7→22/yr by 2055 (HVAC capex compounding) — expect insurance premiums to compound above CPI over the hold.
Questions for the listing agent
- Built in 1962 — when were the roof, HVAC, electrical panel, plumbing, and water heater last replaced?
- Is there a deadline driving the sale (1031 exchange, divorce, estate, relocation)? That informs how much negotiation room exists.
- Schools are F-rated, which usually means shorter tenancies and higher turnover. Who's the typical renter profile here, and what's been the actual vacancy rate?
- Crime grade is F in this area — have there been break-ins, vandalism, or insurance claims at this property in the last 3 years? What carrier currently insures it and at what premium?
- What's the average days-on-market for RENTAL listings here right now (not sales)? A rising rental-DOM trend means longer vacancies and softer asking-rent achievability than the comps imply.
- What's the recent tenant-quality profile in this submarket — average credit score on applications, eviction rate, late-payment / NSF rate, and stable-employment percentage? A property-management company in the area should have these aggregated.
- How much new for-sale + rental construction is in the pipeline within 1–3 miles? Heavy new supply typically softens prices + rents 12–24 months out; constrained supply supports both.
Investment metrics
- 1% rule
- 1.18% ✓
- Cap rate
- 10.36%
- Cash-on-cash
- 14.53%
- DSCR
- 1.65
- GRM
- 7.0
CMA / ARV
No comps found within radius.
Projected returns pro-forma
8.9% appreciation · 3.0% rent growth · sell at horizon
- IRR
- 33.0%
- Equity multiple
- 3.45×
- Total profit
- $51,428
- Equity at exit
- $61,624
- IRR
- 28.9%
- Equity multiple
- 7.55×
- Total profit
- $137,550
- Equity at exit
- $127,042
Cash invested: $21,000 (down + closing). Projections, not guarantees.
Landlord ↔ Tenant lean methodology
- Overall (STATE)
- 83 Strongly Landlord-Friendly
- State Oklahoma
- 83 Strongly Landlord-Friendly · R+20
- County
- — inherits STATE
- City
- — inherits STATE
ZIP-level market 74728
- Home prices YoY
- 2.8%
- Active inventory
- 911
- Price-to-rent
- 7.0×
Monthly cashflow live
- Estimated rent
- $888 medium interval (Pro) →
- Mortgage (P&I)
- −$393
- Tax from tax record
- −$23 /mo · $271/yr
- Insurance
- −$31
- HOA
- −$0
- Vacancy / Maint / Mgmt
- −$186
- Net cashflow
- $254
Break-even live
UW: 25.0% down · 7.5% · 30yr · 1.5% tax · 5.0% vac · 8.0% maint · 8.0% mgmt
Financing live
Cash to close
- Down payment
- $18,750
- Closing costs
- $2,250
- Reserves months
- —
- Total cash needed
- —
Loan-product check · same deal, 3 products live
Conventional
25% down · 7.5% · 30yr
- Down + closing
- —
- Monthly P&I
- —
- Monthly cashflow
- —
- DSCR
- —
- Eligible?
- —
Personal DTI + credit; lowest rate.
DSCR
20% down · 8.5% · 30yr
- Down + closing
- —
- Monthly P&I
- —
- Monthly cashflow
- —
- DSCR
- —
- Eligible?
- —
No personal income docs; deal must DSCR.
Hard money
10% down · 12.0% · 12mo
- Down + closing
- —
- Monthly P&I
- —
- Monthly cashflow
- —
- DSCR
- —
- Eligible?
- —
Short-term bridge; refi at stabilization.
Listing history 16 events
-
2026-06-18days on market $75,000 Active 20 DOM
-
2026-06-17days on market $75,000 Active 19 DOM
-
2026-06-17price $75,000 Active 18 DOM
-
2026-06-16days on market $90,000 Active 18 DOM
-
2026-06-15days on market $90,000 Active 17 DOM
-
2026-06-13days on market $90,000 Active 15 DOM
-
2026-06-12days on market $90,000 Active 14 DOM
-
2026-06-09days on market $90,000 Active 11 DOM
-
2026-06-08days on market $90,000 Active 10 DOM
-
2026-06-08days on market $90,000 Active 9 DOM
-
2026-06-07days on market $90,000 Active 8 DOM
-
2026-06-04days on market $90,000 Active 5 DOM
-
2026-06-02days on market $90,000 Active 4 DOM
-
2026-06-01days on market $90,000 Active 3 DOM
-
2026-05-31days on market $90,000 Active 2 DOM
-
2026-05-29$90,000 Active
ⓘ Source: listings_history table (triggers on properties + properties_extension) + one-shot
backfill from property_details.listing_events for pre-trigger history.
Tax reassessment forecast OK · Resets to sale price
- Current annual tax
- $271 · $23/mo
- Projected year-2 tax
- $675 · $56/mo
- Expected delta
- +$404/yr (+$34/mo · 149.1%)
ⓘ Screening estimate from a state-policy table — verify with the county assessor before closing.
Climate risk First Street
- Flood 1/10 Low FEMA zone X (unshaded) · 0% chance over 30 yrs
- Wildfire 6/10 Major
- Heat 6/10 Major 7 d/yr ≥112°F today · 22 d/yr by 30 yrs out
- Wind 4/10 Moderate 10% chance of damaging wind over 30 yrs
- Air quality 1/10 Low 0 unhealthy d/yr today · 0 by 30 yrs out
Nearby sold comps map
Loading sold comps map…
Walkable amenities ~0.75 mi
Loading nearby amenities…
Taxation est. · year 1
- Rental income
- $10,655
- − Mortgage interest
- −$4,201
- − Property taxes
- −$271
- − Insurance
- −$375
- − Repairs & maintenance
- −$852
- − Management
- −$852
- − Depreciation
- −$2,182
- Taxable income
- $1,921
- Est. tax owed @ 24.0%
- −$461
- After-tax cash flow
- $2,591/yr
For passive investors: Depreciation is non-cash, so a rental often shows a tax loss while cash-flowing — sheltering income. Rental losses are passive: they offset passive income freely, and up to $25,000/yr can offset ordinary (W-2) income if you actively participate and your MAGI is under $100k (phasing out to $0 by $150k); unused losses carry forward. On sale, claimed depreciation is recaptured at up to 25%, and gains may owe capital-gains tax (a 1031 exchange can defer both). Figures are a year-1 estimate at your 24.0% rate — not tax advice; consult a CPA.
Schools (NCES district)
- District
- Broken Bow
- NCES district ID
- 4005520
- Math proficiency
- 17% ▼ -8.00%
- Reading proficiency
- 20% ▼ -7.00%
- Median HH income
- $32,021
- Composite
- 14.94/100
- National rank
- #9367
- State rank
- #199 of 270 in OK
Livability — Broken Bow
- Score
- 67/100
- State rank
- #91
- US rank
- #10813
Category grades
Schools grade is shown separately in the Schools card above.
Census & demographics
- Census place
- Broken Bow, OK
- Population (ZIP)
- 11,177
Population outlook (McCurtain County) Hauer SSP2
- Today (2025)
- 32,668 people
- By 2030
- 32,323 · -1.1%
- By 2040
- 31,777 · -2.7%
- By 2050
- 31,436 · -3.8%
- By 2075
- 31,574 · -3.3%
- By 2100
- 30,839 · -5.6%
Race, ethnicity, and origin ACS 2023
- Neighborhood character
- Diverse neighborhood (Simpson 0.65)
- Race & ethnicity
- White 59% Native American 17% Two or more races 11% Hispanic / Latino 7% Black 6% Pacific Islander 3%
- Hispanic origin (detail)
- Mexican 7%
- Common ancestry
- Lithuanian 1% Serbian 1% Slovak 1%
- Foreign-born
- 4% · Canada
- Languages at home
- 92% English-only · Spanish 4% Other Asian/Pacific 3%
Political lean MEDSL · McCurtain
- 2024 margin
- Solid R (+68.9) · D 15.0% · R 83.9% · Other 1.1%
- 2008→2024 swing
- -21.9pp toward R · 2008: -47.0pp · 2024: -68.9pp
- All cycles
- 2024: R+68.9 2020: R+66.5 2016: R+63.9 2012: R+51.6 2008: R+47.0
Not yet ingested
- Civics
- —
Market trends
- HPI YoY
- ▲ 8.90%
- Current HPI
- 326.0544
- Rent YoY
- —
- Metro
- —
- State GDP YoY
- ▲ 1.55%
- F500 in state
- 6
Industry mix (Fortune 500 HQ in OK)
| Industry | F500 HQs | Revenue |
|---|---|---|
| Energy | 3 | $48B |
|
||
Price history
1 event — show timeline
- 2026-05-29 Listed $90,000 MLSOK
Property tax history
+3.5%/yrLatest (2025): $271 · +5.4% YoY. Source: county tax records.
Cash-flow waterfall
monthlySold comps — $/sqft
last 12 mo · ≤1 miLoading sold comps…