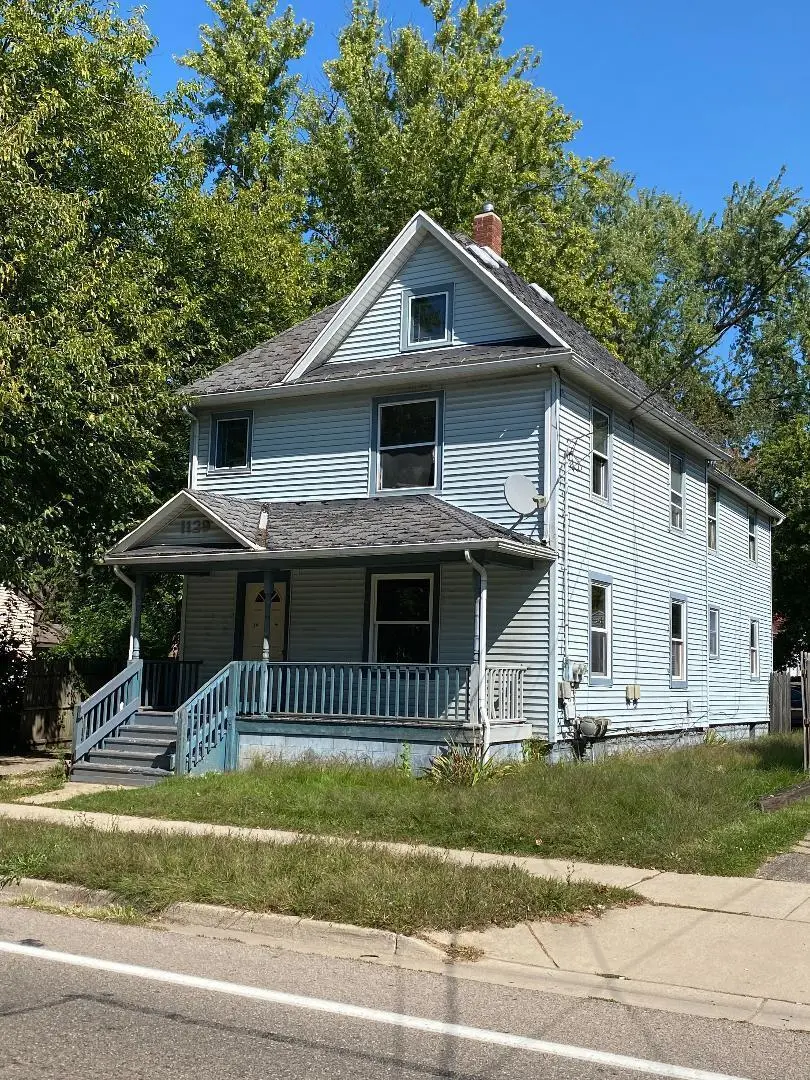
1129 Mills St · Kalamazoo, MI
Flood risk 1/10 · Minimal
- FEMA flood zone
- X (unshaded)
- Chance of flooding over 30 yrs
- 0.0%
- Est. flood insurance / yr
- $507 – $1,088
Fire risk 1/10 · Minimal
- Est. fire insurance / yr
- $784 – $1,456
Heat risk 3/10 · Minor
- Hot days now (above 100°F)
- 7 days/yr
- Hot days in 30 yrs
- 16 days/yr
Wind risk 2/10 · Minimal
- Chance of severe wind over 30 yrs
- —
Air-quality risk 2/10 · Minimal
- Unhealthy air days now
- 1 days/yr
- Unhealthy air days in 30 yrs
- 2 days/yr
Risk factors via First Street. Map © Google.
Why this score? — see what drove the A- grade
The composite is a weighted blend of 9 inputs, each scored 0–100. Each bar is that input's sub-score; the figure is the points it added to the 100-point composite (weight × sub-score).
- Cash flow +30.0/30.0
- ARV discount +15.0/15.0
- 1% rule +10.0/10.0
- DSCR +10.0/10.0
- Schools +4.7/10.0
- Rent growth +4.1/5.0
- Livability +3.8/5.0
- Condition / age +2.5/5.0
- Appreciation +0.0/10.0
$99,000
🖨 Deal sheet 📄 Offer letter ✓ Due diligence
Listing remarks MLS
Wonderful Upper and Lower Duplex offering two separate, Spacious 2 bedroom 1 bath units. Split utilities. Immediate occupancy. Ample off street parking. Directly on municipal bus route. Seller has relocated and is very motivated.
Key facts
- Municipal bus route
- Off street parking
- 6,534 sq ft lot
Tags
Neighborhood map
What this means for you Summary
Snapshot
- This is a 4-bed/2.0-bath single-family listed at $99k.
Deal economics
- At list price, monthly cash flow is $488 ($6k/yr) — positive.
- The deal already cash-flows at list — no discount required.
- Meets the 1% rule at list price ($2k rent vs $99k).
- Recommended offer: $90k (9.0% below list) — sets the bar for market timing.
- Cap rate 12.2% vs local median 4.1% in Kalamazoo — top-decile yield for the area; either an underpriced asset or a hidden risk that comps aren't pricing in. Stress-test before assuming the spread holds.
Location & tenants
- Location reads 76/100 on livability (#141 in MI, #3,492 nationally) — a middle-class / working-renter tenant base. Strengths: commute A+, cost of living A+, housing A+; Watch: crime F, employment D-.
- Kalamazoo Public Schools (urban): math 43% / reading 72% proficiency, ranked #71 of 540 in MI (top 13%) — acceptable for families but not a draw, mixed tenant base, ~2y average lease; 66% free/reduced lunch — lower-income household profile, screen leases tightly.
- Market conditions: Rents rising fast (+6.4%/yr); 109 active listings in the ZIP; 1 comparable units currently listed for rent nearby; 339 units permitted in Kalamazoo County in 2024 (22 in 5+ unit buildings).
- This rent runs 37% of the median local income ($56k/yr) — at the standard rent-burdened threshold; future hikes will face affordability resistance.
Forward outlook
- Local home prices are declining (-3.0%/yr); year-one equity from $684 of loan paydown is wiped out by about $3k of value loss. Plan a longer hold.
- Kalamazoo County population projected at +18% by 2050 — long-run rental-demand tailwind backs the buy-and-hold thesis.
- At projected returns (-3.0% appreciation + 6.4% rent growth), your $28k cash investment doubles in ~5 years — after that, you're playing with house money.
Negotiation context
- It's been on market 98 days — a 9% lower offer ($90k) is reasonable based on typical stale-listing flexibility.
- 15 sale attempts since 18y ago; this cycle's ask has dropped $25k (20%) from the opening price — seller is motivated, your offer sets the floor, not the list.
- Current owner paid $75k; 32% above their basis — modest negotiation headroom, anchor on the comps not their cost.
Risks & watch-outs
- Watch-outs: property tax is 4.0% of price; built in 1936 — expect roof / HVAC / electrical / plumbing capex.
Questions for the listing agent
- It's been on market 98 days. Have you received any prior offers? Is the seller open to a 9% concession, seller financing, or rate buy-down credit?
- Built in 1936 — when were the roof, HVAC, electrical panel, plumbing, and water heater last replaced?
- Property tax is high relative to price — has the assessment been appealed recently, and will the sale trigger a re-assessment?
- Why hasn't it sold? Are there any deal-killer items the seller is aware of (foundation, flood, title, zoning, code violations)?
- Is there a deadline driving the sale (1031 exchange, divorce, estate, relocation)? That informs how much negotiation room exists.
- Crime grade is F in this area — have there been break-ins, vandalism, or insurance claims at this property in the last 3 years? What carrier currently insures it and at what premium?
- What's the average days-on-market for RENTAL listings here right now (not sales)? A rising rental-DOM trend means longer vacancies and softer asking-rent achievability than the comps imply.
- What's the recent tenant-quality profile in this submarket — average credit score on applications, eviction rate, late-payment / NSF rate, and stable-employment percentage? A property-management company in the area should have these aggregated.
- How much new for-sale + rental construction is in the pipeline within 1–3 miles? Heavy new supply typically softens prices + rents 12–24 months out; constrained supply supports both.
Investment metrics
- 1% rule
- 1.76% ✓
- Cap rate
- 12.20%
- Cash-on-cash
- 21.10%
- DSCR
- 1.94
- GRM
- 4.7
CMA / ARV
- ARV (on-the-fly)
- $156,816
- Comps found
- 12
Show comp detail 12 sales within ~0.75 mi
| Address | Dist | Beds/Ba | Sqft | Sold | Price | $/sf | Match |
|---|---|---|---|---|---|---|---|
| 1002 Egleston Ave | 0.27mi | 3/2.0 (-1) | 1,978 (+2%) | 8mo | $130,000 | $66 | 73 |
| 1518 Fair St | 0.43mi | 4/1.5 | 1,922 (-1%) | 12mo | $200,000 | $104 | 67 |
| 1122 Egleston Ave | 0.26mi | 4/2.5 | 1,800 (-7%) | 9mo | $150,000 | $83 | 66 |
| 1109 Hays Park Ave | 0.35mi | 4/2.0 | 1,760 (-9%) | 7mo | $75,000 | $43 | 63 |
| 822 Lake St | 0.19mi | 5/1.5 (+1) | 1,690 (-13%) | 12mo | $140,000 | $83 | 52 |
| 1414 Portage St | 0.29mi | 3/2.0 (-1) | 1,774 (-8%) | 19mo | $70,000 | $39 | 52 |
| 920 Hays Park Ave | 0.38mi | 5/1.0 (+1) | 1,753 (-10%) | 11mo | $66,000 | $38 | 48 |
| 1326 Cameron St | 0.32mi | 5/2.0 (+1) | 2,146 (+11%) | 22mo | $145,000 | $68 | 44 |
| 827 Reed St | 0.43mi | 4/2.0 | 1,694 (-12%) | 22mo | $145,000 | $86 | 41 |
| 1612 Egleston Ave | 0.42mi | 3/1.5 (-1) | 1,715 (-11%) | 20mo | $160,000 | $93 | 38 |
| 822 Gibson St | 0.71mi | 4/2.0 | 1,806 (-7%) | 23mo | $147,000 | $81 | 36 |
| 826 Reed St | 0.46mi | 4/1.0 | 1,648 (-15%) | 20mo | $100,000 | $61 | 33 |
Match score weights: distance 35% · size 25% · config 20% · recency 20%. Top-matched comps best support the ARV.
Projected returns pro-forma
-3.0% appreciation · 6.41% rent growth · sell at horizon
- IRR
- 18.1%
- Equity multiple
- 1.77×
- Total profit
- $21,362
- Equity at exit
- $14,761
- IRR
- 29.2%
- Equity multiple
- 4.12×
- Total profit
- $86,500
- Equity at exit
- $8,560
Cash invested: $27,720 (down + closing). Projections, not guarantees.
Landlord ↔ Tenant lean methodology
- Overall (STATE)
- 62 Landlord-Friendly
- State Michigan
- 62 Landlord-Friendly · EVEN
- County
- — inherits STATE
- City
- — inherits STATE
ZIP-level market 49001
- Rents YoY
- 6.4%
- Active inventory
- 109
- Price-to-rent
- 4.7×
Monthly cashflow live
- Estimated rent
- $1,747 medium interval (Pro) →
- Mortgage (P&I)
- −$519
- Tax from tax record
- −$332 /mo · $3,988/yr
- Insurance
- −$41
- HOA
- −$0
- Vacancy / Maint / Mgmt
- −$367
- Net cashflow
- $488
Break-even live
UW: 25.0% down · 7.5% · 30yr · 1.5% tax · 5.0% vac · 8.0% maint · 8.0% mgmt
Financing live
Cash to close
- Down payment
- $24,750
- Closing costs
- $2,970
- Reserves months
- —
- Total cash needed
- —
Loan-product check · same deal, 3 products live
Conventional
25% down · 7.5% · 30yr
- Down + closing
- —
- Monthly P&I
- —
- Monthly cashflow
- —
- DSCR
- —
- Eligible?
- —
Personal DTI + credit; lowest rate.
DSCR
20% down · 8.5% · 30yr
- Down + closing
- —
- Monthly P&I
- —
- Monthly cashflow
- —
- DSCR
- —
- Eligible?
- —
No personal income docs; deal must DSCR.
Hard money
10% down · 12.0% · 12mo
- Down + closing
- —
- Monthly P&I
- —
- Monthly cashflow
- —
- DSCR
- —
- Eligible?
- —
Short-term bridge; refi at stabilization.
Rent comps 1 comps
| Address | Beds | Baths | Sqft | Rent | $/sqft | DOM | Units | Dist |
|---|---|---|---|---|---|---|---|---|
| 807 Central Park Cir Kalamazoo, MI | 1.0–3.0 | 1.0–2.0 | 1089 | $2,345 | $2.15 | 13d | 12 | 1.30mi |
Listing history 46 events
-
2025-12-23status Pending 229-char remark
Show marketing remark (229 chars)
Wonderful Upper and Lower Duplex offering two separate, Spacious 2 bedroom 1 bath units. Split utilities. Immediate occupancy. Ample off street parking. Directly on municipal bus route. Seller has relocated and is very motivated.
-
2025-12-23status Pending
Show marketing remark (229 chars)
Wonderful Upper and Lower Duplex offering two separate, Spacious 2 bedroom 1 bath units. Split utilities. Immediate occupancy. Ample off street parking. Directly on municipal bus route. Seller has relocated and is very motivated.
-
2025-11-25price $99,000 229-char remark
Show marketing remark (229 chars)
Wonderful Upper and Lower Duplex offering two separate, Spacious 2 bedroom 1 bath units. Split utilities. Immediate occupancy. Ample off street parking. Directly on municipal bus route. Seller has relocated and is very motivated.
-
2025-11-24price $99,000
-
2025-11-16price $109,000 229-char remark
Show marketing remark (229 chars)
Wonderful Upper and Lower Duplex offering two separate, Spacious 2 bedroom 1 bath units. Split utilities. Immediate occupancy. Ample off street parking. Directly on municipal bus route. Seller has relocated and is very motivated.
-
2025-11-15price $109,000
-
2025-10-30price $114,000 229-char remark
Show marketing remark (229 chars)
Wonderful Upper and Lower Duplex offering two separate, Spacious 2 bedroom 1 bath units. Split utilities. Immediate occupancy. Ample off street parking. Directly on municipal bus route. Seller has relocated and is very motivated.
-
2025-10-29price $114,000
-
2025-10-04price $119,000 229-char remark
Show marketing remark (229 chars)
Wonderful Upper and Lower Duplex offering two separate, Spacious 2 bedroom 1 bath units. Split utilities. Immediate occupancy. Ample off street parking. Directly on municipal bus route. Seller has relocated and is very motivated.
-
2025-10-03price $119,000
-
2025-09-16$124,000 Active
Show marketing remark (229 chars)
Wonderful Upper and Lower Duplex offering two separate, Spacious 2 bedroom 1 bath units. Split utilities. Immediate occupancy. Ample off street parking. Directly on municipal bus route. Seller has relocated and is very motivated.
-
2025-09-16$124,000 Active 229-char remark
Show marketing remark (229 chars)
Wonderful Upper and Lower Duplex offering two separate, Spacious 2 bedroom 1 bath units. Split utilities. Immediate occupancy. Ample off street parking. Directly on municipal bus route. Seller has relocated and is very motivated.
-
2024-10-30historical
-
2024-10-30historical
-
2024-09-06price $124,900
-
2024-09-05price $124,900
-
2024-09-05price $124,900
-
2024-07-25$135,000 Active
-
2024-07-25$135,000 Active
-
2021-04-30historical
-
2021-04-30historical
-
2021-01-06soldstatus $74,900
-
2020-11-07historical
-
2020-11-07status Pending
-
2020-10-17$84,900
-
2020-10-17$84,900
-
2020-10-17$84,900 Active
-
2017-03-06soldstatus $27,500
-
2017-03-06soldstatus $27,500 Sold
-
2017-01-12status Pending
-
2016-12-16$29,000 Active
-
2016-12-16$29,000
-
2016-12-15historical
-
2016-07-21historical
-
2016-07-21status Pending
-
2016-06-02$35,000 Active
-
2016-05-31$35,000
-
2015-07-31historical
-
2015-07-30historical
-
2014-10-22$35,000
-
2014-10-22$35,000
-
2009-05-11soldstatus $20,000
-
2009-03-11$19,900
-
2008-12-16historical
-
2008-01-30$49,900
-
2005-10-03soldstatus $85,000
ⓘ Source: listings_history table (triggers on properties + properties_extension) + one-shot
backfill from property_details.listing_events for pre-trigger history.
Tax reassessment forecast MI · Partial reset (capped growth)
- Current annual tax
- $3,988 · $332/mo
- Projected year-2 tax
- $3,988 · $332/mo
- Expected delta
- $0/yr ($0/mo · 0.0%)
ⓘ Screening estimate from a state-policy table — verify with the county assessor before closing.
Climate risk First Street
- Flood 1/10 Low FEMA zone X (unshaded) · 0% chance over 30 yrs
- Wildfire 1/10 Low
- Heat 3/10 Moderate 7 d/yr ≥100°F today · 16 d/yr by 30 yrs out
- Wind 2/10 Low
- Air quality 2/10 Low 1 unhealthy d/yr today · 2 by 30 yrs out
Nearby sold comps map
Loading sold comps map…
Walkable amenities ~0.75 mi
Loading nearby amenities…
Taxation est. · year 1
- Rental income
- $20,966
- − Mortgage interest
- −$5,546
- − Property taxes
- −$3,988
- − Insurance
- −$495
- − Repairs & maintenance
- −$1,677
- − Management
- −$1,677
- − Depreciation
- −$2,880
- Taxable income
- $4,703
- Est. tax owed @ 24.0%
- −$1,129
- After-tax cash flow
- $4,721/yr
For passive investors: Depreciation is non-cash, so a rental often shows a tax loss while cash-flowing — sheltering income. Rental losses are passive: they offset passive income freely, and up to $25,000/yr can offset ordinary (W-2) income if you actively participate and your MAGI is under $100k (phasing out to $0 by $150k); unused losses carry forward. On sale, claimed depreciation is recaptured at up to 25%, and gains may owe capital-gains tax (a 1031 exchange can defer both). Figures are a year-1 estimate at your 24.0% rate — not tax advice; consult a CPA.
Schools (NCES district)
- District
- Kalamazoo Public Schools
- NCES district ID
- 2619950
- Math proficiency
- 43% ▲ 13.00%
- Reading proficiency
- 72% ▲ 33.00%
- Median HH income
- $35,291
- Composite
- 47.48/100
- National rank
- #2275
- State rank
- #71 of 540 in MI
Livability — Kalamazoo
- Score
- 76/100
- State rank
- #141
- US rank
- #3492
Category grades
Schools grade is shown separately in the Schools card above.
Census & demographics
- Census place
- Kalamazoo, MI
- County
- Kalamazoo County · 224,317 people
- City population
- 121,397
- Metro
- Kalamazoo-Portage, MI
- Population (ZIP)
- 20,946
- Household income
- $56,432
- Rent vs Own
- Severe rent burden
- 1184.0
Population outlook (Kalamazoo County) Hauer SSP2
- Today (2025)
- 280,982 people
- By 2030
- 292,068 · +3.9%
- By 2040
- 312,191 · +11.1%
- By 2050
- 331,196 · +17.9%
- By 2075
- 379,021 · +34.9%
- By 2100
- 396,579 · +41.1%
Race, ethnicity, and origin ACS 2023
- Neighborhood character
- Diverse neighborhood (Simpson 0.59)
- Race & ethnicity
- White 58% Black 22% Hispanic / Latino 15% Two or more races 5% Asian 2% Native American 1%
- Hispanic origin (detail)
- Mexican 13%
- Common ancestry
- Romanian 6% Iranian 4% Slovak 3%
- Foreign-born
- 9% · Canada
- Languages at home
- 84% English-only · Spanish 11% Arabic 2% Other Indo-European 1%
Political lean MEDSL · Kalamazoo
- 2024 margin
- D (+17.7) · D 58.0% · R 40.3% · Other 1.7%
- 2008→2024 swing
- -1.8pp toward R · 2008: 19.5pp · 2024: 17.7pp
- All cycles
- 2024: D+17.7 2020: D+18.7 2016: D+12.8 2012: D+13.3 2008: D+19.5
Not yet ingested
- Civics
- —
Market trends
- HPI YoY
- ▼ -264.90%
- Current HPI
- 206.9355
- Rent YoY
- ▲ 6.41%
- Metro
- Kalamazoo-Portage, MI
- State GDP YoY
- ▲ 1.37%
- F500 in state
- 28
Industry mix (Fortune 500 HQ in MI)
| Industry | F500 HQs | Revenue |
|---|---|---|
| Automotive Parts | 3 | $48B |
|
||
| Automotive | 2 | $372B |
|
||
| Chemicals | 1 | $45B |
|
||
| Automotive Retail | 1 | $29B |
|
||
| Healthcare / Medical Devices | 1 | $23B |
|
||
| Automotive Technology | 1 | $20B |
|
||
Price history
+16.5% since first listed46 events — show timeline
- 2025-12-23 Pending — MiRealSource-MiMLS
- 2025-12-23 Pending — REALCOMP
- 2025-11-25 Price Changed $99,000 MiRealSource-MiMLS
- 2025-11-24 Price Changed $99,000 REALCOMP
- 2025-11-16 Price Changed $109,000 MiRealSource-MiMLS
- 2025-11-15 Price Changed $109,000 REALCOMP
- 2025-10-30 Price Changed $114,000 MiRealSource-MiMLS
- 2025-10-29 Price Changed $114,000 REALCOMP
- 2025-10-04 Price Changed $119,000 MiRealSource-MiMLS
- 2025-10-03 Price Changed $119,000 REALCOMP
- 2025-09-16 Listed $124,000 REALCOMP
- 2025-09-16 Listed $124,000 MiRealSource-MiMLS
- 2024-10-30 Listing Removed — MiRealSource-MiMLS
- 2024-10-30 Listing Removed — REALCOMP
- 2024-09-06 Price Changed $124,900 MiRealSource-MiMLS
- 2024-09-05 Price Changed $124,900 REALCOMP
- 2024-09-05 Price Changed $124,900 SW Michigan MLS
- 2024-07-25 Listed $135,000 MiRealSource-MiMLS
- 2024-07-25 Listed $135,000 REALCOMP
- 2021-04-30 Listing Removed — MiRealSource-MiMLS
- 2021-04-30 Listing Removed — REALCOMP
- 2021-01-06 Sold (Public Records) $74,900 Public Records
- 2020-11-07 Listing Removed — SW Michigan MLS
- 2020-11-07 Pending — SW Michigan MLS
- 2020-10-17 Listed $84,900 SW Michigan MLS
- 2020-10-17 Listed $84,900 MiRealSource-MiMLS
- 2020-10-17 Listed $84,900 REALCOMP
- 2017-03-06 Sold (MLS) $27,500 SW Michigan MLS
- 2017-03-06 Sold (MLS) $27,500 REALCOMP
- 2017-01-12 Pending — SW Michigan MLS
- 2016-12-16 Listed $29,000 SW Michigan MLS
- 2016-12-16 Listed $29,000 REALCOMP
- 2016-12-15 Listing Removed — REALCOMP
- 2016-07-21 Listing Removed — SW Michigan MLS
- 2016-07-21 Pending — SW Michigan MLS
- 2016-06-02 Listed $35,000 SW Michigan MLS
- 2016-05-31 Listed $35,000 REALCOMP
- 2015-07-31 Listing Removed — SW Michigan MLS
- 2015-07-30 Listing Removed — REALCOMP
- 2014-10-22 Listed $35,000 SW Michigan MLS
- 2014-10-22 Listed $35,000 REALCOMP
- 2009-05-11 Sold (MLS) $20,000 SW Michigan MLS
- 2009-03-11 Listed $19,900 SW Michigan MLS
- 2008-12-16 Listing Removed — SW Michigan MLS
- 2008-01-30 Listed $49,900 SW Michigan MLS
- 2005-10-03 Sold (Public Records) $85,000 Public Records
Property tax history
+10.5%/yrLatest (2025): $3,988 · +25.0% YoY. Source: county tax records.
Cash-flow waterfall
monthlySold comps — $/sqft
last 12 mo · ≤1 miLoading sold comps…