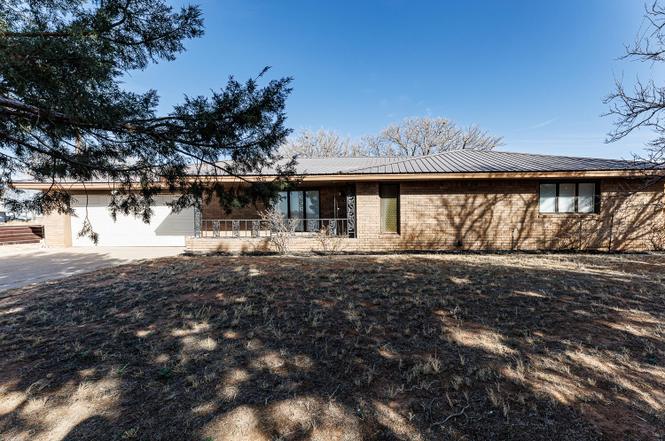
716 Bulldog Dr · Amherst, TX
Flood risk 1/10 · Minimal
- FEMA flood zone
- —
- Chance of flooding over 30 yrs
- 0.0%
- Est. flood insurance / yr
- —
Fire risk 2/10 · Minimal
- Est. fire insurance / yr
- $1,222 – $2,270
Heat risk 5/10 · Moderate
- Hot days now (above 98°F)
- 7 days/yr
- Hot days in 30 yrs
- 20 days/yr
Wind risk 2/10 · Minimal
- Chance of severe wind over 30 yrs
- 2.0%
Air-quality risk 1/10 · Minimal
- Unhealthy air days now
- 0 days/yr
- Unhealthy air days in 30 yrs
- 0 days/yr
Risk factors via First Street. Map © Google.
Why this score? — see what drove the B+ grade
The composite is a weighted blend of 9 inputs, each scored 0–100. Each bar is that input's sub-score; the figure is the points it added to the 100-point composite (weight × sub-score).
- Cash flow +30.0/30.0
- DSCR +10.0/10.0
- 1% rule +9.2/10.0
- ARV discount +7.5/15.0
- Appreciation +7.3/10.0
- Livability +3.2/5.0
- Schools +2.8/10.0
- Rent growth +2.5/5.0
- Condition / age +2.5/5.0
$145,000
🖨 Deal sheet 📄 Offer letter ✓ Due diligence
Listing remarks MLS
Nice 2/2/2 open concept brick home with basement, covered patio, shop and carport. Basically one owner home. Corner lot with additional full lot east of home. Plenty of room for additional home. Nice metal roof. Small town, country living at its best.
Key facts
- Chicken coops
- Peach trees
- Extra getaway
Tags
Neighborhood map
What this means for you Summary
Snapshot
- This is a 2-bed/2.0-bath single-family listed at $145k.
Deal economics
- At list price, monthly cash flow is $548 ($7k/yr) — positive.
- The deal already cash-flows at list — no discount required.
- Meets the 1% rule at list price ($2k rent vs $145k).
- Recommended offer: $143k (1.5% below list) — sets the bar for market timing.
Location & tenants
- Location reads 64/100 on livability (#767 in TX) — a middle-class / working-renter tenant base. Strengths: cost of living A+, housing A+, crime B+; Watch: health & safety C-, employment D, schools F.
- Amherst ISD (rural): math 30% / reading 30% proficiency, ranked #1,012 of 1,141 in TX (top 89%) — families likely to look elsewhere, expect single-tenant / working-renter base with shorter leases; 80% free/reduced lunch — lower-income household profile, screen leases tightly.
- Market conditions: 2 active listings in the ZIP.
Forward outlook
- In year one you build about $8k of equity ($1k loan paydown + $7k appreciation (4.6% local appreciation)).
- Lamb County population projected at -20% by 2050 — secular population decline; favor cash flow + early exit over multi-decade hold.
- At projected returns (4.6% appreciation + 3.0% rent growth), your $41k cash investment doubles in ~3 years — after that, you're playing with house money.
- By year 5, paydown + projected appreciation supports a ~$33k cash-out refi (75% LTV) — recoverable capital for the next deal without selling this one.
Negotiation context
- It's been on market 15 days — a 2% lower offer ($143k) is reasonable based on typical stale-listing flexibility.
- 2 sale attempts since 6y ago with the ask held roughly flat each time — persistent listings suggest the price (not the market) is what's stuck; bring a comps-based counter.
Risks & watch-outs
- Climate carrying-cost: extreme-heat days projected 7→20/yr by 2055 (HVAC capex compounding) — expect insurance premiums to compound above CPI over the hold.
Questions for the listing agent
- Built in 1972 — when were the roof, HVAC, electrical panel, plumbing, and water heater last replaced?
- Is there a deadline driving the sale (1031 exchange, divorce, estate, relocation)? That informs how much negotiation room exists.
- Schools are F-rated, which usually means shorter tenancies and higher turnover. Who's the typical renter profile here, and what's been the actual vacancy rate?
- What's the average days-on-market for RENTAL listings here right now (not sales)? A rising rental-DOM trend means longer vacancies and softer asking-rent achievability than the comps imply.
- What's the recent tenant-quality profile in this submarket — average credit score on applications, eviction rate, late-payment / NSF rate, and stable-employment percentage? A property-management company in the area should have these aggregated.
- How much new for-sale + rental construction is in the pipeline within 1–3 miles? Heavy new supply typically softens prices + rents 12–24 months out; constrained supply supports both.
Investment metrics
- 1% rule
- 1.42% ✓
- Cap rate
- 10.83%
- Cash-on-cash
- 16.20%
- DSCR
- 1.72
- GRM
- 5.9
CMA / ARV
No comps found within radius.
Projected returns pro-forma
4.56% appreciation · 3.0% rent growth · sell at horizon
- IRR
- 26.0%
- Equity multiple
- 2.60×
- Total profit
- $64,824
- Equity at exit
- $78,359
- IRR
- 25.4%
- Equity multiple
- 5.13×
- Total profit
- $167,744
- Equity at exit
- $132,187
Cash invested: $40,600 (down + closing). Projections, not guarantees.
Landlord ↔ Tenant lean methodology
- Overall (STATE)
- 87 Strongly Landlord-Friendly
- State Texas
- 87 Strongly Landlord-Friendly · R+5
- County
- — inherits STATE
- City
- — inherits STATE
ZIP-level market 79312
- Home prices YoY
- 5.4%
- Active inventory
- 2
- Price-to-rent
- 5.9×
Monthly cashflow live
- Estimated rent
- $2,060 medium interval (Pro) →
- Mortgage (P&I)
- −$760
- Tax from tax record
- −$259 /mo · $3,103/yr
- Insurance
- −$60
- HOA
- −$0
- Vacancy / Maint / Mgmt
- −$433
- Net cashflow
- $548
Break-even live
UW: 25.0% down · 7.5% · 30yr · 1.5% tax · 5.0% vac · 8.0% maint · 8.0% mgmt
Financing live
Cash to close
- Down payment
- $36,250
- Closing costs
- $4,350
- Reserves months
- —
- Total cash needed
- —
Loan-product check · same deal, 3 products live
Conventional
25% down · 7.5% · 30yr
- Down + closing
- —
- Monthly P&I
- —
- Monthly cashflow
- —
- DSCR
- —
- Eligible?
- —
Personal DTI + credit; lowest rate.
DSCR
20% down · 8.5% · 30yr
- Down + closing
- —
- Monthly P&I
- —
- Monthly cashflow
- —
- DSCR
- —
- Eligible?
- —
No personal income docs; deal must DSCR.
Hard money
10% down · 12.0% · 12mo
- Down + closing
- —
- Monthly P&I
- —
- Monthly cashflow
- —
- DSCR
- —
- Eligible?
- —
Short-term bridge; refi at stabilization.
Listing history 5 events
-
2026-03-03status Pending
-
2026-02-17$145,000 Active
-
2020-09-18soldstatus 251-char remark
Show marketing remark (251 chars)
Nice 2/2/2 open concept brick home with basement, covered patio, shop and carport. Basically one owner home. Corner lot with additional full lot east of home. Plenty of room for additional home. Nice metal roof. Small town, country living at its best.
-
2020-07-13$85,000 251-char remark
Show marketing remark (251 chars)
Nice 2/2/2 open concept brick home with basement, covered patio, shop and carport. Basically one owner home. Corner lot with additional full lot east of home. Plenty of room for additional home. Nice metal roof. Small town, country living at its best.
-
1992-05-13soldstatus
ⓘ Source: listings_history table (triggers on properties + properties_extension) + one-shot
backfill from property_details.listing_events for pre-trigger history.
Tax reassessment forecast TX · Resets to sale price
- Current annual tax
- $3,103 · $259/mo
- Projected year-2 tax
- $3,103 · $259/mo
- Expected delta
- $0/yr ($0/mo · 0.0%)
ⓘ Screening estimate from a state-policy table — verify with the county assessor before closing.
Climate risk First Street
- Flood 1/10 Low 0% chance over 30 yrs
- Wildfire 2/10 Low
- Heat 5/10 Major 7 d/yr ≥98°F today · 20 d/yr by 30 yrs out
- Wind 2/10 Low 2% chance of damaging wind over 30 yrs
- Air quality 1/10 Low 0 unhealthy d/yr today · 0 by 30 yrs out
Nearby sold comps map
Loading sold comps map…
Walkable amenities ~0.75 mi
Loading nearby amenities…
Taxation est. · year 1
- Rental income
- $24,721
- − Mortgage interest
- −$8,122
- − Property taxes
- −$3,103
- − Insurance
- −$725
- − Repairs & maintenance
- −$1,978
- − Management
- −$1,978
- − Depreciation
- −$4,218
- Taxable income
- $4,597
- Est. tax owed @ 24.0%
- −$1,103
- After-tax cash flow
- $5,474/yr
For passive investors: Depreciation is non-cash, so a rental often shows a tax loss while cash-flowing — sheltering income. Rental losses are passive: they offset passive income freely, and up to $25,000/yr can offset ordinary (W-2) income if you actively participate and your MAGI is under $100k (phasing out to $0 by $150k); unused losses carry forward. On sale, claimed depreciation is recaptured at up to 25%, and gains may owe capital-gains tax (a 1031 exchange can defer both). Figures are a year-1 estimate at your 24.0% rate — not tax advice; consult a CPA.
Schools (NCES district)
- District
- Amherst ISD
- NCES district ID
- 4808160
- Math proficiency
- 30% ▲ 10.00%
- Reading proficiency
- 30% ▲ 5.00%
- Median HH income
- $42,533
- Composite
- 28.32/100
- National rank
- #12146
- State rank
- #1012 of 1141 in TX
Livability — Amherst
- Score
- 64/100
- State rank
- #767
- US rank
- #14007
Category grades
Schools grade is shown separately in the Schools card above.
Census & demographics
- Population (ZIP)
- 1,114
Population outlook (Lamb County) Hauer SSP2
- Today (2025)
- 12,357 people
- By 2030
- 11,878 · -3.9%
- By 2040
- 10,950 · -11.4%
- By 2050
- 9,929 · -19.6%
- By 2075
- 7,355 · -40.5%
- By 2100
- 4,603 · -62.7%
Race, ethnicity, and origin ACS 2023
- Neighborhood character
- Majority Hispanic (64%)
- Race & ethnicity
- Hispanic / Latino 64% White 26% Two or more races 12% Asian 8%
- Hispanic origin (detail)
- Mexican 63%
- Common ancestry
- Serbian 1% Slovak 1% Slovene 1%
- Foreign-born
- 35% · Canada
- Languages at home
- 36% English-only · Spanish 56% Other Indo-European 8%
Political lean MEDSL · Lamb
- 2024 margin
- Solid R (+64.3) · D 17.6% · R 81.9%
- 2008→2024 swing
- -15.9pp toward R · 2008: -48.4pp · 2024: -64.3pp
- All cycles
- 2024: R+64.3 2020: R+60.8 2016: R+58.1 2012: R+50.3 2008: R+48.4
Not yet ingested
- Civics
- —
Market trends
- HPI YoY
- ▲ 4.56%
- Current HPI
- 88.6914
- Rent YoY
- —
- Metro
- —
- State GDP YoY
- ▲ 3.95%
- F500 in state
- 110
Industry mix (Fortune 500 HQ in TX)
| Industry | F500 HQs | Revenue |
|---|---|---|
| Energy | 16 | $1,198B |
|
||
| Technology | 5 | $198B |
|
||
| Engineering / Construction | 4 | $72B |
|
||
| Energy Services | 3 | $60B |
|
||
| Utilities | 3 | $41B |
|
||
| Healthcare | 2 | $330B |
|
||
Price history
+70.6% since first listed5 events — show timeline
- 2026-03-03 Pending — LARMLS
- 2026-02-17 Listed $145,000 LARMLS
- 2020-09-18 Sold (MLS) — LARMLS
- 2020-07-13 Listed $85,000 LARMLS
- 1992-05-13 Sold (Public Records) — Public Records
Property tax history
+4.7%/yrLatest (2025): $3,103 · +7.1% YoY. Source: county tax records.
Cash-flow waterfall
monthlySold comps — $/sqft
last 12 mo · ≤1 miLoading sold comps…