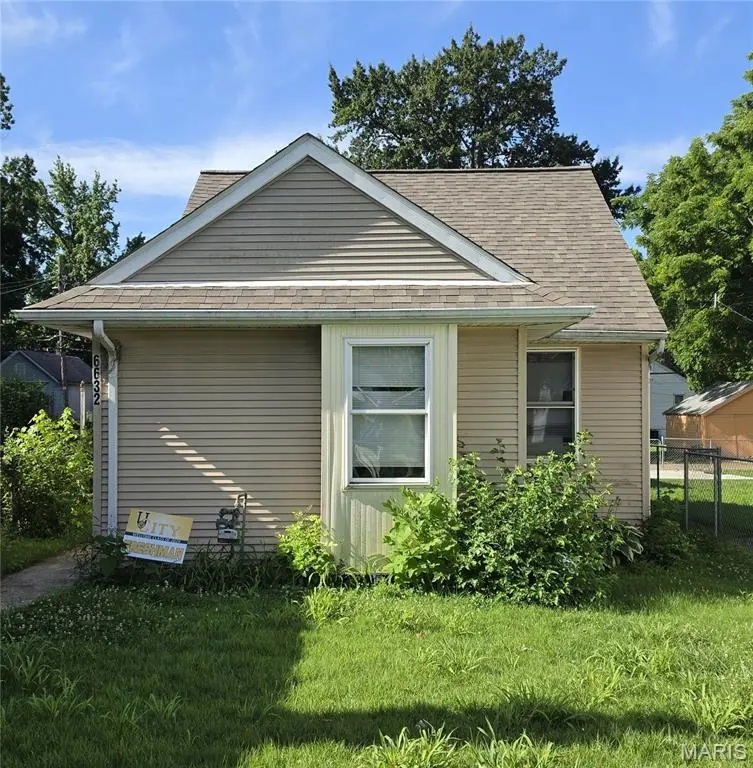
6632 Etzel Ave · University City, MO
Flood risk 6/10 · Moderate
- FEMA flood zone
- X (shaded)
- Chance of flooding over 30 yrs
- 0.69%
- Est. flood insurance / yr
- $473 – $860
Fire risk 1/10 · Minimal
- Est. fire insurance / yr
- $1,054 – $1,958
Heat risk 5/10 · Moderate
- Hot days now (above 107°F)
- 7 days/yr
- Hot days in 30 yrs
- 21 days/yr
Wind risk 2/10 · Minimal
- Chance of severe wind over 30 yrs
- 1.0%
Air-quality risk 4/10 · Minor
- Unhealthy air days now
- 4 days/yr
- Unhealthy air days in 30 yrs
- 5 days/yr
Risk factors via First Street. Map © Google.
Why this score? — see what drove the B- grade
The composite is a weighted blend of 9 inputs, each scored 0–100. Each bar is that input's sub-score; the figure is the points it added to the 100-point composite (weight × sub-score).
- Cash flow +30.0/30.0
- 1% rule +10.0/10.0
- DSCR +10.0/10.0
- ARV discount +7.5/15.0
- Livability +3.7/5.0
- Rent growth +3.4/5.0
- Condition / age +2.5/5.0
- Schools +1.9/10.0
- Appreciation +0.0/10.0
$90,000
🖨 Deal sheet 📄 Offer letter ✓ Due diligence
Listing remarks
SOLD AS IS - Great opportunity in a prime University City location. 3 bed, 2 full bath ranch home with large lot and full basement that could be finished to add additional living space. Great rental opportunity for investors or owner occupied buyers looking to do some updating. Wood flooring, large kitchen area, patio and good sized rooms.
Key facts
- Wood flooring
- Large kitchen area
- Large lot
Tags
Property features AI
Finance
- Other: Private ownership
- Financial info: Lease not considered
Exterior
- Utilities: Public water; Public sewer; Electric service by Ameren; Electricity connected; Natural gas connected
- Home design: Single family residence; One level
- Construction: Vinyl siding; Basement with 8 ft+ poured construction
- Exterior features: Level lot
Interior
- Bedrooms: 3 bedrooms (all on the main level)
- Bathrooms: 2 full bathrooms (both on the main level)
- Heating & cooling: Forced air heating; Central air; Ceiling fans
- Interior features: Forced air heating; Ceiling fans; Central air
Neighborhood map
What this means for you Summary
Snapshot
- This is a 3-bed/2.0-bath single-family listed at $90k.
Deal economics
- At list price, monthly cash flow is $707 ($8k/yr) — positive.
- The deal already cash-flows at list — no discount required.
- Meets the 1% rule at list price ($2k rent vs $90k).
- Cap rate 15.7% vs local median 4.9% in University City — top-decile yield for the area; either an underpriced asset or a hidden risk that comps aren't pricing in. Stress-test before assuming the spread holds.
Location & tenants
- Location reads 73/100 on livability (#84 in MO) — a middle-class / working-renter tenant base. Strengths: employment A+, housing A+, cost of living B; Watch: amenities D-, commute D-, health & safety F.
- University City (suburban): math 15% / reading 26% proficiency, ranked #297 of 324 in MO (top 92%) — low school quality limits family demand, transient renter base, plan for 1-2y turnover; 67% free/reduced lunch — lower-income household profile, screen leases tightly.
- Zoned schools: Pershing Elem. (math 8% / reading 12%, grade F, #1,037 of 1,115 statewide, top 94%, 265 students, 100% FRL); University City Sr. High (math 5% / reading 52%, grade F, #409 of 521 statewide, top 79%, 726 students, 100% FRL) — zoned schools average 100% FRL vs 67% district-wide (32 pts higher); higher-poverty schools than district average — tighter screening recommended.
- Market conditions: Rents rising (+3.6%/yr); 162 active listings in the ZIP; 40 comparable units currently listed for rent nearby; rentals at typical pace (median 24d on market — plan ~3-4 weeks tenant-placement turnaround); 40% of comp listings sitting > 30 days — soft ceiling on asking rent; solid renter incomes; 920 units permitted in St. Louis County in 2024 (250 in 5+ unit buildings).
Forward outlook
- Local home prices are declining (-3.0%/yr); year-one equity from $622 of loan paydown is wiped out by about $3k of value loss. Plan a longer hold.
- At projected returns (-3.0% appreciation + 3.6% rent growth), your $25k cash investment doubles in ~4 years — after that, you're playing with house money.
Negotiation context
- Only 1 days on market — expect competitive offers; lowballing is unlikely to land.
Risks & watch-outs
- Watch-outs: built in 1906 — expect roof / HVAC / electrical / plumbing capex.
- Climate carrying-cost: major flood risk; extreme-heat days projected 7→21/yr by 2055 (HVAC capex compounding) — expect insurance premiums to compound above CPI over the hold.
Questions for the listing agent
- Built in 1906 — when were the roof, HVAC, electrical panel, plumbing, and water heater last replaced?
- Is there a deadline driving the sale (1031 exchange, divorce, estate, relocation)? That informs how much negotiation room exists.
- Schools are B-rated — typically a magnet for longer-tenancy family renters. What's the average tenant stay here, and is there a school-zone premium baked into asking?
- What's the average days-on-market for RENTAL listings here right now (not sales)? A rising rental-DOM trend means longer vacancies and softer asking-rent achievability than the comps imply.
- What's the recent tenant-quality profile in this submarket — average credit score on applications, eviction rate, late-payment / NSF rate, and stable-employment percentage? A property-management company in the area should have these aggregated.
- How much new for-sale + rental construction is in the pipeline within 1–3 miles? Heavy new supply typically softens prices + rents 12–24 months out; constrained supply supports both.
Investment metrics
- 1% rule
- 1.87% ✓
- Cap rate
- 15.72%
- Cash-on-cash
- 33.65%
- DSCR
- 2.50
- GRM
- 4.5
CMA / ARV
- ARV (on-the-fly)
- $180,380
- Comps found
- 12
Show comp detail 12 sales within ~0.75 mi
| Address | Dist | Beds/Ba | Sqft | Sold | Price | $/sf | Match |
|---|---|---|---|---|---|---|---|
| 6721 Chamberlain Ave | 0.19mi | 3/1.0 | 1,242 (-0%) | 7mo | $190,000 | $153 | 81 |
| 6810 Bartmer Ave | 0.29mi | 3/1.0 | 1,310 (+5%) | 8mo | $189,900 | $145 | 67 |
| 6959 Dartmouth Ave | 0.49mi | 3/2.0 | 1,331 (+7%) | 2mo | $294,000 | $221 | 64 |
| 6624 Bartmer Ave | 0.15mi | 2/1.0 (-1) | 1,125 (-10%) | 6mo | $119,900 | $107 | 63 |
| 7048 Arcadia Ave | 0.65mi | 3/1.0 | 1,232 (-1%) | 3mo | $219,000 | $178 | 61 |
| 6821 Primrose Ave | 0.53mi | 3/1.0 | 1,344 (+8%) | 2mo | $48,500 | $36 | 56 |
| 6534 Whitney Ave | 0.40mi | 2/1.0 (-1) | 1,126 (-10%) | 0mo | $65,000 | $58 | 56 |
| 6934 Julian Ave | 0.51mi | 2/1.0 (-1) | 1,158 (-7%) | 1mo | $130,000 | $112 | 55 |
| 6816 Julian Ave | 0.34mi | 2/2.0 (-1) | 1,080 (-13%) | 9mo | $200,000 | $185 | 50 |
| 7039 Plymouth Ave | 0.65mi | 4/1.5 (+1) | 1,152 (-7%) | 1mo | $126,500 | $110 | 50 |
| 6821 Raymond Ave | 0.44mi | 2/1.0 (-1) | 1,064 (-14%) | 7mo | $54,000 | $51 | 40 |
| 1163 Partridge Ave | 0.75mi | 2/1.5 (-1) | 1,080 (-13%) | 7mo | $184,900 | $171 | 30 |
Match score weights: distance 35% · size 25% · config 20% · recency 20%. Top-matched comps best support the ARV.
Projected returns pro-forma
-3.0% appreciation · 3.61% rent growth · sell at horizon
- IRR
- 29.6%
- Equity multiple
- 2.25×
- Total profit
- $31,490
- Equity at exit
- $13,419
- IRR
- 37.3%
- Equity multiple
- 4.56×
- Total profit
- $89,795
- Equity at exit
- $7,782
Cash invested: $25,200 (down + closing). Projections, not guarantees.
Landlord ↔ Tenant lean methodology
- Overall (STATE)
- 81 Strongly Landlord-Friendly
- State Missouri
- 81 Strongly Landlord-Friendly · R+10
- County
- — inherits STATE
- City
- — inherits STATE
ZIP-level market 63130
- Rents YoY
- 3.6%
- Active inventory
- 162
- Price-to-rent
- 4.5×
Monthly cashflow live
- Estimated rent
- $1,682 high interval (Pro) →
- Mortgage (P&I)
- −$472
- Tax est. 1.5%
- −$112 /mo · $1,350/yr
- Insurance
- −$38
- HOA
- −$0
- Vacancy / Maint / Mgmt
- −$353
- Net cashflow
- $707
Break-even live
UW: 25.0% down · 7.5% · 30yr · 1.5% tax · 5.0% vac · 8.0% maint · 8.0% mgmt
Financing live
Cash to close
- Down payment
- $22,500
- Closing costs
- $2,700
- Reserves months
- —
- Total cash needed
- —
Loan-product check · same deal, 3 products live
Conventional
25% down · 7.5% · 30yr
- Down + closing
- —
- Monthly P&I
- —
- Monthly cashflow
- —
- DSCR
- —
- Eligible?
- —
Personal DTI + credit; lowest rate.
DSCR
20% down · 8.5% · 30yr
- Down + closing
- —
- Monthly P&I
- —
- Monthly cashflow
- —
- DSCR
- —
- Eligible?
- —
No personal income docs; deal must DSCR.
Hard money
10% down · 12.0% · 12mo
- Down + closing
- —
- Monthly P&I
- —
- Monthly cashflow
- —
- DSCR
- —
- Eligible?
- —
Short-term bridge; refi at stabilization.
Rent comps 40 comps
| Address | Beds | Baths | Sqft | Rent | $/sqft | DOM | Units | Dist |
|---|---|---|---|---|---|---|---|---|
| 6636 Etzel Ave Saint Louis, MO | 3.0 | 2.0 | 1019 | $1,350 | $1.32 | 19d | 1 | 0.02mi |
| 6636 Etzel Ave Saint Louis, MO | 3.0 | 1.5 | 1019 | $1,350 | $1.32 | 7d | 1 | 0.02mi |
| 6704 Etzel Ave Saint Louis, MO | 2.0 | 1.0 | 825 | $1,325 | $1.61 | 43d | 1 | 0.06mi |
| 6543 Etzel Ave Saint Louis, MO | 3.0 | 1.0 | 967 | $1,600 | $1.65 | 17d | 1 | 0.08mi |
| 6614 Chamberlain Ave Saint Louis, MO | 3.0 | 2.0 | 1000 | $1,820 | $1.82 | 23d | 1 | 0.24mi |
| 6827 Melrose Ave Saint Louis, MO | 2.0 | 1.0 | 1200 | $1,300 | $1.08 | 7d | 1 | 0.40mi |
| 6913 Etzel Ave Unit 1496954P University City, MO | 3.0 | 2.0 | 1399 | $5,767 | $4.12 | 7d | 1 | 0.43mi |
| 6318 Cabanne Ave Apt 1w University City, MO | 2.0 | 1.0 | 950 | $1,250 | $1.32 | 4d | 1 | 0.50mi |
| 6936 Melrose Ave Saint Louis, MO | 4.0 | 2.0 | 1396 | $1,858 | $1.33 | 23d | 1 | 0.52mi |
| 6312 Cates Ave Unit 2E University City, MO | 2.0 | 1.0 | 900 | $1,300 | $1.44 | 43d | 1 | 0.57mi |
| 908 Eastgate Ave Unit 2N University City, MO | 2.0 | 1.0 | 900 | $1,300 | $1.44 | 4d | 1 | 0.59mi |
| 900 Eastgate Ave Saint Louis, MO | 2.0 | 1.0 | 900 | $1,095 | $1.22 | 43d | 1 | 0.60mi |
| 7034 Corbitt Ave Saint Louis, MO | 2.0 | 2.0 | 870 | $1,450 | $1.67 | 23d | 1 | 0.62mi |
| 6274 Cates Ave Saint Louis, MO | 3.0 | 2.0 | 1400 | $2,295 | $1.64 | 43d | 1 | 0.64mi |
| 1019 N Skinker Pkwy St. Louis, MO | 1.0–3.0 | 1.0–3.0 | 1137 | $2,795 | $2.46 | 1d | 9 | 0.66mi |
| 716 Westgate Ave Unit 3 University City, MO | 3.0 | 2.0 | 1500 | $2,995 | $2.00 | 43d | 1 | 0.66mi |
| 6261 Clemens Ave Saint Louis, MO | 3.0 | 1.0 | 1200 | $1,700 | $1.42 | 43d | 1 | 0.67mi |
| 1131 Hodiamont Ave Unit 1135-2D St. Louis, MO | 3.0 | 1.0 | 840 | $1,225 | $1.46 | 43d | 1 | 0.70mi |
| 1131 Hodiamont Ave St. Louis, MO | 2.0 | 1.0 | 700 | $1,050 | $1.50 | 43d | 1 | 0.70mi |
| 6409 Enright Ave University City, MO | 3.0 | 1.5 | 1320 | $2,420 | $1.83 | 1d | 2 | 0.70mi |
| 7055 Dartmouth Ave Unit 1 University City, MO | 2.0 | 1.0 | 1320 | $2,100 | $1.59 | 43d | 1 | 0.73mi |
| 7055 Dartmouth Ave Unit 2 University City, MO | 2.0 | 1.0 | 1320 | $2,100 | $1.59 | 43d | 1 | 0.73mi |
| 603 Westgate Ave University City, MO | 2.0 | 2.5 | 1290 | $1,750 | $1.36 | 43d | 1 | 0.75mi |
| 6650 Delmar Blvd Saint Louis, MO | 3.0 | 1.0–3.0 | 760 | $2,095 | $2.76 | 1d | 1 | 0.77mi |
| 7125 Dartmouth Ave Saint Louis, MO | 2.0 | 1.0 | 1242 | $1,550 | $1.25 | 43d | 1 | 0.79mi |
| 7104 Tulane Ave Saint Louis, MO | 2.0 | 1.0 | 1400 | $1,745 | $1.25 | 43d | 1 | 0.79mi |
| 7104 Tulane Ave Unit 1 University City, MO | 2.0 | 1.0 | 1200 | $1,900 | $1.58 | 23d | 1 | 0.79mi |
| 7120 Dartmouth Ave Unit A University City, MO | 2.0 | 1.0 | 1200 | $1,345 | $1.12 | 2d | 1 | 0.80mi |
| 7156 Tulane Ave Unit 56A University City, MO | 2.0 | 1.0 | 1000 | $1,295 | $1.29 | 21d | 1 | 0.89mi |
| 6043 Clemens Ave Apt 2E St. Louis, MO | 2.0 | 1.0 | 1023 | $1,075 | $1.05 | 23d | 1 | 0.90mi |
| 1115 Backer St Saint Louis, MO | 3.0 | 1.0 | 984 | $1,495 | $1.52 | 23d | 1 | 0.91mi |
| 5989 Julian Ave Unit 37 St. Louis, MO | 2.0 | 1.0 | 780 | $1,200 | $1.54 | 17d | 1 | 0.91mi |
| 7204 Tulane Ave Unit 7204-B Tulane University City, MO | 2.0 | 1.0 | 1100 | $1,100 | $1.00 | 43d | 1 | 0.93mi |
| 1266 Amherst Pl Unit 2nd floor St. Louis, MO | 2.0 | 1.0 | 1050 | $1,000 | $0.95 | 43d | 1 | 0.94mi |
| 6105 Delmar Blvd Saint Louis, MO | 1.0–3.0 | 1.0–3.0 | 931 | $2,610 | $2.80 | 3d | 1 | 0.95mi |
| 7254 Tulane Ave #1 University City, MO | 2.0 | 1.0 | 1144 | $1,600 | $1.40 | 17d | 1 | 1.03mi |
| 6048 Washington Blvd Unit 1W St. Louis, MO | 2.0 | 2.0 | 1012 | $1,475 | $1.46 | 43d | 1 | 1.05mi |
| 6036 Washington Blvd Apt 1W St. Louis, MO | 2.0 | 1.0 | 1200 | $1,350 | $1.12 | 17d | 1 | 1.07mi |
| 7261 Delmar Blvd University City, MO | 3.0 | 1.0 | 1416 | $1,950 | $1.38 | 1d | 1 | 1.13mi |
| 6017 Kingsbury Ave Unit 2f St. Louis, MO | 4.0 | 1.0 | 1500 | $3,250 | $2.17 | 17d | 1 | 1.18mi |
Listing history 2 events
-
2026-06-18remarks 343-char remark
-
2026-06-18$90,000 Active 1 DOM
ⓘ Source: listings_history table (triggers on properties + properties_extension) + one-shot
backfill from property_details.listing_events for pre-trigger history.
Climate risk First Street
- Flood 6/10 Major FEMA zone X (shaded) · 69% chance over 30 yrs
- Wildfire 1/10 Low
- Heat 5/10 Major 7 d/yr ≥107°F today · 21 d/yr by 30 yrs out
- Wind 2/10 Low 100% chance of damaging wind over 30 yrs
- Air quality 4/10 Moderate 4 unhealthy d/yr today · 5 by 30 yrs out
Nearby sold comps map
Loading sold comps map…
Walkable amenities ~0.75 mi
Loading nearby amenities…
Taxation est. · year 1
- Rental income
- $20,182
- − Mortgage interest
- −$5,041
- − Property taxes
- −$1,350
- − Insurance
- −$450
- − Repairs & maintenance
- −$1,615
- − Management
- −$1,615
- − Depreciation
- −$2,618
- Taxable income
- $7,493
- Est. tax owed @ 24.0%
- −$1,798
- After-tax cash flow
- $6,682/yr
For passive investors: Depreciation is non-cash, so a rental often shows a tax loss while cash-flowing — sheltering income. Rental losses are passive: they offset passive income freely, and up to $25,000/yr can offset ordinary (W-2) income if you actively participate and your MAGI is under $100k (phasing out to $0 by $150k); unused losses carry forward. On sale, claimed depreciation is recaptured at up to 25%, and gains may owe capital-gains tax (a 1031 exchange can defer both). Figures are a year-1 estimate at your 24.0% rate — not tax advice; consult a CPA.
Schools (NCES district)
- District
- University City
- NCES district ID
- 2930660
- Math proficiency
- 15% ▼ -10.00%
- Reading proficiency
- 26% ▼ -7.00%
- Median HH income
- $52,927
- Composite
- 18.57/100
- National rank
- #8910
- State rank
- #297 of 324 in MO
Livability — University City
- Score
- 73/100
- State rank
- #84
- US rank
- #5618
Category grades
Schools grade is shown separately in the Schools card above.
Census & demographics
- Census place
- University City, MO
- County
- Saint Louis County · 888,823 people
- City population
- 28,910
- Metro
- St. Louis, MO-IL
- Population (ZIP)
- 28,910
- Household income
- $85,823
- Rent vs Own
- Severe rent burden
- 893.0
Population outlook (St. Louis County) Hauer SSP2
- Today (2025)
- 1,025,227 people
- By 2030
- 1,028,023 · +0.3%
- By 2040
- 1,020,940 · -0.4%
- By 2050
- 1,007,280 · -1.8%
- By 2075
- 987,277 · -3.7%
- By 2100
- 921,984 · -10.1%
Race, ethnicity, and origin ACS 2023
- Neighborhood character
- Diverse neighborhood (Simpson 0.61)
- Race & ethnicity
- White 54% Black 31% Asian 6% Two or more races 6% Hispanic / Latino 4%
- Common ancestry
- Italian 3% Romanian 3% Lithuanian 2%
- Foreign-born
- 11% · China, Canada, Vietnam
- Languages at home
- 89% English-only · Chinese 4% Spanish 2% French/Haitian/Cajun 1%
Political lean MEDSL · St. Louis
- 2024 margin
- Strong D (+23.4) · D 60.8% · R 37.4% · Other 1.7%
- 2008→2024 swing
- +3.5pp toward D · 2008: 19.9pp · 2024: 23.4pp
- All cycles
- 2024: D+23.4 2020: D+24.0 2016: D+16.2 2012: D+13.7 2008: D+19.9
Not yet ingested
- Civics
- —
Market trends
- HPI YoY
- ▼ -436.88%
- Current HPI
- 185.599
- Rent YoY
- ▲ 3.61%
- Metro
- St. Louis, MO-IL
- State GDP YoY
- ▲ 1.84%
- F500 in state
- 20
Industry mix (Fortune 500 HQ in MO)
| Industry | F500 HQs | Revenue |
|---|---|---|
| Healthcare | 1 | $163B |
|
||
| Insurance | 1 | $21B |
|
||
| Industrial Technology | 1 | $17B |
|
||
| Retail | 1 | $16B |
|
||
| Industrial Distribution | 1 | $10B |
|
||
| Utilities | 1 | $9B |
|
||
Price history
2 events — show timeline
- 2026-06-18 Listed $90,000 MARIS as Distributed by MLS Grid
- 2000-10-31 Sold (Public Records) — Public Records
Cash-flow waterfall
monthlySold comps — $/sqft
last 12 mo · ≤1 miLoading sold comps…