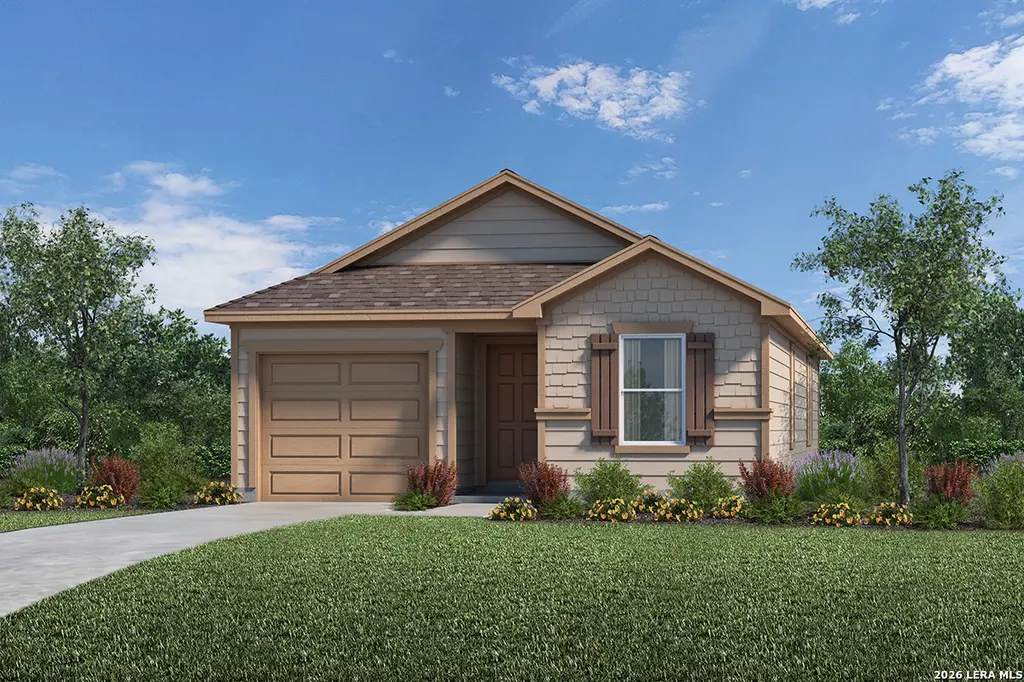
9542 Boxfield Rd · San Antonio, TX
Flood risk 1/10 · Minimal
- FEMA flood zone
- X (unshaded)
- Chance of flooding over 30 yrs
- 0.0%
- Est. flood insurance / yr
- $507 – $1,088
Fire risk 4/10 · Minor
- Est. fire insurance / yr
- $1,222 – $2,270
Heat risk 7/10 · Major
- Hot days now (above 109°F)
- 5 days/yr
- Hot days in 30 yrs
- 16 days/yr
Wind risk 8/10 · Major
- Chance of severe wind over 30 yrs
- 80.0%
Air-quality risk 2/10 · Minimal
- Unhealthy air days now
- 0 days/yr
- Unhealthy air days in 30 yrs
- 1 days/yr
Risk factors via First Street. Map © Google.
Why this score? — see what drove the D- grade
The composite is a weighted blend of 9 inputs, each scored 0–100. Each bar is that input's sub-score; the figure is the points it added to the 100-point composite (weight × sub-score).
- ARV discount +15.0/15.0
- Cash flow +6.4/30.0
- Appreciation +6.0/10.0
- Livability +4.0/5.0
- Condition / age +2.5/5.0
- Schools +1.9/10.0
- 1% rule +1.8/10.0
- DSCR +0.7/10.0
- Rent growth +0.7/5.0
$198,453
🖨 Deal sheet (PDF) 📄 Offer letter ✓ Due diligence
Listing remarks
This charming home offers 9-ft. first-floor ceilings and stylish finishes throughout. The kitchen features Whirlpool stainless steel appliances, Woodmont Cody 42-in. upper cabinets, a Daltile tile backsplash, extended breakfast bar, and granite countertops in Lyra. The primary bath includes an extended cabinet with knee space and a 42-in. garden tub/shower with Daltile tile surround. Decorative touches include a Carrara style entry door, Kwikset Polo interior door hardware, C. F. Advantage ceramic tile flooring in the bathrooms, kitchen, and great room, plus Shaw carpet in the bedrooms. Additional highlights include 2-in. faux wood blinds, an automatic sprinkler system, fully sodded yard, a
Key facts
- Granite countertops
- Garden tub shower
- Garage
Tags
Property features AI
Finance
- Financial info: Down payment assistance resource available
- HOA & community: Mandatory HOA; HOA fee $450 annually; Association transfer fee $375
Exterior
- Parking: 1-car garage
- Utilities: Public water; Public sewer; Electric service
- Home design: New construction by KB Home; Slab foundation; Composition roof
- Construction: Built new (approximate age: 0)
- Exterior features: Cement fiber exterior; Community pool; Park/playground
Interior
- Kitchen: Kitchen — 10 x 9
- Bedrooms: Master bedroom (lower level) — 13 x 11; Bedroom 2 — 10 x 10; Bedroom 3 — 10 x 10
- Flooring: Carpeting; Ceramic tile flooring
- Bathrooms: 2 full bathrooms; Master bathroom with tub/shower combination — 8 x 6
- Heating & cooling: Central heating (electric); Central air conditioning
- Interior features: Washer and dryer connections; Energy Star certified
- Laundry & utility: Washer connection; Dryer connection
Neighborhood map
What this means for you Summary
Snapshot
- This is a 3-bed/2.0-bath single-family listed at $198k.
Deal economics
- At list price, monthly cash flow is $-348 ($-4k/yr) — negative.
- To cash-flow at today's rent, offer at most $148k (25.3% below list).
- To meet the 1% rule (rent ≥ 1% of price), the offer needs to be $134k (32.3% below list).
- Recommended offer: $134k (32.3% below list) — sets the bar for 1% rule.
Location & tenants
- Location reads 80/100 on livability (#31 in TX, #1,616 nationally) — a professional / high-income tenant draw. Strengths: amenities A+, commute A+, cost of living A+; Watch: crime F.
- Harlandale ISD (urban): math 20% / reading 27% proficiency, ranked #748 of 826 in TX (top 91%) — low school quality limits family demand, transient renter base, plan for 1-2y turnover; 66% free/reduced lunch — lower-income household profile, screen leases tightly.
- Zoned schools: H W Schulze El (math 15% / reading 27%, grade F, #3,492 of 4,322 statewide, top 81%, 594 students, 86% FRL); Kingsborough Middle (math 17% / reading 29%, grade F, #1,327 of 1,662 statewide, top 81%, 567 students, 88% FRL); Mccollum H S (math 31% / reading 31%, grade F, #1,077 of 1,632 statewide, top 66%, 1,494 students, 78% FRL) — zoned schools average 84% FRL vs 66% district-wide (18 pts higher); higher-poverty schools than district average — tighter screening recommended.
- Market conditions: Rents falling (-7.2%/yr); 389 active listings in the ZIP; 31 comparable units currently listed for rent nearby; rentals at typical pace (median 26d on market — plan ~3-4 weeks tenant-placement turnaround); 8,308 units permitted in Bexar County in 2024 (2,506 in 5+ unit buildings).
Forward outlook
- In year one you build about $5k of equity ($1k loan paydown + $4k appreciation (2.0% local appreciation)).
- Bexar County population projected at +50% by 2050 — long-run rental-demand tailwind backs the buy-and-hold thesis.
- By year 7, paydown + projected appreciation supports a ~$35k cash-out refi (75% LTV) — recoverable capital for the next deal without selling this one.
Negotiation context
- It's been on market 35 days — a 3% lower offer ($192k) is reasonable based on typical stale-listing flexibility.
Risks & watch-outs
- Climate carrying-cost: severe wind risk, 80% chance of damaging wind over 30y; extreme-heat days projected 5→16/yr by 2055 (HVAC capex compounding) — expect insurance premiums to compound above CPI over the hold.
Questions for the listing agent
- What do current leases actually rent for vs. the listed asking? Can we see a recent rent roll and the last 12 months of T-12 income?
- It's been on market 35 days. Have you received any prior offers? Is the seller open to a 32% concession, seller financing, or rate buy-down credit?
- What does the HOA fee cover, when was the last increase, and are there any pending special assessments or reserve-fund shortfalls?
- Is there a deadline driving the sale (1031 exchange, divorce, estate, relocation)? That informs how much negotiation room exists.
- Crime grade is F in this area — have there been break-ins, vandalism, or insurance claims at this property in the last 3 years? What carrier currently insures it and at what premium?
- The area grade is low — what's the realistic commute time and amenity access for the typical tenant pool here? Any planned neighborhood developments (good or bad) we should know about?
- What's the average days-on-market for RENTAL listings here right now (not sales)? A rising rental-DOM trend means longer vacancies and softer asking-rent achievability than the comps imply.
- What's the recent tenant-quality profile in this submarket — average credit score on applications, eviction rate, late-payment / NSF rate, and stable-employment percentage? A property-management company in the area should have these aggregated.
- How much new for-sale + rental construction is in the pipeline within 1–3 miles? Heavy new supply typically softens prices + rents 12–24 months out; constrained supply supports both.
Investment metrics
- 1% rule
- 0.68% ✗
- Cap rate
- 4.19%
- Cash-on-cash
- -7.51%
- DSCR
- 0.67
- GRM
- 12.3
CMA / ARV
- ARV (median comp)
- $239,342
- List price
- $198,453
- Delta
- -17.08%
- Verdict
- UNDERPRICED
- Comps
- 20 within 1.0 mi
Show comp detail 12 sales within ~0.75 mi
| Address | Dist | Beds/Ba | Sqft | Sold | Price | $/sf | Match |
|---|---|---|---|---|---|---|---|
| 818 Goodhart | 0.13mi | 3/2.0 | 1,200 (-4%) | 5mo | $229,990 | $192 | 84 |
| 9622 Nethery Ct | 0.18mi | 3/2.0 | 1,200 (-4%) | 2mo | $237,990 | $198 | 84 |
| 819 Middlebury Farms | 0.15mi | 3/2.0 | 1,412 (+13%) | 2mo | $253,990 | $180 | 69 |
| 1014 Gruma | 0.31mi | 3/2.0 | 1,358 (+9%) | 2mo | $203,750 | $150 | 68 |
| 9626 Nethery Ct | 0.19mi | 3/2.0 | 1,412 (+13%) | 4mo | $252,990 | $179 | 65 |
| 819 Sams Dr | 0.46mi | 4/2.0 (+1) | 1,344 (+8%) | 3mo | $220,000 | $164 | 58 |
| 9942 Auger Run | 0.67mi | 3/2.0 | 1,186 (-5%) | 6mo | $253,000 | $213 | 56 |
| 9919 De Allende Path | 0.60mi | 3/2.0 | 1,156 (-7%) | 6mo | $252,415 | $218 | 56 |
| 711 Bellamy Dr | 0.51mi | 3/2.0 | 1,396 (+12%) | 5mo | $279,999 | $201 | 51 |
| 9888 Chavaneaux Lndg | 0.59mi | 3/2.0 | 1,388 (+12%) | 3mo | $263,855 | $190 | 51 |
| 9907 Chavaneaux Lndg | 0.63mi | 3/2.0 | 1,388 (+12%) | 3mo | $267,195 | $193 | 49 |
| 9939 Auger Run | 0.67mi | 3/2.0 | 1,411 (+13%) | 3mo | $265,595 | $188 | 44 |
Match score weights: distance 35% · size 25% · config 20% · recency 20%. Top-matched comps best support the ARV.
Projected returns pro-forma
2.03% appreciation · 0.0% rent growth · sell at horizon
- IRR
- -4.1%
- Equity multiple
- 0.78×
- Total profit
- $-12,137
- Equity at exit
- $78,581
- IRR
- -0.5%
- Equity multiple
- 0.93×
- Total profit
- $-3,758
- Equity at exit
- $113,393
Cash invested: $55,567 (down + closing). Projections, not guarantees.
Landlord ↔ Tenant lean methodology
- Overall (STATE)
- 87 Strongly Landlord-Friendly
- State Texas
- 87 Strongly Landlord-Friendly · R+5
- County
- — inherits STATE
- City
- — inherits STATE
ZIP-level market 78221
- Home prices YoY
- 0.8%
- Rents YoY
- -7.2%
- Active inventory
- 389
- Price-to-rent
- 12.3×
Monthly cashflow live
- Estimated rent
- $1,344 high interval (Pro) →
- Mortgage (P&I)
- −$1,041
- Tax est. 1.5%
- −$248 /mo · $2,977/yr
- Insurance
- −$83
- HOA
- −$38
- Vacancy / Maint / Mgmt
- −$282
- Net cashflow
- $-348
Break-even live
Sensitivity live
| Price | -10% $-210 | -5% $-279 | +0% $-348 | +5% $-416 | +10% $-485 |
|---|---|---|---|---|---|
| Rent | -10% $-454 | -5% $-401 | +0% $-348 | +5% $-294 | +10% $-241 |
| Rate | -1.0pp $-248 | -0.5pp $-297 | base $-348 | +0.5pp $-399 | +1.0pp $-451 |
UW: 25.0% down · 7.5% · 30yr · 1.5% tax · 5.0% vac · 8.0% maint · 8.0% mgmt
Financing live
Cash to close
- Down payment
- $49,613
- Closing costs
- $5,954
- Reserves months
- —
- Total cash needed
- —
Loan-product check · same deal, 3 products live
Conventional
25% down · 7.5% · 30yr
- Down + closing
- —
- Monthly P&I
- —
- Monthly cashflow
- —
- DSCR
- —
- Eligible?
- —
Personal DTI + credit; lowest rate.
DSCR
20% down · 8.5% · 30yr
- Down + closing
- —
- Monthly P&I
- —
- Monthly cashflow
- —
- DSCR
- —
- Eligible?
- —
No personal income docs; deal must DSCR.
Hard money
10% down · 12.0% · 12mo
- Down + closing
- —
- Monthly P&I
- —
- Monthly cashflow
- —
- DSCR
- —
- Eligible?
- —
Short-term bridge; refi at stabilization.
Rent comps 31 comps
| Address | Beds | Baths | Sqft | Rent | $/sqft | DOM | Units | Dist |
|---|---|---|---|---|---|---|---|---|
| 619 Pleasanton Way San Antonio, TX | 3.0 | 2.0 | 1336 | $1,495 | $1.12 | 25d | 1 | 0.51mi |
| 15949 S Flores St San Antonio, TX | 3.0 | 2.0 | 1232 | $1,475 | $1.20 | 45d | 1 | 0.66mi |
| 15966 S Flores St San Antonio, TX | 3.0 | 2.0 | 1242 | $1,585 | $1.28 | 45d | 1 | 0.68mi |
| 614 Barberry St Unit 101 San Antonio, TX | 2.0 | 2.0 | 1200 | $1,095 | $0.91 | 13d | 1 | 0.69mi |
| 218 E Villaret Blvd San Antonio, TX | 2.0 | 1.0 | 861 | $1,295 | $1.50 | 14d | 1 | 0.81mi |
| 906 E Petaluma Blvd San Antonio, TX | 3.0 | 2.0 | 936 | $1,450 | $1.55 | 18d | 1 | 0.82mi |
| 144 E Villaret Blvd Unit 142 San Antonio, TX | 2.0 | 1.0 | 800 | $995 | $1.24 | 16d | 1 | 0.89mi |
| 1011 Catalonia Pass San Antonio, TX | 3.0 | 2.5 | 1470 | $1,700 | $1.16 | 25d | 1 | 0.89mi |
| 144 E Villaret Blvd Unit 116 San Antonio, TX | 2.0 | 1.0 | 800 | $1,025 | $1.28 | 25d | 1 | 0.89mi |
| 144 E Villaret Blvd Unit 148 San Antonio, TX | 2.0 | 1.0 | 800 | $995 | $1.24 | 23d | 1 | 0.89mi |
| 144 E Villaret Blvd Unit 106 San Antonio, TX | 2.0 | 1.0 | 800 | $995 | $1.24 | 45d | 1 | 0.89mi |
| 144 E Villaret Blvd Unit 156 San Antonio, TX | 2.0 | 1.0 | 800 | $995 | $1.24 | 25d | 1 | 0.89mi |
| 1015 Catalonia Pass San Antonio, TX | 3.0 | 2.0 | 1280 | $1,600 | $1.25 | 6d | 1 | 0.90mi |
| 8503 S Flores St San Antonio, TX | 2.0 | 1.0 | 785 | $1,125 | $1.43 | 6d | 1 | 0.92mi |
| 8816 Oakbrook St San Antonio, TX | 4.0 | 2.0 | 1326 | $1,595 | $1.20 | 25d | 1 | 0.97mi |
| 8815 Oakbrook St San Antonio, TX | 3.0 | 1.0 | 1160 | $1,300 | $1.12 | 45d | 1 | 1.01mi |
| 1622 Saenz San Antonio, TX | 3.0 | 2.0 | 1298 | $1,475 | $1.14 | 23d | 1 | 1.10mi |
| 102 Emerald Ash Unit 710 San Antonio, TX | 2.0 | 2.0 | 950 | $973 | $1.02 | 0d | 1 | 1.11mi |
| 218 W Villaret Blvd San Antonio, TX | 2.0 | 1.0 | 864 | $1,295 | $1.50 | 16d | 1 | 1.11mi |
| 8237 S Flores St Unit 615 San Antonio, TX | 2.0 | 2.0 | 910 | $915 | $1.01 | 16d | 1 | 1.11mi |
| 8237 S Flores St Unit 710 San Antonio, TX | 2.0 | 2.0 | 910 | $1,024 | $1.13 | 0d | 1 | 1.11mi |
| 8237 S Flores St Unit 1116 San Antonio, TX | 2.0 | 2.0 | 910 | $1,149 | $1.26 | 45d | 1 | 1.11mi |
| 8237 S Flores St San Antonio, TX | 2.0 | 1.0 | 837 | $989 | $1.18 | 45d | 1 | 1.13mi |
| 114 Dorsey St Unit 3 San Antonio, TX | 2.0 | 1.0 | 1000 | $1,150 | $1.15 | 45d | 1 | 1.17mi |
| 114 Dorsey St Unit 2 San Antonio, TX | 3.0 | 1.0 | 1200 | $900 | $0.75 | 45d | 1 | 1.17mi |
| 114 Dorsey St #1 San Antonio, TX | 3.0 | 1.0 | 1200 | $1,150 | $0.96 | 45d | 1 | 1.17mi |
| 1803 Marshall Cross San Antonio, TX | 1.0–3.0 | 1.0–2.0 | 942 | $1,425 | $1.51 | 3d | 38 | 1.30mi |
| 1803 Marshall Cross Unit 710 San Antonio, TX | 2.0 | 2.0 | 849 | $807 | $0.95 | 18d | 1 | 1.31mi |
| 351 E Amber St San Antonio, TX | 3.0 | 1.0 | 966 | $1,390 | $1.44 | 45d | 1 | 1.33mi |
| 3718 Pleasanton Rd Unit 103 San Antonio, TX | 2.0 | 1.0 | 850 | $995 | $1.17 | 25d | 1 | 1.42mi |
| 3718 Pleasanton Rd Unit 202 San Antonio, TX | 3.0 | 1.0 | 950 | $1,295 | $1.36 | 25d | 1 | 1.42mi |
HOA detail
- Monthly dues
- $38 · $456/yr
- Likely covers
- pool
Listing history 17 events
-
2026-06-21statusdays on market $198,453 Pending 35 DOM
-
2026-06-18days on market $198,453 Active Option 34 DOM
-
2026-06-17days on market $198,453 Active Option 33 DOM
-
2026-06-16days on market $198,453 Active Option 32 DOM
-
2026-06-15days on market $198,453 Active Option 31 DOM
-
2026-06-13days on market $198,453 Active Option 29 DOM
-
2026-06-13statusdays on market $198,453 Active Option 28 DOM
-
2026-06-09days on market $198,453 Active 25 DOM
-
2026-06-08days on market $198,453 Active 24 DOM
-
2026-06-07days on market $198,453 Active 23 DOM
-
2026-06-04days on market $198,453 Active 20 DOM
-
2026-06-03days on market $198,453 Active 19 DOM
-
2026-06-02days on market $198,453 Active 18 DOM
-
2026-06-01days on market $198,453 Active 17 DOM
-
2026-05-31days on market $198,453 Active 16 DOM
-
2026-05-15$198,453 New 712-char remark
-
2026-05-13$198,453 Active 822-char remark
ⓘ Source: listings_history table (triggers on properties + properties_extension) + one-shot
backfill from property_details.listing_events for pre-trigger history.
Climate risk First Street
- Flood 1/10 Low FEMA zone X (unshaded) · 0% chance over 30 yrs
- Wildfire 4/10 Moderate
- Heat 7/10 Severe 5 d/yr ≥109°F today · 16 d/yr by 30 yrs out
- Wind 8/10 Severe 80% chance of damaging wind over 30 yrs
- Air quality 2/10 Low 0 unhealthy d/yr today · 1 by 30 yrs out
Nearby sold comps map
Loading sold comps map…
Walkable amenities ~0.75 mi
Loading nearby amenities…
Taxation est. · year 1
- Rental income
- $16,131
- − Mortgage interest
- −$11,116
- − Property taxes
- −$2,977
- − Insurance
- −$992
- − Repairs & maintenance
- −$1,290
- − Management
- −$1,290
- − HOA
- −$456
- − Depreciation
- −$5,773
- Taxable loss
- −$7,765
- Est. tax savings @ 24.0%
- +$1,864
- After-tax cash flow
- $-2,307/yr
For passive investors: Depreciation is non-cash, so a rental often shows a tax loss while cash-flowing — sheltering income. Rental losses are passive: they offset passive income freely, and up to $25,000/yr can offset ordinary (W-2) income if you actively participate and your MAGI is under $100k (phasing out to $0 by $150k); unused losses carry forward. On sale, claimed depreciation is recaptured at up to 25%, and gains may owe capital-gains tax (a 1031 exchange can defer both). Figures are a year-1 estimate at your 24.0% rate — not tax advice; consult a CPA.
Schools (NCES district)
- District
- Harlandale ISD
- NCES district ID
- 4822470
- Math proficiency
- 20% ▼ -22.00%
- Reading proficiency
- 27% ▼ -9.00%
- Median HH income
- $33,850
- Composite
- 19.25/100
- National rank
- #8806
- State rank
- #748 of 826 in TX
Livability — San Antonio
- Score
- 80/100
- State rank
- #31
- US rank
- #1616
Category grades
Schools grade is shown separately in the Schools card above.
Census & demographics
- Census place
- San Antonio, TX
- County
- Bexar County · 1,990,555 people
- City population
- 1,806,925
- Metro
- San Antonio-New Braunfels, TX
- Population (ZIP)
- 42,178
- Household income
- $63,811
- Rent vs Own
- Severe rent burden
- 1180.0
Population outlook (Bexar County) Hauer SSP2
- Today (2025)
- 2,336,851 people
- By 2030
- 2,560,728 · +9.6%
- By 2040
- 3,020,569 · +29.3%
- By 2050
- 3,493,522 · +49.5%
- By 2075
- 4,668,459 · +99.8%
- By 2100
- 5,533,242 · +136.8%
Race, ethnicity, and origin ACS 2023
- Neighborhood character
- Predominantly Hispanic (89%)
- Race & ethnicity
- Hispanic / Latino 89% Two or more races 28% White 9% Native American 2%
- Hispanic origin (detail)
- Mexican 74%
- Common ancestry
- Lithuanian 1% Romanian 1%
- Foreign-born
- 16% · Canada
- Languages at home
- 45% English-only · Spanish 54%
Political lean MEDSL · Bexar
- 2024 margin
- Lean D (+9.8) · D 54.3% · R 44.6% · Other 1.1%
- 2008→2024 swing
- +4.2pp toward D · 2008: 5.6pp · 2024: 9.8pp
- All cycles
- 2024: D+9.8 2020: D+18.2 2016: D+13.5 2012: D+4.6 2008: D+5.6
Not yet ingested
- Civics
- —
Market trends
- HPI YoY
- ▲ 2.03%
- Current HPI
- 251.1635
- Rent YoY
- ▼ -7.21%
- Metro
- San Antonio-New Braunfels, TX
- State GDP YoY
- ▲ 3.95%
- F500 in state
- 110
Industry mix (Fortune 500 HQ in TX)
| Industry | F500 HQs | Revenue |
|---|---|---|
| Energy | 16 | $1,198B |
|
||
| Technology | 5 | $198B |
|
||
| Engineering / Construction | 4 | $72B |
|
||
| Energy Services | 3 | $60B |
|
||
| Utilities | 3 | $41B |
|
||
| Healthcare | 2 | $330B |
|
||
Price history
2 events — show timeline
- 2026-06-12 Contingent — LERA
- 2026-05-15 Listed $198,453 LERA
Cash-flow waterfall
monthlySold comps — $/sqft
last 12 mo · ≤1 miLoading sold comps…