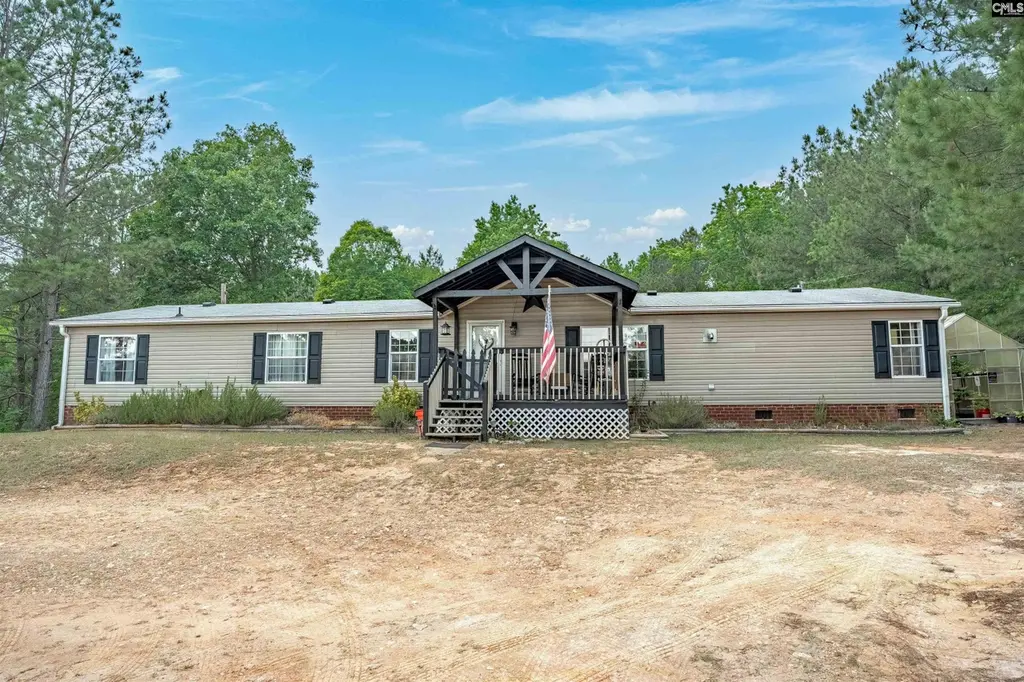
222 Gloria Trl · Blythewood, SC
Flood risk 1/10 · Minimal
- FEMA flood zone
- X (unshaded)
- Chance of flooding over 30 yrs
- 0.0%
- Est. flood insurance / yr
- $507 – $1,088
Fire risk 4/10 · Minor
- Est. fire insurance / yr
- $783 – $1,453
Heat risk 6/10 · Moderate
- Hot days now (above 107°F)
- 7 days/yr
- Hot days in 30 yrs
- 16 days/yr
Wind risk 6/10 · Moderate
- Chance of severe wind over 30 yrs
- 58.0%
Air-quality risk 3/10 · Minor
- Unhealthy air days now
- 2 days/yr
- Unhealthy air days in 30 yrs
- 3 days/yr
Risk factors via First Street. Map © Google.
Why this score? — see what drove the F grade
The composite is a weighted blend of 9 inputs, each scored 0–100. Each bar is that input's sub-score; the figure is the points it added to the 100-point composite (weight × sub-score).
- Cash flow +8.9/30.0
- ARV discount +7.5/15.0
- Livability +3.5/5.0
- Rent growth +3.1/5.0
- Schools +2.6/10.0
- DSCR +2.5/10.0
- Condition / age +2.5/5.0
- 1% rule +1.5/10.0
- Appreciation +0.0/10.0
$245,000
🖨 Deal sheet 📄 Offer letter ✓ Due diligence
Listing remarks
This 5-bedroom, 3-bath home sits on just over 3 fabulous acres of land, giving you plenty of room to spread out, relax, and enjoy a quieter pace of life! Inside you’ll find nearly 2,000 square feet with a comfortable, functional layout. Get cozy in the living room, that has a wood-burning fireplace or the dining room that has a pellet stove. The kitchen is a standout with granite countertops, stainless appliances, and an easy flow into the main living spaces—perfect for both everyday living and entertaining. A split bedroom design adds extra privacy to the primary suite, with a bathroom with double vanities and a walk in shower. The additional bedrooms provide flexibility for g
Key facts
- Split bedroom design
- Stainless appliances
- Pellet stove
Tags
Property features AI
Exterior
- Parking: Driveway access (details not specified)
- Utilities: Public water
- Home design: Single-story home
- Construction: Vinyl exterior; Crawlspace foundation
- Exterior features: Above-ground pool; Covered front porch; Covered back porch; Full gutters; Storage shed; Rear wood livestock fence (rear only)
Interior
- Kitchen: Granite countertops; Free-standing gas range; Microwave above range; Dishwasher; Refrigerator; Freezer
- Bedrooms: Master bedroom on main level with double vanity, separate shower, walk-in closet, ceiling fan, carpet and tile flooring; Bedroom 2 with private closet and luxury vinyl plank flooring (shared bath); Bedroom 3 with private closet, ceiling fan and carpet flooring (shared bath); Bedroom 4 with private closet, ceiling fan and carpet flooring (Jack & Jill bath); Bedroom 5 with private closet, ceiling fan and luxury vinyl plank flooring (Jack & Jill bath)
- Flooring: Carpet in living areas and several bedrooms; Tile in master bedroom areas; Luxury vinyl plank in select rooms and formal dining
- Bathrooms: Three full bathrooms
- Heating & cooling: Central air conditioning; Central electric heating
- Interior features: Built-in shelving; Smoke detectors; Two wood-burning fireplaces; Ceiling fans in living areas
- Laundry & utility: Main-level laundry in heated mud room; Washer and dryer included; Electric hookup
Utilities
- Utility Information: Septic system
Neighborhood map
What this means for you Summary
Snapshot
- This is a 3-bed/2.0-bath manufactured listed at $245k.
Deal economics
- At list price, monthly cash flow is $-198 ($-2k/yr) — negative.
- To cash-flow at today's rent, offer at most $210k (14.2% below list).
- To meet the 1% rule (rent ≥ 1% of price), the offer needs to be $158k (35.4% below list).
- Recommended offer: $158k (35.4% below list) — sets the bar for 1% rule.
Location & tenants
- Location reads 70/100 on livability (#58 in SC) — a middle-class / working-renter tenant base. Strengths: crime A+, employment A+, housing A+; Watch: amenities F, commute F, health & safety F.
- Richland 01 (urban): math 26% / reading 36% proficiency, ranked #54 of 80 in SC (top 68%) — families likely to look elsewhere, expect single-tenant / working-renter base with shorter leases; 64% free/reduced lunch — lower-income household profile, screen leases tightly.
- Zoned schools: Forest Heights Elementary (math 12% / reading 12%, grade F, #572 of 597 statewide, top 97%, 441 students, 100% FRL); Eau Claire High (math 22% / reading 84%, grade C-, #139 of 196 statewide, top 71%, 627 students, 100% FRL) — zoned schools average 100% FRL vs 64% district-wide (36 pts higher); higher-poverty schools than district average — tighter screening recommended.
- Market conditions: Rents rising (+2.5%/yr); 238 active listings in the ZIP; 3,472 units permitted in Richland County in 2024 (1,096 in 5+ unit buildings).
- This rent runs 41% of the median local income ($46k/yr) — at the standard rent-burdened threshold; future hikes will face affordability resistance.
Forward outlook
- Local home prices are declining (-3.0%/yr); year-one equity from $2k of loan paydown is wiped out by about $7k of value loss. Plan a longer hold.
- Richland County population projected at +30% by 2050 — long-run rental-demand tailwind backs the buy-and-hold thesis.
Negotiation context
- It's been on market 19 days — a 2% lower offer ($241k) is reasonable based on typical stale-listing flexibility.
- Current owner paid $90k; list at $245k implies a 172% gain — meaningful room to come down on a strong offer.
Risks & watch-outs
- Climate carrying-cost: major wind risk, 58% chance of damaging wind over 30y; extreme-heat days projected 7→16/yr by 2055 (HVAC capex compounding) — expect insurance premiums to compound above CPI over the hold.
Questions for the listing agent
- What do current leases actually rent for vs. the listed asking? Can we see a recent rent roll and the last 12 months of T-12 income?
- Is there a deadline driving the sale (1031 exchange, divorce, estate, relocation)? That informs how much negotiation room exists.
- Schools are B-rated — typically a magnet for longer-tenancy family renters. What's the average tenant stay here, and is there a school-zone premium baked into asking?
- The area grade is low — what's the realistic commute time and amenity access for the typical tenant pool here? Any planned neighborhood developments (good or bad) we should know about?
- What's the average days-on-market for RENTAL listings here right now (not sales)? A rising rental-DOM trend means longer vacancies and softer asking-rent achievability than the comps imply.
- What's the recent tenant-quality profile in this submarket — average credit score on applications, eviction rate, late-payment / NSF rate, and stable-employment percentage? A property-management company in the area should have these aggregated.
- How much new for-sale + rental construction is in the pipeline within 1–3 miles? Heavy new supply typically softens prices + rents 12–24 months out; constrained supply supports both.
Investment metrics
- 1% rule
- 0.65% ✗
- Cap rate
- 5.33%
- Cash-on-cash
- -3.46%
- DSCR
- 0.85
- GRM
- 12.9
CMA / ARV
No comps found within radius.
Projected returns pro-forma
-3.0% appreciation · 2.5% rent growth · sell at horizon
- IRR
- -22.6%
- Equity multiple
- 0.22×
- Total profit
- $-53,205
- Equity at exit
- $36,530
- IRR
- -18.2%
- Equity multiple
- 0.03×
- Total profit
- $-66,269
- Equity at exit
- $21,183
Cash invested: $68,600 (down + closing). Projections, not guarantees.
Landlord ↔ Tenant lean methodology
- Overall (STATE)
- 90 Strongly Landlord-Friendly
- State South Carolina
- 90 Strongly Landlord-Friendly · R+6
- County
- — inherits STATE
- City
- — inherits STATE
ZIP-level market 29203
- Home prices YoY
- -31.6%
- Rents YoY
- 2.5%
- Active inventory
- 238
- Price-to-rent
- 12.9×
Monthly cashflow live
- Estimated rent
- $1,582 medium interval (Pro) →
- Mortgage (P&I)
- −$1,285
- Tax from tax record
- −$61 /mo · $727/yr
- Insurance
- −$102
- HOA
- −$0
- Vacancy / Maint / Mgmt
- −$332
- Net cashflow
- $-198
Break-even live
UW: 25.0% down · 7.5% · 30yr · 1.5% tax · 5.0% vac · 8.0% maint · 8.0% mgmt
Financing live
Cash to close
- Down payment
- $61,250
- Closing costs
- $7,350
- Reserves months
- —
- Total cash needed
- —
Loan-product check · same deal, 3 products live
Conventional
25% down · 7.5% · 30yr
- Down + closing
- —
- Monthly P&I
- —
- Monthly cashflow
- —
- DSCR
- —
- Eligible?
- —
Personal DTI + credit; lowest rate.
DSCR
20% down · 8.5% · 30yr
- Down + closing
- —
- Monthly P&I
- —
- Monthly cashflow
- —
- DSCR
- —
- Eligible?
- —
No personal income docs; deal must DSCR.
Hard money
10% down · 12.0% · 12mo
- Down + closing
- —
- Monthly P&I
- —
- Monthly cashflow
- —
- DSCR
- —
- Eligible?
- —
Short-term bridge; refi at stabilization.
Listing history 5 events
-
2026-05-20status Pending
-
2026-05-06historical Active - Contingent
-
2026-05-01$245,000 Active
-
2010-10-06soldstatus $90,000
-
2009-12-18soldstatus $36,500
ⓘ Source: listings_history table (triggers on properties + properties_extension) + one-shot
backfill from property_details.listing_events for pre-trigger history.
Tax reassessment forecast SC · Resets to sale price
- Current annual tax
- $727 · $61/mo
- Projected year-2 tax
- $1,396 · $116/mo
- Expected delta
- +$670/yr (+$56/mo · 92.1%)
ⓘ Screening estimate from a state-policy table — verify with the county assessor before closing.
Climate risk First Street
- Flood 1/10 Low FEMA zone X (unshaded) · 0% chance over 30 yrs
- Wildfire 4/10 Moderate
- Heat 6/10 Major 7 d/yr ≥107°F today · 16 d/yr by 30 yrs out
- Wind 6/10 Major 58% chance of damaging wind over 30 yrs
- Air quality 3/10 Moderate 2 unhealthy d/yr today · 3 by 30 yrs out
Nearby sold comps map
Loading sold comps map…
Walkable amenities ~0.75 mi
Loading nearby amenities…
Taxation est. · year 1
- Rental income
- $18,985
- − Mortgage interest
- −$13,724
- − Property taxes
- −$727
- − Insurance
- −$1,225
- − Repairs & maintenance
- −$1,519
- − Management
- −$1,519
- − Depreciation
- −$7,127
- Taxable loss
- −$6,855
- Est. tax savings @ 24.0%
- +$1,645
- After-tax cash flow
- $-726/yr
For passive investors: Depreciation is non-cash, so a rental often shows a tax loss while cash-flowing — sheltering income. Rental losses are passive: they offset passive income freely, and up to $25,000/yr can offset ordinary (W-2) income if you actively participate and your MAGI is under $100k (phasing out to $0 by $150k); unused losses carry forward. On sale, claimed depreciation is recaptured at up to 25%, and gains may owe capital-gains tax (a 1031 exchange can defer both). Figures are a year-1 estimate at your 24.0% rate — not tax advice; consult a CPA.
Schools (NCES district)
- District
- Richland 01
- NCES district ID
- 4503360
- Math proficiency
- 26% ▼ -7.00%
- Reading proficiency
- 36% ▼ -5.00%
- Median HH income
- $38,931
- Composite
- 25.94/100
- National rank
- #7335
- State rank
- #54 of 80 in SC
Livability — Blythewood
- Score
- 70/100
- State rank
- #58
- US rank
- #7406
Category grades
Schools grade is shown separately in the Schools card above.
Census & demographics
- County
- Richland County · 389,530 people
- City population
- 30,454
- Metro
- Columbia, SC
- Population (ZIP)
- 40,653
- Household income
- $46,054
- Rent vs Own
- Severe rent burden
- 1980.0
Population outlook (Richland County) Hauer SSP2
- Today (2025)
- 459,667 people
- By 2030
- 487,524 · +6.1%
- By 2040
- 542,035 · +17.9%
- By 2050
- 595,371 · +29.5%
- By 2075
- 732,998 · +59.5%
- By 2100
- 820,415 · +78.5%
Race, ethnicity, and origin ACS 2023
- Neighborhood character
- Predominantly Black (80%)
- Race & ethnicity
- Black 80% White 13% Hispanic / Latino 5% Two or more races 2%
- Common ancestry
- Serbian 1%
- Foreign-born
- 3% · Canada
- Languages at home
- 93% English-only · Spanish 5%
Political lean MEDSL · Richland
- 2024 margin
- Solid D (+34.6) · D 66.4% · R 31.8% · Other 1.8%
- 2008→2024 swing
- +5.7pp toward D · 2008: 28.9pp · 2024: 34.6pp
- All cycles
- 2024: D+34.6 2020: D+38.3 2016: D+32.9 2012: D+33.3 2008: D+28.9
Not yet ingested
- Civics
- —
Market trends
- HPI YoY
- ▼ -77.52%
- Current HPI
- 168.2114
- Rent YoY
- ▲ 2.50%
- Metro
- Columbia, SC
- State GDP YoY
- ▲ 4.51%
- F500 in state
- 2
Industry mix (Fortune 500 HQ in SC)
| Industry | F500 HQs | Revenue |
|---|---|---|
| Packaging | 1 | $7B |
|
||
Price history
+571.2% since first listed5 events — show timeline
- 2026-05-20 Pending — Consolidated MLS
- 2026-05-06 Contingent — Consolidated MLS
- 2026-05-01 Listed $245,000 Consolidated MLS
- 2010-10-06 Sold (Public Records) $90,000 Public Records
- 2009-12-18 Sold (Public Records) $36,500 Public Records
Property tax history
-0.7%/yrLatest (2025): $727 · +4.0% YoY. Source: county tax records.
Cash-flow waterfall
monthlySold comps — $/sqft
last 12 mo · ≤1 miLoading sold comps…