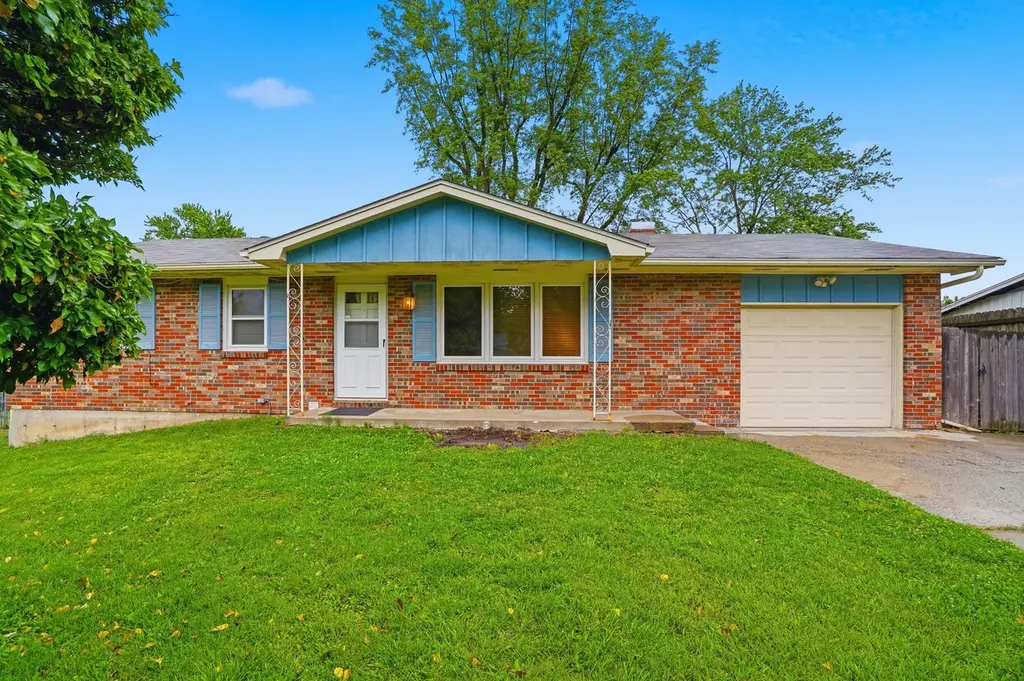
812 Oak Lawn Dr · Columbia, MO
Flood risk 1/10 · Minimal
- FEMA flood zone
- X (unshaded)
- Chance of flooding over 30 yrs
- 0.0%
- Est. flood insurance / yr
- $473 – $860
Fire risk 2/10 · Minimal
- Est. fire insurance / yr
- $1,054 – $1,958
Heat risk 4/10 · Minor
- Hot days now (above 107°F)
- 7 days/yr
- Hot days in 30 yrs
- 19 days/yr
Wind risk 2/10 · Minimal
- Chance of severe wind over 30 yrs
- —
Air-quality risk 2/10 · Minimal
- Unhealthy air days now
- 1 days/yr
- Unhealthy air days in 30 yrs
- 1 days/yr
Risk factors via First Street. Map © Google.
Why this score? — see what drove the D- grade
The composite is a weighted blend of 9 inputs, each scored 0–100. Each bar is that input's sub-score; the figure is the points it added to the 100-point composite (weight × sub-score).
- Cash flow +8.9/30.0
- ARV discount +8.8/15.0
- Livability +4.2/5.0
- Rent growth +4.0/5.0
- Schools +3.1/10.0
- DSCR +2.5/10.0
- Condition / age +2.5/5.0
- 1% rule +2.0/10.0
- Appreciation +0.0/10.0
$285,000
🖨 Deal sheet 📄 Offer letter ✓ Due diligence
Listing remarks
Calling all Handy Buyers and Investors!!! Located off Green Meadows in Oakwood Hills, this ranch walkout offers a great opportunity for sweat equity. This 3-sides brick home needs some TLC but provides the perfect canvas for a handy buyer. Features include 4 bedrooms with a potential 5th, 2.5 baths, a large kitchen with room for an island, brand-new carpet on the main level, and a huge deck overlooking the fenced backyard. Windows have been replaced to vinyl double pane, and the HVAC has been updated at some point. Oversized lawn shed with concrete floor. Desirable school district: Russell, Gentry, and Rock Bridge. You can't beat this location or price point! Home is to be sold As-is. Buyer
Key facts
- Oversized lawn shed
- Large kitchen
- Huge deck
Tags
Property features AI
Exterior
- Parking: Attached garage (1-car); Paved open parking
- Utilities: Public water; Cable available
- Home design: Single family residence; Level lot; Paved road access; Zoned R-1 (one-family dwelling)
- Construction: Below-grade finished area (basement) present
- Exterior features: Covered patio/deck; Deck; Front porch; Full chain link fencing; Shed(s)
Interior
- Kitchen: Refrigerator; Disposal; Dishwasher; Convection oven; Built-in oven
- Bedrooms: 3 total rooms
- Flooring: Carpet; Laminate; Tile; Vinyl
- Bathrooms: 2 full bathrooms; 1 half bathroom
- Heating & cooling: Central air; Attic fan; Forced air heating; Natural gas heating; Fireplace insert (wood-burning fireplace in family room)
- Interior features: Pantry; Walk-out basement
- Laundry & utility: Washer/dryer connections available
Neighborhood map
What this means for you Summary
Snapshot
- This is a 4-bed/2.5-bath single-family listed at $285k.
Deal economics
- At list price, monthly cash flow is $-231 ($-3k/yr) — negative.
- To cash-flow at today's rent, offer at most $244k (14.3% below list).
- To meet the 1% rule (rent ≥ 1% of price), the offer needs to be $199k (30.1% below list).
- Recommended offer: $199k (30.1% below list) — sets the bar for 1% rule.
- Cap rate 5.3% vs local median 2.9% in Columbia — top-decile yield for the area; either an underpriced asset or a hidden risk that comps aren't pricing in. Stress-test before assuming the spread holds.
Location & tenants
- Location reads 83/100 on livability (#9 in MO, #862 nationally) — a professional / high-income tenant draw. Strengths: amenities A+, commute A+, cost of living A+; Watch: crime D+.
- Columbia 93 (urban): math 30% / reading 43% proficiency, ranked #194 of 324 in MO (top 60%) — families likely to look elsewhere, expect single-tenant / working-renter base with shorter leases.
- Zoned schools: Ann Hawkins Gentry Middle (math 40% / reading 47%, grade D, #127 of 391 statewide, top 34%, 719 students, 31% FRL); Rock Bridge Sr. High (math 39% / reading 68%, grade C-, #83 of 521 statewide, top 16%, 2,032 students, 18% FRL).
- Zoned-school proficiency averages 48% at this address vs 36% district-wide (+12 pts) — the actual schools serving this property are materially stronger than the Columbia 93 average implies; a family-tenant draw the district grade alone would hide.
- Market conditions: Rents rising fast (+6.1%/yr); 459 active listings in the ZIP; 19 comparable units currently listed for rent nearby; rentals at typical pace (median 21d on market — plan ~3-4 weeks tenant-placement turnaround); solid renter incomes; 1,303 units permitted in Boone County in 2024 (549 in 5+ unit buildings).
Forward outlook
- Local home prices are declining (-3.0%/yr); year-one equity from $2k of loan paydown is wiped out by about $9k of value loss. Plan a longer hold.
- Boone County population projected at +36% by 2050 — long-run rental-demand tailwind backs the buy-and-hold thesis.
Negotiation context
- Only 4 days on market — expect competitive offers; lowballing is unlikely to land.
Questions for the listing agent
- What do current leases actually rent for vs. the listed asking? Can we see a recent rent roll and the last 12 months of T-12 income?
- Built in 1970 — when were the roof, HVAC, electrical panel, plumbing, and water heater last replaced?
- Is there a deadline driving the sale (1031 exchange, divorce, estate, relocation)? That informs how much negotiation room exists.
- Schools are B-rated — typically a magnet for longer-tenancy family renters. What's the average tenant stay here, and is there a school-zone premium baked into asking?
- Crime grade is D in this area — have there been break-ins, vandalism, or insurance claims at this property in the last 3 years? What carrier currently insures it and at what premium?
- The area grade is low — what's the realistic commute time and amenity access for the typical tenant pool here? Any planned neighborhood developments (good or bad) we should know about?
- What's the average days-on-market for RENTAL listings here right now (not sales)? A rising rental-DOM trend means longer vacancies and softer asking-rent achievability than the comps imply.
- What's the recent tenant-quality profile in this submarket — average credit score on applications, eviction rate, late-payment / NSF rate, and stable-employment percentage? A property-management company in the area should have these aggregated.
- How much new for-sale + rental construction is in the pipeline within 1–3 miles? Heavy new supply typically softens prices + rents 12–24 months out; constrained supply supports both.
Investment metrics
- 1% rule
- 0.70% ✗
- Cap rate
- 5.32%
- Cash-on-cash
- -3.47%
- DSCR
- 0.85
- GRM
- 11.9
CMA / ARV
- ARV (median comp)
- $293,695
- List price
- $285,000
- Delta
- -2.96%
- Verdict
- FAIR
- Comps
- 20 within 1.0 mi
Show comp detail 12 sales within ~0.75 mi
| Address | Dist | Beds/Ba | Sqft | Sold | Price | $/sf | Match |
|---|---|---|---|---|---|---|---|
| 817 Cypress Ln | 0.12mi | 3/2.5 (-1) | 1,651 (-4%) | 8mo | $275,000 | $167 | 76 |
| 2702 Lynnwood Dr | 0.38mi | 4/2.5 | 1,788 (+4%) | 7mo | $317,500 | $178 | 70 |
| 400 & 420 N Village Cir | 0.53mi | 4/2.5 | 1,758 (+2%) | 8mo | $581,000 | $330 | 65 |
| 3509 Danvers Dr | 0.33mi | 3/2.5 (-1) | 1,867 (+8%) | 1mo | $329,900 | $177 | 64 |
| 3704 Bethel St | 0.48mi | 3/2.0 (-1) | 1,720 (-0%) | 9mo | $310,000 | $180 | 63 |
| 3310 Lynnwood Dr | 0.06mi | 3/1.5 (-1) | 1,526 (-11%) | 8mo | $210,000 | $138 | 62 |
| 504 & 409 N & S Village Cir | 0.54mi | 4/2.5 | 1,640 (-5%) | 8mo | $545,000 | $332 | 60 |
| 505 Brogan Cellars Ln | 0.28mi | 3/2.0 (-1) | 1,900 (+10%) | 9mo | $385,000 | $203 | 55 |
| 2516 Lynnwood Dr | 0.45mi | 3/3.0 (-1) | 1,944 (+13%) | 7mo | $319,900 | $165 | 44 |
| 101 E EL Cortez Dr | 0.67mi | 3/2.5 (-1) | 1,531 (-11%) | 1mo | $274,000 | $179 | 44 |
| 3700 Santiago Dr | 0.60mi | 3/3.0 (-1) | 1,939 (+13%) | 1mo | $325,000 | $168 | 43 |
| 111 E Alhambra Dr | 0.72mi | 3/2.0 (-1) | 1,864 (+8%) | 5mo | $315,000 | $169 | 42 |
Match score weights: distance 35% · size 25% · config 20% · recency 20%. Top-matched comps best support the ARV.
Projected returns pro-forma
-3.0% appreciation · 6.09% rent growth · sell at horizon
- IRR
- -19.1%
- Equity multiple
- 0.32×
- Total profit
- $-54,552
- Equity at exit
- $42,494
- IRR
- -6.8%
- Equity multiple
- 0.51×
- Total profit
- $-38,786
- Equity at exit
- $24,642
Cash invested: $79,800 (down + closing). Projections, not guarantees.
Landlord ↔ Tenant lean methodology
- Overall (STATE)
- 81 Strongly Landlord-Friendly
- State Missouri
- 81 Strongly Landlord-Friendly · R+10
- County
- — inherits STATE
- City
- — inherits STATE
ZIP-level market 65203
- Rents YoY
- 6.1%
- Active inventory
- 459
- Price-to-rent
- 11.9×
Monthly cashflow live
- Estimated rent
- $1,992 high interval (Pro) →
- Mortgage (P&I)
- −$1,495
- Tax from tax record
- −$191 /mo · $2,288/yr
- Insurance
- −$119
- HOA
- −$0
- Vacancy / Maint / Mgmt
- −$418
- Net cashflow
- $-231
Break-even live
UW: 25.0% down · 7.5% · 30yr · 1.5% tax · 5.0% vac · 8.0% maint · 8.0% mgmt
Financing live
Cash to close
- Down payment
- $71,250
- Closing costs
- $8,550
- Reserves months
- —
- Total cash needed
- —
Loan-product check · same deal, 3 products live
Conventional
25% down · 7.5% · 30yr
- Down + closing
- —
- Monthly P&I
- —
- Monthly cashflow
- —
- DSCR
- —
- Eligible?
- —
Personal DTI + credit; lowest rate.
DSCR
20% down · 8.5% · 30yr
- Down + closing
- —
- Monthly P&I
- —
- Monthly cashflow
- —
- DSCR
- —
- Eligible?
- —
No personal income docs; deal must DSCR.
Hard money
10% down · 12.0% · 12mo
- Down + closing
- —
- Monthly P&I
- —
- Monthly cashflow
- —
- DSCR
- —
- Eligible?
- —
Short-term bridge; refi at stabilization.
Rent comps 19 comps
| Address | Beds | Baths | Sqft | Rent | $/sqft | DOM | Units | Dist |
|---|---|---|---|---|---|---|---|---|
| 800 Sycamore Ln Unit NA Columbia, MO | 3.0 | 2.0 | 1416 | $2,150 | $1.52 | 13d | 1 | 0.09mi |
| 3312 Belle Meade Dr Columbia, MO | 3.0 | 2.5 | 1508 | $1,675 | $1.11 | 44d | 1 | 0.17mi |
| 3006 Lynnwood Dr Columbia, MO | 5.0 | 3.0 | 2250 | $2,400 | $1.07 | 21d | 1 | 0.19mi |
| 1109 Club Village Dr Unit 1109-204 Columbia, MO | 3.0 | 2.0 | 1700 | $1,600 | $0.94 | 44d | 1 | 0.54mi |
| 2804 Melody Ln Columbia, MO | 3.0 | 2.5 | 1961 | $2,750 | $1.40 | 21d | 1 | 0.61mi |
| 109 Sieville Ave Columbia, MO | 3.0 | 2.0 | 1230 | $1,575 | $1.28 | 21d | 1 | 0.75mi |
| 315 Foxfire Dr Columbia, MO | 3.0 | 2.5 | 1522 | $1,800 | $1.18 | 44d | 1 | 0.96mi |
| 407 Foxfire Dr Columbia, MO | 4.0 | 3.5 | 1986 | $1,900 | $0.96 | 21d | 1 | 0.99mi |
| 437 Foxfire Dr Columbia, MO | 3.0 | 2.5 | 1424 | $1,550 | $1.09 | 13d | 1 | 1.03mi |
| 534 Southampton Dr Columbia, MO | 3.0 | 1.5 | 1250 | $1,900 | $1.52 | 44d | 1 | 1.06mi |
| 475 Foxfire Dr Columbia, MO | 4.0 | 3.0 | 1556 | $1,600 | $1.03 | 21d | 1 | 1.09mi |
| 4609 Brandon Woods St Columbia, MO | 3.0 | 2.0 | 1200 | $1,495 | $1.25 | 13d | 1 | 1.20mi |
| 157 Maple Grove Way Unit 157 Columbia, MO | 3.0 | 1.5 | 1082 | $1,200 | $1.11 | 21d | 1 | 1.27mi |
| 707 Boulder Dr Columbia, MO | 3.0 | 2.5 | 1647 | $2,200 | $1.34 | 44d | 1 | 1.31mi |
| 803 Ames Dr Columbia, MO | 3.0 | 2.0 | 1315 | $1,900 | $1.44 | 21d | 1 | 1.31mi |
| 1000 Cooper Dr N Columbia, MO | 2.0–3.0 | 1.0–2.5 | 1200 | $1,290 | $1.07 | 13d | 7 | 1.32mi |
| 1312 White Oak Ln Columbia, MO | 3.0 | 3.0 | 1512 | $1,725 | $1.14 | 13d | 3 | 1.37mi |
| 1409 Mills Dr Columbia, MO | 3.0 | 1.5 | 1416 | $1,800 | $1.27 | 13d | 1 | 1.46mi |
| 1207 White Oak Ln Columbia, MO | 5.0 | 2.0 | 1920 | $1,895 | $0.99 | 21d | 1 | 1.49mi |
Listing history 2 events
-
2026-05-10status Pending 744-char remark
-
2026-05-07$285,000 Active 744-char remark
ⓘ Source: listings_history table (triggers on properties + properties_extension) + one-shot
backfill from property_details.listing_events for pre-trigger history.
Tax reassessment forecast MO · Resets to sale price
- Current annual tax
- $2,288 · $191/mo
- Projected year-2 tax
- $2,764 · $230/mo
- Expected delta
- +$476/yr (+$40/mo · 20.8%)
ⓘ Screening estimate from a state-policy table — verify with the county assessor before closing.
Climate risk First Street
- Flood 1/10 Low FEMA zone X (unshaded) · 0% chance over 30 yrs
- Wildfire 2/10 Low
- Heat 4/10 Moderate 7 d/yr ≥107°F today · 19 d/yr by 30 yrs out
- Wind 2/10 Low
- Air quality 2/10 Low 1 unhealthy d/yr today · 1 by 30 yrs out
Nearby sold comps map
Loading sold comps map…
Walkable amenities ~0.75 mi
Loading nearby amenities…
Taxation est. · year 1
- Rental income
- $23,901
- − Mortgage interest
- −$15,964
- − Property taxes
- −$2,288
- − Insurance
- −$1,425
- − Repairs & maintenance
- −$1,912
- − Management
- −$1,912
- − Depreciation
- −$8,291
- Taxable loss
- −$7,892
- Est. tax savings @ 24.0%
- +$1,894
- After-tax cash flow
- $-872/yr
For passive investors: Depreciation is non-cash, so a rental often shows a tax loss while cash-flowing — sheltering income. Rental losses are passive: they offset passive income freely, and up to $25,000/yr can offset ordinary (W-2) income if you actively participate and your MAGI is under $100k (phasing out to $0 by $150k); unused losses carry forward. On sale, claimed depreciation is recaptured at up to 25%, and gains may owe capital-gains tax (a 1031 exchange can defer both). Figures are a year-1 estimate at your 24.0% rate — not tax advice; consult a CPA.
Schools (NCES district)
- District
- Columbia 93
- NCES district ID
- 2901000
- Math proficiency
- 30% ▼ -12.00%
- Reading proficiency
- 43% ▼ -4.00%
- Median HH income
- $46,547
- Composite
- 31.21/100
- National rank
- #6036
- State rank
- #194 of 324 in MO
Livability — Columbia
- Score
- 83/100
- State rank
- #9
- US rank
- #862
Category grades
Schools grade is shown separately in the Schools card above.
Census & demographics
- Census place
- Columbia, MO
- County
- Boone County · 158,877 people
- City population
- 158,877
- Metro
- Columbia, MO
- Population (ZIP)
- 61,539
- Household income
- $79,960
- Rent vs Own
- Severe rent burden
- 1991.0
Population outlook (Boone County) Hauer SSP2
- Today (2025)
- 202,891 people
- By 2030
- 217,799 · +7.3%
- By 2040
- 246,789 · +21.6%
- By 2050
- 276,116 · +36.1%
- By 2075
- 348,426 · +71.7%
- By 2100
- 400,856 · +97.6%
Race, ethnicity, and origin ACS 2023
- Neighborhood character
- Predominantly White (77%)
- Race & ethnicity
- White 77% Black 9% Asian 6% Two or more races 5% Hispanic / Latino 3%
- Common ancestry
- Italian 3% Slovak 2% Romanian 2%
- Foreign-born
- 7% · China, South Korea, Canada
- Languages at home
- 91% English-only · Chinese 2% Spanish 2% Korean 1%
Political lean MEDSL · Boone
- 2024 margin
- Lean D (+9.8) · D 53.9% · R 44.1% · Other 2.1%
- 2008→2024 swing
- -2.2pp toward R · 2008: 12.0pp · 2024: 9.8pp
- All cycles
- 2024: D+9.8 2020: D+12.5 2016: D+5.9 2012: D+3.1 2008: D+12.0
Not yet ingested
- Civics
- —
Market trends
- HPI YoY
- ▼ -274.18%
- Current HPI
- 194.3615
- Rent YoY
- ▲ 6.09%
- Metro
- Columbia, MO
- State GDP YoY
- ▲ 1.84%
- F500 in state
- 20
Industry mix (Fortune 500 HQ in MO)
| Industry | F500 HQs | Revenue |
|---|---|---|
| Healthcare | 1 | $163B |
|
||
| Insurance | 1 | $21B |
|
||
| Industrial Technology | 1 | $17B |
|
||
| Retail | 1 | $16B |
|
||
| Industrial Distribution | 1 | $10B |
|
||
| Utilities | 1 | $9B |
|
||
Price history
4 events — show timeline
- 2026-06-11 Delisted — CBORMLS
- 2026-06-10 Sold (MLS) — CBORMLS
- 2026-05-10 Pending — CBORMLS
- 2026-05-07 Listed $285,000 CBORMLS
Property tax history
+3.8%/yrLatest (2025): $2,288 · +11.2% YoY. Source: county tax records.
Cash-flow waterfall
monthlySold comps — $/sqft
last 12 mo · ≤1 miLoading sold comps…