19243 Cherrystone Way #103 · Lakewood Ranch, FL
Flood risk No data
- FEMA flood zone
- —
- Chance of flooding over 30 yrs
- —
- Est. flood insurance / yr
- —
Fire risk No data
- Est. fire insurance / yr
- —
Heat risk No data
- Hot days now (above threshold)
- —
- Hot days in 30 yrs
- —
Wind risk No data
- Chance of severe wind over 30 yrs
- —
Air-quality risk No data
- Unhealthy air days now
- —
- Unhealthy air days in 30 yrs
- —
Risk factors via First Street. Map © Google.
Why this score? — see what drove the D- grade
The composite is a weighted blend of 9 inputs, each scored 0–100. Each bar is that input's sub-score; the figure is the points it added to the 100-point composite (weight × sub-score).
- Cash flow +13.7/30.0
- ARV discount +5.7/15.0
- Schools +4.4/10.0
- DSCR +4.1/10.0
- Condition / age +4.0/5.0
- 1% rule +3.8/10.0
- Livability +2.5/5.0
- Rent growth +1.2/5.0
- Appreciation +0.0/10.0
$534,999
🖨 Deal sheet (PDF) 📄 Offer letter ✓ Due diligence
Listing remarks
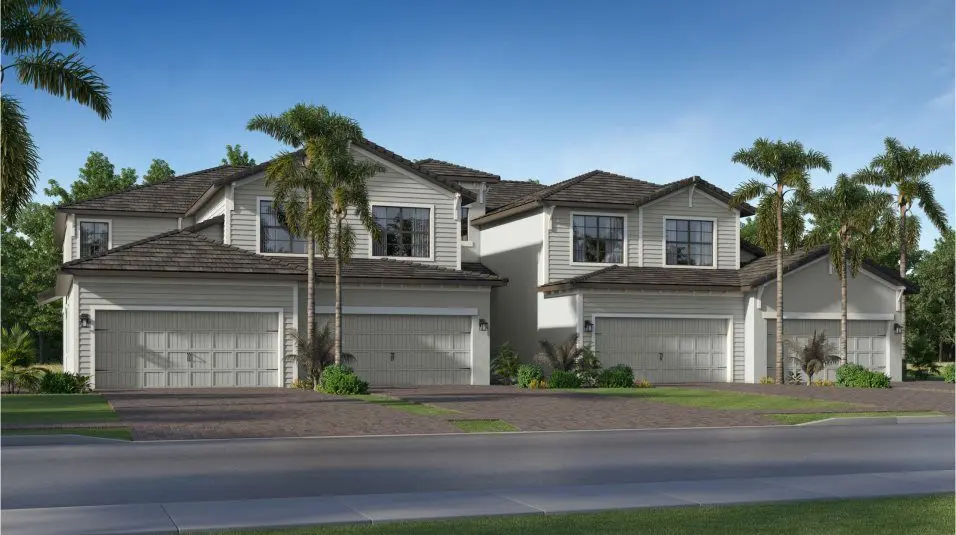
Golf membership included! This stunning 2,110-square-foot home features a spacious two-car garage on the lower level, providing ample storage and convenience. Upstairs, the open-concept design seamlessly connects the kitchen, dining, and living areas, all enhanced by a large lanai perfect for relaxing or entertaining. The kitchen shines with brand-new stainless steel appliances, quartz countertops including an oversized center island, and designer cabinetry with elegant hardware. The owner's suite offers private lanai access and two walk-in closets, while two additional bedrooms are thoughtfully positioned at the front of the home. Modern touches like LED recessed lighting, a smart thermost
Key facts
- 2 garage spots
- Built 2026
- Listed 45 days
Property features AI
Finance
- Other: List price $534,999; Address: 19243 Cherrystone Way #103, Bradenton, FL 34211; Listing last modified May 21, 2026
Exterior
- Parking: 2 total parking spaces; 2-car garage
- Home design: Condominium / attached unit; Active listing
- Exterior features: Living area approximately 2,110
Interior
- Bedrooms: 3 bedrooms
- Bathrooms: 2 bathrooms (full)
- Interior features: Spec home, Bay Creek plan
Neighborhood map
What this means for you Summary
Snapshot
- This is a 3-bed/2.0-bath townhouse listed at $535k. Condition is rated good.
Deal economics
- At list price, monthly cash flow is $36 ($436/yr) — positive.
- The deal already cash-flows at list — no discount required.
- To meet the 1% rule (rent ≥ 1% of price), the offer needs to be $473k (11.7% below list).
- Recommended offer: $473k (11.7% below list) — sets the bar for 1% rule.
- Cap rate 6.4% vs local median 3.3% in Lakewood Ranch — top-decile yield for the area; either an underpriced asset or a hidden risk that comps aren't pricing in. Stress-test before assuming the spread holds.
Location & tenants
- Location reads: area grade D — affects rentability + tenant quality, not the cash-flow math above.
- Manatee (suburban): math 54% / reading 50% proficiency, ranked #26 of 73 in FL (top 36%) — acceptable for families but not a draw, mixed tenant base, ~2y average lease.
- Zoned schools: B.D. Gullett Elementary School (math 78% / reading 73%, grade A, #211 of 2,144 statewide, top 10%, 1,121 students, 20% FRL); R. Dan Nolan Middle School (math 79% / reading 72%, grade A, #38 of 571 statewide, top 7%, 760 students, 28% FRL); Lakewood Ranch High School (math 47% / reading 63%, grade C, #135 of 667 statewide, top 20%, 2,435 students, 22% FRL) — zoned schools average 23% FRL vs 51% district-wide (27 pts lower); this property's tenant base skews higher-income than the district average.
- Zoned-school proficiency averages 69% at this address vs 52% district-wide (+17 pts) — the actual schools serving this property are materially stronger than the Manatee average implies; a family-tenant draw the district grade alone would hide.
- Market conditions: Rents falling (-5.2%/yr); 1164 active listings in the ZIP; 40 comparable units currently listed for rent nearby; rentals at typical pace (median 26d on market — plan ~3-4 weeks tenant-placement turnaround); high-income renter base; 7,472 units permitted in Manatee County in 2024 (1,782 in 5+ unit buildings).
- At $4,726/mo this rent would consume 47% of the median local household income ($120k/yr) (locally 815% of renters already pay >50% of income on rent) — very limited rent-growth headroom before tenants either downsize or default.
Forward outlook
- Local home prices are declining (-3.0%/yr); year-one equity from $4k of loan paydown is wiped out by about $16k of value loss. Plan a longer hold.
- Manatee County population projected at +43% by 2050 — long-run rental-demand tailwind backs the buy-and-hold thesis.
Negotiation context
- It's been on market 45 days — a 3% lower offer ($519k) is reasonable based on typical stale-listing flexibility.
Questions for the listing agent
- It's been on market 45 days. Have you received any prior offers? Is the seller open to a 12% concession, seller financing, or rate buy-down credit?
- Is there a deadline driving the sale (1031 exchange, divorce, estate, relocation)? That informs how much negotiation room exists.
- The area grade is low — what's the realistic commute time and amenity access for the typical tenant pool here? Any planned neighborhood developments (good or bad) we should know about?
- What's the average days-on-market for RENTAL listings here right now (not sales)? A rising rental-DOM trend means longer vacancies and softer asking-rent achievability than the comps imply.
- What's the recent tenant-quality profile in this submarket — average credit score on applications, eviction rate, late-payment / NSF rate, and stable-employment percentage? A property-management company in the area should have these aggregated.
- How much new for-sale + rental construction is in the pipeline within 1–3 miles? Heavy new supply typically softens prices + rents 12–24 months out; constrained supply supports both.
Investment metrics
- 1% rule
- 0.88% ✗
- Cap rate
- 6.37%
- Cash-on-cash
- 0.29%
- DSCR
- 1.01
- GRM
- 9.4
CMA / ARV
- ARV (on-the-fly)
- $514,840
- Comps found
- 5
Show comp detail 5 sales within ~0.75 mi
| Address | Dist | Beds/Ba | Sqft | Sold | Price | $/sf | Match |
|---|---|---|---|---|---|---|---|
| 19222 Cherrystone Way #102 | 0.00mi | 3/2.0 | 2,110 (0%) | 1mo | $515,000 | $244 | 99 |
| 19214 Cherrystone Way #103 | 0.00mi | 3/2.0 | 2,110 (0%) | 3mo | $514,998 | $244 | 97 |
| 19219 Cherrystone #102 | 0.01mi | 3/2.0 | 2,110 (0%) | 4mo | $475,000 | $225 | 96 |
| 19209 Cherrystone Way #103 | 0.67mi | 3/2.0 | 2,110 (0%) | 4mo | $440,000 | $209 | 66 |
| 19214 Cherrystone Way #102 | 0.67mi | 3/2.0 | 2,110 (0%) | 4mo | $525,498 | $249 | 65 |
Match score weights: distance 35% · size 25% · config 20% · recency 20%. Top-matched comps best support the ARV.
Projected returns pro-forma
-3.0% appreciation · 0.0% rent growth · sell at horizon
- IRR
- -19.3%
- Equity multiple
- 0.34×
- Total profit
- $-98,159
- Equity at exit
- $79,770
- IRR
- -19.8%
- Equity multiple
- 0.09×
- Total profit
- $-135,733
- Equity at exit
- $46,257
Cash invested: $149,800 (down + closing). Projections, not guarantees.
Landlord ↔ Tenant lean methodology
- Overall (STATE)
- 87 Strongly Landlord-Friendly
- State Florida
- 87 Strongly Landlord-Friendly · R+3
- County
- — inherits STATE
- City
- — inherits STATE
ZIP-level market 34211
- Home prices YoY
- -27.5%
- Rents YoY
- -5.2%
- Active inventory
- 1164
- Price-to-rent
- 9.4×
Monthly cashflow live
- Estimated rent
- $4,726 high interval (Pro) →
- Mortgage (P&I)
- −$2,806
- Tax est. 1.5%
- −$669 /mo · $8,025/yr
- Insurance
- −$223
- HOA
- −$0
- Vacancy / Maint / Mgmt
- −$992
- Net cashflow
- $36
Break-even live
Sensitivity live
| Price | -10% $406 | -5% $221 | +0% $36 | +5% $-149 | +10% $-333 |
|---|---|---|---|---|---|
| Rent | -10% $-337 | -5% $-150 | +0% $36 | +5% $223 | +10% $410 |
| Rate | -1.0pp $306 | -0.5pp $172 | base $36 | +0.5pp $-102 | +1.0pp $-243 |
UW: 25.0% down · 7.5% · 30yr · 1.5% tax · 5.0% vac · 8.0% maint · 8.0% mgmt
Financing live
Cash to close
- Down payment
- $133,750
- Closing costs
- $16,050
- Reserves months
- —
- Total cash needed
- —
Loan-product check · same deal, 3 products live
Conventional
25% down · 7.5% · 30yr
- Down + closing
- —
- Monthly P&I
- —
- Monthly cashflow
- —
- DSCR
- —
- Eligible?
- —
Personal DTI + credit; lowest rate.
DSCR
20% down · 8.5% · 30yr
- Down + closing
- —
- Monthly P&I
- —
- Monthly cashflow
- —
- DSCR
- —
- Eligible?
- —
No personal income docs; deal must DSCR.
Hard money
10% down · 12.0% · 12mo
- Down + closing
- —
- Monthly P&I
- —
- Monthly cashflow
- —
- DSCR
- —
- Eligible?
- —
Short-term bridge; refi at stabilization.
Rent comps 40 comps
| Address | Beds | Baths | Sqft | Rent | $/sqft | DOM | Units | Dist |
|---|---|---|---|---|---|---|---|---|
| 19168 Cherrystone Way Bradenton, FL | 2.0 | 2.0 | 2061 | $4,500 | $2.18 | 25d | 1 | 0.02mi |
| 19023 Cherrystone Way Bradenton, FL | 3.0 | 2.0 | 2246 | $5,500 | $2.45 | 5d | 1 | 0.02mi |
| 19156 Cherrystone Way Bradenton, FL | 3.0 | 3.0 | 2247 | $5,000 | $2.23 | 25d | 1 | 0.02mi |
| 18731 Cherrystone Way Bradenton, FL | 3.0 | 3.0 | 2799 | $8,000 | $2.86 | 25d | 1 | 0.11mi |
| 19015 Scallop Loop Unit 7118 Lakewood Ranch, FL | 2.0 | 2.0 | 1569 | $6,000 | $3.82 | 25d | 1 | 0.37mi |
| 19111 Fox Landing Pl Bradenton, FL | 3.0 | 3.5 | 2808 | $3,900 | $1.39 | 25d | 1 | 0.49mi |
| 5612 Lightning Whelk Ln Bradenton, FL | 3.0 | 3.0 | 2444 | $12,500 | $5.11 | 25d | 1 | 0.59mi |
| 5522 Lightning Whelk Ln Bradenton, FL | 4.0 | 3.0 | 2725 | $5,800 | $2.13 | 25d | 1 | 0.59mi |
| 5420 Lightning Whelk Ln Bradenton, FL | 3.0 | 3.0 | 2445 | $6,000 | $2.45 | 25d | 1 | 0.59mi |
| 5628 Lightning Whelk Ln Bradenton, FL | 4.0 | 3.0 | 2252 | $4,595 | $2.04 | 5d | 1 | 0.59mi |
| 18121 Metado Dr Bradenton, FL | 4.0 | 3.0 | 1827 | $2,900 | $1.59 | 25d | 1 | 0.63mi |
| 5623 Mulligan Way Bradenton, FL | 3.0 | 2.5 | 2359 | $14,000 | $5.93 | 25d | 1 | 0.73mi |
| 18002 Canopy Pl Bradenton, FL | 4.0 | 3.0 | 2371 | $3,000 | $1.27 | 5d | 1 | 0.77mi |
| 17915 Cantarina Cv Bradenton, FL | 4.0 | 2.5 | 2045 | $2,999 | $1.47 | 25d | 1 | 0.80mi |
| 17535 Cantarina Cv Bradenton, FL | 4.0 | 3.5 | 2838 | $5,495 | $1.94 | 13d | 1 | 0.87mi |
| 17535 Cantarina Cv Bradenton, FL | 4.0 | 3.5 | 2838 | $5,495 | $1.94 | 25d | 1 | 0.87mi |
| 17929 Cherished Loop Bradenton, FL | 2.0 | 2.0 | 1432 | $3,000 | $2.09 | 5d | 1 | 0.99mi |
| 17605 Cantarina Cv Bradenton, FL | 4.0 | 2.5 | 2045 | $3,500 | $1.71 | 25d | 1 | 1.01mi |
| 5720 Cheech Gln Bradenton, FL | 3.0 | 2.0 | 2246 | $5,500 | $2.45 | 25d | 1 | 1.03mi |
| 5725 Cheech Gln Bradenton, FL | 3.0 | 2.5 | 1850 | $12,000 | $6.49 | 25d | 1 | 1.03mi |
| 17903 Cherished Loop Bradenton, FL | 2.0 | 2.0 | 1672 | $2,800 | $1.67 | 25d | 1 | 1.03mi |
| 17918 Cherished Loop Bradenton, FL | 2.0 | 2.0 | 1452 | $3,000 | $2.07 | 25d | 1 | 1.03mi |
| 5711 Palmer Cir #206 Bradenton, FL | 2.0 | 2.0 | 1462 | $3,000 | $2.05 | 25d | 1 | 1.04mi |
| 17710 Cantarina Cv Bradenton, FL | 4.0 | 3.0 | 2756 | $3,500 | $1.27 | 25d | 1 | 1.05mi |
| 17525 Hickok Belt Loop Bradenton, FL | 4.0 | 3.0 | 2250 | $7,800 | $3.47 | 25d | 1 | 1.05mi |
| 5721 Palmer Cir Bradenton, FL | 2.0 | 2.0 | 1452 | $3,250 | $2.24 | 25d | 2 | 1.07mi |
| 5710 Palmer Cir #201 Bradenton, FL | 2.0 | 2.0 | 1462 | $4,500 | $3.08 | 25d | 1 | 1.10mi |
| 17467 Hickok Belt Loop Bradenton, FL | 4.0 | 3.0 | 2247 | $12,500 | $5.56 | 25d | 1 | 1.11mi |
| 17419 Harvest Moon Way Bradenton, FL | 4.0 | 2.0 | 2045 | $2,595 | $1.27 | 17d | 1 | 1.21mi |
| 17220 Harvest Moon Way Bradenton, FL | 4.0 | 2.0 | 1828 | $2,800 | $1.53 | 25d | 1 | 1.25mi |
| 5907 Brandon Run Bradenton, FL | 4.0 | 2.0 | 2246 | $6,800 | $3.03 | 25d | 1 | 1.25mi |
| 5558 Palmer Cir #106 Bradenton, FL | 2.0 | 2.0 | 1462 | $6,000 | $4.10 | 25d | 1 | 1.27mi |
| 5577 Palmer Cir #201 Bradenton, FL | 2.0 | 2.0 | 1569 | $2,300 | $1.47 | 25d | 1 | 1.29mi |
| 5947 Brandon Run Bradenton, FL | 3.0 | 2.0 | 2200 | $13,000 | $5.91 | 25d | 1 | 1.31mi |
| 18117 Gawthrop Dr #104 Bradenton, FL | 3.0 | 2.0 | 1786 | $4,000 | $2.24 | 25d | 1 | 1.35mi |
| 5537 Palmer Cir #201 Bradenton, FL | 2.0 | 2.0 | 1569 | $3,200 | $2.04 | 25d | 1 | 1.38mi |
| 18017 Gawthrop Dr #104 Bradenton, FL | 3.0 | 2.0 | 1786 | $6,000 | $3.36 | 25d | 1 | 1.39mi |
| 6026 Brandon Run Bradenton, FL | 3.0 | 2.0 | 2246 | $12,000 | $5.34 | 25d | 1 | 1.41mi |
| 18114 Gawthrop Dr Bradenton, FL | 2.0–3.0 | 2.0 | 1300 | $7,000 | $5.38 | 25d | 5 | 1.41mi |
| 18114 Gawthrop Dr Bradenton, FL | 2.0–3.0 | 2.0 | 1310 | $7,000 | $5.34 | 3d | 3 | 1.41mi |
Listing history 16 events
-
2026-06-22days on market $534,999 Active 45 DOM
-
2026-06-18days on market $534,999 Active 42 DOM
-
2026-06-17days on market $534,999 Active 41 DOM
-
2026-06-16days on market $534,999 Active 40 DOM
-
2026-06-15days on market $534,999 Active 39 DOM
-
2026-06-13days on market $534,999 Active 37 DOM
-
2026-06-13remarks 699-char remark
-
2026-06-13days on market $534,999 Active 36 DOM
-
2026-06-10days on market $534,999 Active 34 DOM
-
2026-06-09days on market $534,999 Active 33 DOM
-
2026-06-08days on market $534,999 Active 32 DOM
-
2026-06-08days on market $534,999 Active 31 DOM
-
2026-06-03days on market $534,999 Active 27 DOM
-
2026-06-02days on market $534,999 Active 26 DOM
-
2026-06-01days on market $534,999 Active 25 DOM
-
2026-05-31days on market $534,999 Active 24 DOM
ⓘ Source: listings_history table (triggers on properties + properties_extension) + one-shot
backfill from property_details.listing_events for pre-trigger history.
Nearby sold comps map
Loading sold comps map…
Walkable amenities ~0.75 mi
Loading nearby amenities…
Taxation est. · year 1
- Rental income
- $56,712
- − Mortgage interest
- −$29,968
- − Property taxes
- −$8,025
- − Insurance
- −$2,675
- − Repairs & maintenance
- −$4,537
- − Management
- −$4,537
- − Depreciation
- −$15,564
- Taxable loss
- −$8,593
- Est. tax savings @ 24.0%
- +$2,062
- After-tax cash flow
- $2,498/yr
For passive investors: Depreciation is non-cash, so a rental often shows a tax loss while cash-flowing — sheltering income. Rental losses are passive: they offset passive income freely, and up to $25,000/yr can offset ordinary (W-2) income if you actively participate and your MAGI is under $100k (phasing out to $0 by $150k); unused losses carry forward. On sale, claimed depreciation is recaptured at up to 25%, and gains may owe capital-gains tax (a 1031 exchange can defer both). Figures are a year-1 estimate at your 24.0% rate — not tax advice; consult a CPA.
Condition & rehab AI · 12 photos
This spacious townhouse is in good condition with modern amenities and a clean, well-maintained appearance. It offers a good return on investment with minor updates that can significantly enhance its value.
Value-add opportunities
- Both Painting the exterior and interior walls — Fresh paint can enhance curb appeal and interior aesthetics.
- Both Updating the flooring in the bedrooms — New flooring can improve the look and feel of the bedrooms.
- Both Upgrading the kitchen appliances — Modern appliances can increase the home's appeal and functionality.
- Both Adding smart home features — Smart home features can enhance convenience and energy efficiency, attracting more buyers/renters.
- Both Landscaping improvements — Enhanced landscaping can increase curb appeal and attract more buyers/renters.
- Both Adding a smart thermostat — A smart thermostat can improve energy efficiency and comfort, attracting more buyers/renters.
Renovation cost estimate screening
Value-add ROI direction
- Both Painting the exterior and interior walls — Fresh paint can enhance curb appeal and interior aesthetics. ↑
- Both Updating the flooring in the bedrooms — New flooring can improve the look and feel of the bedrooms. ↑
- Both Upgrading the kitchen appliances — Modern appliances can increase the home's appeal and functionality. ↑
- Both Adding smart home features — Smart home features can enhance convenience and energy efficiency, attracting more buyers/renters. ↑
- Both Landscaping improvements — Enhanced landscaping can increase curb appeal and attract more buyers/renters. ↑
- Both Adding a smart thermostat — A smart thermostat can improve energy efficiency and comfort, attracting more buyers/renters. ↑
ⓘ Cost ranges are severity-bucket heuristics (US national rule-of-thumb). Get contractor quotes + a written scope before underwriting a rehab budget.
Schools (NCES district)
- District
- Manatee
- NCES district ID
- 1201230
- Math proficiency
- 54% ▼ -6.00%
- Reading proficiency
- 50% ▼ -2.00%
- Median HH income
- $49,607
- Composite
- 44.43/100
- National rank
- #2806
- State rank
- #26 of 73 in FL
Livability — Lakewood Ranch
No livability data for this city. (Only ~50 U.S. cities are tracked.)
Census & demographics
- County
- Manatee County · 416,364 people
- City population
- 52,177
- Metro
- North Port-Sarasota-Bradenton, FL
- Population (ZIP)
- 24,980
- Household income
- $119,911
- Rent vs Own
- Severe rent burden
- 815.0
Population outlook (Manatee County) Hauer SSP2
- Today (2025)
- 447,342 people
- By 2030
- 488,911 · +9.3%
- By 2040
- 567,934 · +27.0%
- By 2050
- 637,995 · +42.6%
- By 2075
- 781,970 · +74.8%
- By 2100
- 848,272 · +89.6%
Race, ethnicity, and origin ACS 2023
- Neighborhood character
- Predominantly White (81%)
- Race & ethnicity
- White 81% Hispanic / Latino 11% Two or more races 10% Asian 3% Black 2% Native American 2%
- Hispanic origin (detail)
- Mexican 2% Puerto Rican 3% Cuban 3%
- Common ancestry
- Lithuanian 5% Romanian 3% Scotch-Irish 2%
- Foreign-born
- 16% · Canada, Jamaica, China
- Languages at home
- 81% English-only · Spanish 10% Other Indo-European 3% Russian/Polish/Slavic 2%
Political lean MEDSL · Manatee
- 2024 margin
- Strong R (+23.5) · D 37.9% · R 61.4%
- 2008→2024 swing
- -16.5pp toward R · 2008: -7.0pp · 2024: -23.5pp
- All cycles
- 2024: R+23.5 2020: R+16.1 2016: R+17.1 2012: R+12.5 2008: R+7.0
Not yet ingested
- Civics
- —
Market trends
- HPI YoY
- ▼ -100.84%
- Current HPI
- 265.946
- Rent YoY
- ▼ -5.17%
- Metro
- North Port-Sarasota-Bradenton, FL
- State GDP YoY
- ▲ 3.28%
- F500 in state
- 36
Industry mix (Fortune 500 HQ in FL)
| Industry | F500 HQs | Revenue |
|---|---|---|
| Industrial Technology | 2 | $29B |
|
||
| Insurance | 2 | $17B |
|
||
| Retail | 1 | $60B |
|
||
| Technology Distribution | 1 | $58B |
|
||
| Homebuilding | 1 | $35B |
|
||
| Technology Manufacturing | 1 | $35B |
|
||
Cash-flow waterfall
monthlySold comps — $/sqft
last 12 mo · ≤1 miLoading sold comps…