2935 Lorena Jordan Rd · Dallas, TX
Flood risk No data
- FEMA flood zone
- —
- Chance of flooding over 30 yrs
- —
- Est. flood insurance / yr
- —
Fire risk No data
- Est. fire insurance / yr
- —
Heat risk No data
- Hot days now (above threshold)
- —
- Hot days in 30 yrs
- —
Wind risk No data
- Chance of severe wind over 30 yrs
- —
Air-quality risk No data
- Unhealthy air days now
- —
- Unhealthy air days in 30 yrs
- —
Risk factors via First Street. Map © Google.
Why this score? — see what drove the D+ grade
The composite is a weighted blend of 9 inputs, each scored 0–100. Each bar is that input's sub-score; the figure is the points it added to the 100-point composite (weight × sub-score).
- ARV discount +12.3/15.0
- Appreciation +10.0/10.0
- Cash flow +7.3/30.0
- Livability +4.0/5.0
- Condition / age +4.0/5.0
- 1% rule +2.9/10.0
- Schools +2.8/10.0
- DSCR +1.5/10.0
- Rent growth +1.4/5.0
$364,900
🖨 Deal sheet (PDF) 📄 Offer letter ✓ Due diligence
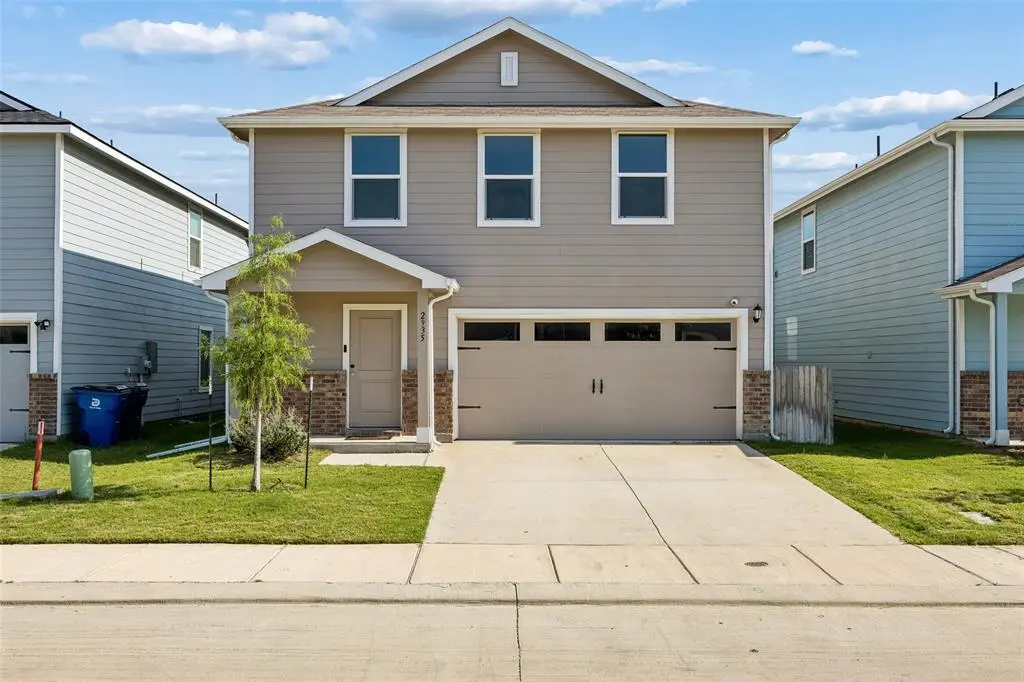
Listing remarks
Must See, Gorgeous 4-Bedrooms, 2.5 bathrooms, 2-story home, 2-Car Garage. Fresh Paint, new Carpet. Ready to move in. Great Location, close to Downtown Dallas, Schools, Major Shopping Centers & major Highways.
Key facts
- Fresh paint
- New carpet
- Great location
Tags
Property features AI
Finance
- HOA & community: Mandatory HOA; HOA managed by 4Site; HOA covers management fees; Annual HOA fee
Exterior
- Parking: Attached garage; 2 covered/garage parking spaces; Garage approximately 19 ft wide by 19 ft long
- Utilities: City water; City sewer; Not in a municipal utility district
- Home design: Single family residence; Two-story home; New construction (built in 2024)
- Construction: Built in 2024
- Exterior features: Back yard with wood fencing; Fenced yard; Grassed vegetation; Clay soil
Interior
- Kitchen: Dishwasher; Electric range; Granite counters; Pantry
- Bedrooms: 4 bedrooms (primary bedroom on second level)
- Bathrooms: 2 full bathrooms; 1 half bathroom
- Heating & cooling: Central heating (natural gas); Central electric air conditioning
- Interior features: Granite counters; Pantry; Two living areas; One dining area; 10 total rooms
- Laundry & utility: Electric water heater; Other included appliances
Neighborhood map
What this means for you Summary
Snapshot
- This is a 4-bed/2.5-bath single-family listed at $365k. Condition is rated good.
Deal economics
- At list price, monthly cash flow is $-482 ($-6k/yr) — negative.
- To cash-flow at today's rent, offer at most $280k (23.3% below list).
- To meet the 1% rule (rent ≥ 1% of price), the offer needs to be $288k (21.1% below list).
- Recommended offer: $280k (23.3% below list) — sets the bar for cash-flow.
- Cap rate 4.7% vs local median 2.3% in Dallas — top-decile yield for the area; either an underpriced asset or a hidden risk that comps aren't pricing in. Stress-test before assuming the spread holds.
Location & tenants
- Location reads 81/100 on livability (#24 in TX, #1,380 nationally) — a professional / high-income tenant draw. Strengths: amenities A+, commute A+, housing A+; Watch: crime F.
- Dallas ISD (urban): math 31% / reading 36% proficiency, ranked #559 of 826 in TX (top 68%) — families likely to look elsewhere, expect single-tenant / working-renter base with shorter leases; 83% free/reduced lunch — lower-income household profile, screen leases tightly.
- Zoned schools: Eladio R Martinez Learning Center (math 25% / reading 21%, grade F, #3,277 of 4,322 statewide, top 77%, 536 students, 97% FRL).
- Market conditions: Rents falling (-4.2%/yr); 249 active listings in the ZIP; 30 comparable units currently listed for rent nearby; rentals at typical pace (median 25d on market — plan ~3-4 weeks tenant-placement turnaround); 40% of comp listings sitting > 30 days — soft ceiling on asking rent; 12,577 units permitted in Dallas County in 2024 (6,829 in 5+ unit buildings).
- At $2,878/mo this rent would consume 58% of the median local household income ($60k/yr) (locally 892% of renters already pay >50% of income on rent) — very limited rent-growth headroom before tenants either downsize or default.
Forward outlook
- In year one you build about $39k of equity ($3k loan paydown + $36k appreciation (10.0% local appreciation)).
- Dallas County population projected at +35% by 2050 — long-run rental-demand tailwind backs the buy-and-hold thesis.
- By year 2, paydown + projected appreciation supports a ~$63k cash-out refi (75% LTV) — recoverable capital for the next deal without selling this one.
Negotiation context
- Only 12 days on market — expect competitive offers; lowballing is unlikely to land.
Questions for the listing agent
- What do current leases actually rent for vs. the listed asking? Can we see a recent rent roll and the last 12 months of T-12 income?
- What does the HOA fee cover, when was the last increase, and are there any pending special assessments or reserve-fund shortfalls?
- Is there a deadline driving the sale (1031 exchange, divorce, estate, relocation)? That informs how much negotiation room exists.
- Crime grade is F in this area — have there been break-ins, vandalism, or insurance claims at this property in the last 3 years? What carrier currently insures it and at what premium?
- The area grade is low — what's the realistic commute time and amenity access for the typical tenant pool here? Any planned neighborhood developments (good or bad) we should know about?
- What's the average days-on-market for RENTAL listings here right now (not sales)? A rising rental-DOM trend means longer vacancies and softer asking-rent achievability than the comps imply.
- What's the recent tenant-quality profile in this submarket — average credit score on applications, eviction rate, late-payment / NSF rate, and stable-employment percentage? A property-management company in the area should have these aggregated.
- How much new for-sale + rental construction is in the pipeline within 1–3 miles? Heavy new supply typically softens prices + rents 12–24 months out; constrained supply supports both.
Investment metrics
- 1% rule
- 0.79% ✗
- Cap rate
- 4.71%
- Cash-on-cash
- -5.66%
- DSCR
- 0.75
- GRM
- 10.6
CMA / ARV
- ARV (on-the-fly)
- $408,000
- Comps found
- 12
Show comp detail 12 sales within ~0.75 mi
| Address | Dist | Beds/Ba | Sqft | Sold | Price | $/sf | Match |
|---|---|---|---|---|---|---|---|
| 3321 Normandy Brook Rd | 0.10mi | 4/2.5 | 2,000 (0%) | 14mo | $359,900 | $180 | 84 |
| 3395 Peyton Lila Rd | 0.08mi | 4/2.5 | 1,739 (-13%) | 5mo | $335,000 | $193 | 70 |
| 3179 Normandy Brook Rd | 0.20mi | 4/2.5 | 1,800 (-10%) | 15mo | $350,000 | $194 | 62 |
| 3911 Aransas St | 0.60mi | 4/2.0 | 1,954 (-2%) | 8mo | $409,800 | $210 | 60 |
| 3423 Toronto St | 0.51mi | 4/2.0 | 1,964 (-2%) | 15mo | $399,999 | $204 | 59 |
| 3907 Aransas St | 0.60mi | 4/2.0 | 1,954 (-2%) | 12mo | $409,800 | $210 | 56 |
| 3925 Furey St | 0.72mi | 4/2.5 | 2,032 (+2%) | 10mo | $455,000 | $224 | 55 |
| 2436 Tan Oak Dr | 0.70mi | 3/2.0 (-1) | 2,031 (+2%) | 14mo | $300,000 | $148 | 46 |
| 3531 Gallagher St | 0.60mi | 4/2.5 | 2,294 (+15%) | 9mo | $419,000 | $183 | 40 |
| 4110 Aransas St | 0.72mi | 4/3.5 | 2,154 (+8%) | 13mo | $505,000 | $234 | 39 |
| 3639 Pueblo St | 0.72mi | 3/2.5 (-1) | 1,765 (-12%) | 4mo | $425,000 | $241 | 38 |
| 4014 Aransas St | 0.65mi | 4/3.0 | 2,224 (+11%) | 13mo | $430,000 | $193 | 38 |
Match score weights: distance 35% · size 25% · config 20% · recency 20%. Top-matched comps best support the ARV.
Projected returns pro-forma
10.0% appreciation · 0.0% rent growth · sell at horizon
- IRR
- 19.4%
- Equity multiple
- 2.56×
- Total profit
- $159,811
- Equity at exit
- $328,731
- IRR
- 17.2%
- Equity multiple
- 5.70×
- Total profit
- $480,009
- Equity at exit
- $708,920
Cash invested: $102,172 (down + closing). Projections, not guarantees.
Landlord ↔ Tenant lean methodology
- Overall (STATE)
- 87 Strongly Landlord-Friendly
- State Texas
- 87 Strongly Landlord-Friendly · R+5
- County
- — inherits STATE
- City
- — inherits STATE
ZIP-level market 75212
- Rents YoY
- -4.2%
- Active inventory
- 249
- Price-to-rent
- 10.6×
Monthly cashflow live
- Estimated rent
- $2,878 high interval (Pro) →
- Mortgage (P&I)
- −$1,914
- Tax from tax record
- −$657 /mo · $7,881/yr
- Insurance
- −$152
- HOA
- −$33
- Vacancy / Maint / Mgmt
- −$604
- Net cashflow
- $-482
Break-even live
Sensitivity live
| Price | -10% $-275 | -5% $-378 | +0% $-482 | +5% $-585 | +10% $-688 |
|---|---|---|---|---|---|
| Rent | -10% $-709 | -5% $-595 | +0% $-482 | +5% $-368 | +10% $-254 |
| Rate | -1.0pp $-298 | -0.5pp $-389 | base $-482 | +0.5pp $-576 | +1.0pp $-672 |
UW: 25.0% down · 7.5% · 30yr · 1.5% tax · 5.0% vac · 8.0% maint · 8.0% mgmt
Financing live
Cash to close
- Down payment
- $91,225
- Closing costs
- $10,947
- Reserves months
- —
- Total cash needed
- —
Loan-product check · same deal, 3 products live
Conventional
25% down · 7.5% · 30yr
- Down + closing
- —
- Monthly P&I
- —
- Monthly cashflow
- —
- DSCR
- —
- Eligible?
- —
Personal DTI + credit; lowest rate.
DSCR
20% down · 8.5% · 30yr
- Down + closing
- —
- Monthly P&I
- —
- Monthly cashflow
- —
- DSCR
- —
- Eligible?
- —
No personal income docs; deal must DSCR.
Hard money
10% down · 12.0% · 12mo
- Down + closing
- —
- Monthly P&I
- —
- Monthly cashflow
- —
- DSCR
- —
- Eligible?
- —
Short-term bridge; refi at stabilization.
Rent comps 30 comps
| Address | Beds | Baths | Sqft | Rent | $/sqft | DOM | Units | Dist |
|---|---|---|---|---|---|---|---|---|
| 3386 Peyton Lila Rd Dallas, TX | 4.0 | 2.5 | 1739 | $2,350 | $1.35 | 44d | 1 | 0.08mi |
| 3232 Peyton Lila Rd Dallas, TX | 4.0 | 2.5 | 2000 | $2,495 | $1.25 | 8d | 1 | 0.17mi |
| 3421 Nomas St Dallas, TX | 5.0 | 3.0 | 2375 | $8,250 | $3.47 | 22d | 1 | 0.48mi |
| 4022 Cedar Elm Ln Dallas, TX | 4.0 | 2.5 | 2860 | $2,700 | $0.94 | 25d | 1 | 0.61mi |
| 3618 McBroom St Dallas, TX | 5.0 | 2.5 | 2449 | $8,700 | $3.55 | 2d | 1 | 0.71mi |
| 2322 Tan Oak Dr Dallas, TX | 3.0 | 2.5 | 1630 | $2,500 | $1.53 | 44d | 1 | 0.72mi |
| 2043 Life Ave Dallas, TX | 3.0 | 3.0 | 2545 | $3,950 | $1.55 | 0d | 1 | 0.77mi |
| 4022 Ivanhoe Ln Dallas, TX | 4.0 | 2.5 | 2042 | $2,795 | $1.37 | 44d | 1 | 0.98mi |
| 1916 Shaw St Dallas, TX | 4.0 | 3.0 | 2283 | $2,675 | $1.17 | 20d | 1 | 1.02mi |
| 2815 Harston St Unit 2815 Dallas, TX | 3.0 | 2.5 | 2800 | $3,800 | $1.36 | 11d | 1 | 1.07mi |
| 2811 Harston St Dallas, TX | 3.0 | 2.0 | 1937 | $2,950 | $1.52 | 44d | 1 | 1.08mi |
| 1723 Shaw St Dallas, TX | 4.0 | 3.0 | 1720 | $2,699 | $1.57 | 8d | 1 | 1.22mi |
| 3807 Vilbig Rd Dallas, TX | 3.0 | 2.5 | 2000 | $5,500 | $2.75 | 44d | 1 | 1.23mi |
| 3226 Navaro St Dallas, TX | 3.0 | 2.0 | 1547 | $2,500 | $1.62 | 44d | 1 | 1.28mi |
| 3237 Chihuahua Ave Dallas, TX | 4.0 | 2.5 | 2251 | $4,500 | $2.00 | 44d | 1 | 1.29mi |
| 3500 W Colorado Blvd Dallas, TX | 1.0–3.0 | 1.0–2.0 | 1107 | $2,798 | $2.53 | 4d | 24 | 1.29mi |
| 1849 Pollard St Dallas, TX | 4.0 | 4.5 | 2438 | $3,995 | $1.64 | 44d | 1 | 1.30mi |
| 4128 Mart St Dallas, TX | 3.0 | 2.5 | 1754 | $2,800 | $1.60 | 25d | 1 | 1.30mi |
| 3105 Chihuahua Ave Dallas, TX | 4.0 | 2.5 | 2214 | $3,200 | $1.45 | 16d | 1 | 1.31mi |
| 1610 Life Ave Dallas, TX | 3.0 | 2.5 | 1657 | $2,800 | $1.69 | 44d | 1 | 1.31mi |
| 3122 Chihuahua Ave Unit 1510240P Dallas, TX | 4.0 | 3.0 | 2174 | $5,369 | $2.47 | 0d | 1 | 1.33mi |
| 3321 Rutz St Dallas, TX | 3.0 | 2.5 | 1436 | $2,550 | $1.78 | 4d | 1 | 1.33mi |
| 3129 Rutz St Dallas, TX | 4.0 | 2.5 | 2102 | $7,850 | $3.73 | 44d | 1 | 1.34mi |
| 3129 Rutz St Unit 1241909P Dallas, TX | 4.0 | 2.5 | 2098 | $9,353 | $4.46 | 22d | 1 | 1.34mi |
| 3525 Rutz St Dallas, TX | 3.0 | 2.5 | 2451 | $4,000 | $1.63 | 8d | 1 | 1.34mi |
| 4120 Tram Dr Unit 1019501P Dallas, TX | 5.0 | 2.5 | 2475 | $7,484 | $3.02 | 44d | 1 | 1.40mi |
| 4124 Tram Dr Dallas, TX | 5.0 | 2.5 | 2478 | $8,250 | $3.33 | 22d | 1 | 1.40mi |
| 3517 Chicago St Dallas, TX | 3.0 | 3.0 | 1538 | $1,200 | $0.78 | 6d | 1 | 1.45mi |
| 2635 Carmelita St Dallas, TX | 3.0 | 3.5 | 2237 | $3,399 | $1.52 | 25d | 1 | 1.46mi |
| 2654 Carolwood Ln Dallas, TX | 3.0 | 3.5 | 2174 | $3,500 | $1.61 | 44d | 1 | 1.49mi |
HOA detail
- Monthly dues
- $33 · $396/yr
Listing history 9 events
-
2026-06-18days on market $364,900 Active 12 DOM
-
2026-06-17days on market $364,900 Active 11 DOM
-
2026-06-16days on market $364,900 Active 10 DOM
-
2026-06-15days on market $364,900 Active 9 DOM
-
2026-06-13days on market $364,900 Active 7 DOM
-
2026-06-09days on market $364,900 Active 3 DOM
-
2026-06-08days on market $364,900 Active 2 DOM
-
2026-06-07remarks 210-char remark
-
2026-06-07$364,900 Active 1 DOM
ⓘ Source: listings_history table (triggers on properties + properties_extension) + one-shot
backfill from property_details.listing_events for pre-trigger history.
Tax reassessment forecast TX · Resets to sale price
- Current annual tax
- $7,881 · $657/mo
- Projected year-2 tax
- $7,881 · $657/mo
- Expected delta
- $0/yr ($0/mo · 0.0%)
ⓘ Screening estimate from a state-policy table — verify with the county assessor before closing.
Nearby sold comps map
Loading sold comps map…
Walkable amenities ~0.75 mi
Loading nearby amenities…
Taxation est. · year 1
- Rental income
- $34,538
- − Mortgage interest
- −$20,440
- − Property taxes
- −$7,881
- − Insurance
- −$1,824
- − Repairs & maintenance
- −$2,763
- − Management
- −$2,763
- − HOA
- −$396
- − Depreciation
- −$10,615
- Taxable loss
- −$12,145
- Est. tax savings @ 24.0%
- +$2,915
- After-tax cash flow
- $-2,865/yr
For passive investors: Depreciation is non-cash, so a rental often shows a tax loss while cash-flowing — sheltering income. Rental losses are passive: they offset passive income freely, and up to $25,000/yr can offset ordinary (W-2) income if you actively participate and your MAGI is under $100k (phasing out to $0 by $150k); unused losses carry forward. On sale, claimed depreciation is recaptured at up to 25%, and gains may owe capital-gains tax (a 1031 exchange can defer both). Figures are a year-1 estimate at your 24.0% rate — not tax advice; consult a CPA.
Condition & rehab AI · 6 photos
This home is in excellent condition with minimal repairs needed. It's move-in ready and has the potential to be a great investment with some cosmetic updates.
Value-add opportunities
- Both Painting the exterior — Enhances curb appeal and value
- Both Landscaping the front yard — Improves curb appeal and rental value
- Both Upgrading the kitchen appliances — Modernizes the space and attracts buyers
- Both Installing new flooring in the bathrooms — Enhances the look and feel of the bathrooms
Renovation cost estimate screening
Value-add ROI direction
- Both Painting the exterior — Enhances curb appeal and value ↑
- Both Landscaping the front yard — Improves curb appeal and rental value ↑
- Both Upgrading the kitchen appliances — Modernizes the space and attracts buyers ↑
- Both Installing new flooring in the bathrooms — Enhances the look and feel of the bathrooms ↑
ⓘ Cost ranges are severity-bucket heuristics (US national rule-of-thumb). Get contractor quotes + a written scope before underwriting a rehab budget.
Schools (NCES district)
- District
- Dallas ISD
- NCES district ID
- 4816230
- Math proficiency
- 31% ▼ -16.00%
- Reading proficiency
- 36% ▼ -4.00%
- Median HH income
- $42,881
- Composite
- 28.41/100
- National rank
- #6763
- State rank
- #559 of 826 in TX
Livability — Dallas
- Score
- 81/100
- State rank
- #24
- US rank
- #1380
Category grades
Schools grade is shown separately in the Schools card above.
Census & demographics
- Census place
- Dallas, TX
- County
- Dallas County · 2,612,404 people
- City population
- 1,168,437
- Metro
- Dallas-Fort Worth-Arlington, TX
- Population (ZIP)
- 28,259
- Household income
- $59,750
- Rent vs Own
- Severe rent burden
- 892.0
Population outlook (Dallas County) Hauer SSP2
- Today (2025)
- 2,979,839 people
- By 2030
- 3,191,823 · +7.1%
- By 2040
- 3,619,611 · +21.5%
- By 2050
- 4,026,915 · +35.1%
- By 2075
- 4,957,073 · +66.4%
- By 2100
- 5,508,725 · +84.9%
Race, ethnicity, and origin ACS 2023
- Neighborhood character
- Predominantly Hispanic (67%)
- Race & ethnicity
- Hispanic / Latino 67% Two or more races 26% Black 23% White 6% Asian 2%
- Hispanic origin (detail)
- Mexican 55%
- Common ancestry
- Slovak 1%
- Foreign-born
- 27% · Canada, Vietnam, Jamaica
- Languages at home
- 42% English-only · Spanish 52% Vietnamese 1%
Political lean MEDSL · Dallas
- 2024 margin
- Strong D (+22.2) · D 60.2% · R 38.0% · Other 1.8%
- 2008→2024 swing
- +6.9pp toward D · 2008: 15.3pp · 2024: 22.2pp
- All cycles
- 2024: D+22.2 2020: D+31.6 2016: D+26.2 2012: D+15.4 2008: D+15.3
Not yet ingested
- Civics
- —
Market trends
- HPI YoY
- ▲ 138.69%
- Current HPI
- 477.2035
- Rent YoY
- ▼ -4.21%
- Metro
- Dallas-Fort Worth-Arlington, TX
- State GDP YoY
- ▲ 3.95%
- F500 in state
- 110
Industry mix (Fortune 500 HQ in TX)
| Industry | F500 HQs | Revenue |
|---|---|---|
| Energy | 16 | $1,198B |
|
||
| Technology | 5 | $198B |
|
||
| Engineering / Construction | 4 | $72B |
|
||
| Energy Services | 3 | $60B |
|
||
| Utilities | 3 | $41B |
|
||
| Healthcare | 2 | $330B |
|
||
Price history
1 event — show timeline
- 2026-06-05 Listed $364,900 NTREIS
Property tax history
+739.6%/yrLatest (2025): $7,881 · +739.6% YoY. Source: county tax records.
Cash-flow waterfall
monthlySold comps — $/sqft
last 12 mo · ≤1 miLoading sold comps…