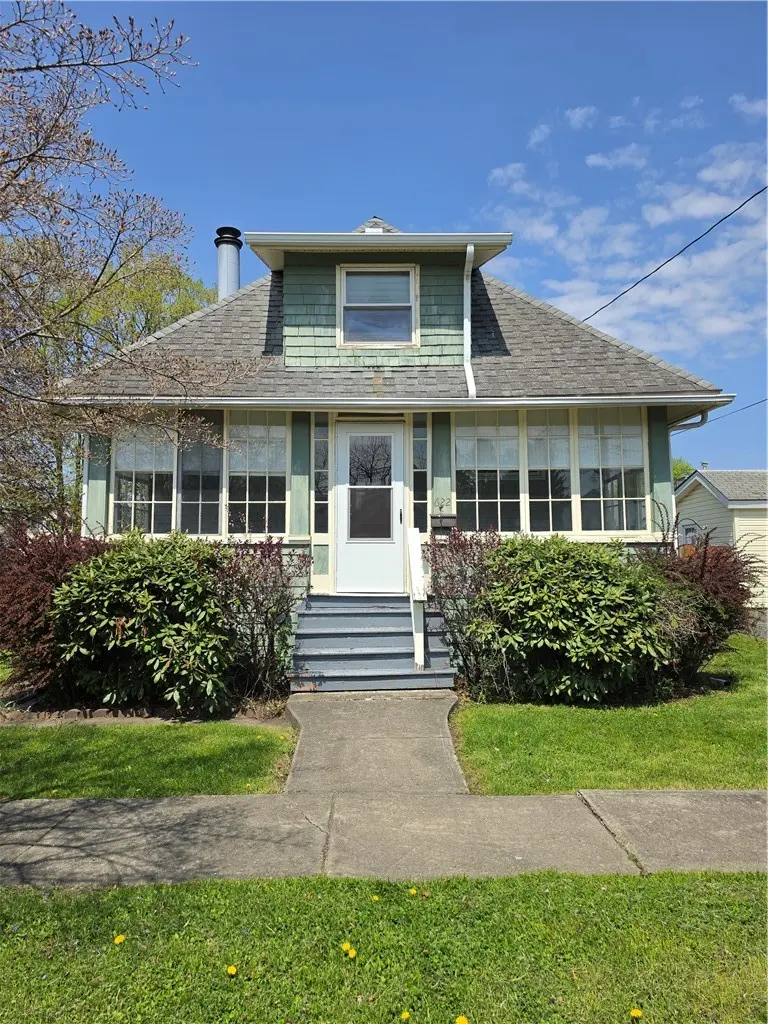
622 Yale St · Southport, NY
Flood risk 6/10 · Moderate
- FEMA flood zone
- X
- Chance of flooding over 30 yrs
- 0.71%
- Est. flood insurance / yr
- $473 – $860
Fire risk 1/10 · Minimal
- Est. fire insurance / yr
- $691 – $1,283
Heat risk 3/10 · Minor
- Hot days now (above 94°F)
- 8 days/yr
- Hot days in 30 yrs
- 17 days/yr
Wind risk 2/10 · Minimal
- Chance of severe wind over 30 yrs
- 1.0%
Air-quality risk 1/10 · Minimal
- Unhealthy air days now
- 0 days/yr
- Unhealthy air days in 30 yrs
- 0 days/yr
Risk factors via First Street. Map © Google.
Why this score? — see what drove the B grade
The composite is a weighted blend of 9 inputs, each scored 0–100. Each bar is that input's sub-score; the figure is the points it added to the 100-point composite (weight × sub-score).
- Cash flow +30.0/30.0
- ARV discount +15.0/15.0
- DSCR +10.0/10.0
- 1% rule +9.3/10.0
- Livability +3.2/5.0
- Rent growth +2.5/5.0
- Condition / age +2.5/5.0
- Schools +2.4/10.0
- Appreciation +0.0/10.0
$90,000
🖨 Deal sheet (PDF) 📄 Offer letter ✓ Due diligence
Listing remarks
This cozy 3-bedroom home is just waiting to welcome you in! From the moment you step inside, you’ll feel the warmth and charm, with a bright eat-in kitchen, a spacious pantry. One of the true highlights is the enclosed porch—surrounded by windows and filled with natural light, it’s the perfect spot for morning coffee, a good book, or simply unwinding at the end of the day. Outside you’ll find a large, fully fenced-in backyard. There’s also off-street parking, a 1-car garage with an attached storage shed, plus a back porch/storage area for all your extras. With a newer water heater already in place and just a touch of TLC needed, this home offers the perfect ble
Key facts
- Spacious pantry
- Eat-in kitchen
- Enclosed porch
Tags
Property features AI
Exterior
- Parking: Detached garage; One garage space
- Utilities: Public water connected; Septic sewer
- Home design: Single-story existing home
- Construction: Composite siding; Poured foundation
- Exterior features: Enclosed porch; Open porch; Fully fenced yard; Gravel driveway; Rectangular residential lot; City street frontage; Lot dimensions approximately 75 x 110
Interior
- Kitchen: Electric oven; Electric range; Refrigerator
- Bedrooms: One main-level bedroom
- Flooring: Carpet; Hardwood; Mixed/varied flooring
- Bathrooms: One full bathroom (main level)
- Heating & cooling: Gas forced-air heating
- Interior features: Eat-in kitchen; Bedroom on main level; Full basement; One fireplace
- Laundry & utility: Laundry in basement; Gas water heater
Neighborhood map
What this means for you Summary
Snapshot
- This is a 3-bed/1.0-bath single-family listed at $90k.
Deal economics
- At list price, monthly cash flow is $391 ($5k/yr) — positive.
- The deal already cash-flows at list — no discount required.
- Meets the 1% rule at list price ($1k rent vs $90k).
- Recommended offer: $87k (3.0% below list) — sets the bar for market timing.
- Cap rate 11.5% vs local median 6.5% in Southport — top-decile yield for the area; either an underpriced asset or a hidden risk that comps aren't pricing in. Stress-test before assuming the spread holds.
Location & tenants
- Location reads 65/100 on livability (#690 in NY) — a middle-class / working-renter tenant base. Strengths: cost of living A+, housing A; Watch: schools D+, employment D, health & safety D.
- Elmira City School District (urban): math 23% / reading 35% proficiency, ranked #580 of 590 in NY (top 98%) — low school quality limits family demand, transient renter base, plan for 1-2y turnover.
- Market conditions: 101 active listings in the ZIP; 4 comparable units currently listed for rent nearby; rentals lingering (median 45d on market — plan ~5-8 weeks vacancy on turnover, expect pricing pressure); 100% of comp listings sitting > 30 days — soft ceiling on asking rent; 91 units permitted in Chemung County in 2024 (63 in 5+ unit buildings).
Forward outlook
- Local home prices are declining (-3.0%/yr); year-one equity from $622 of loan paydown is wiped out by about $3k of value loss. Plan a longer hold.
- Chemung County population projected at -17% by 2050 — secular population decline; favor cash flow + early exit over multi-decade hold.
- At projected returns (-3.0% appreciation + 3.0% rent growth), your $25k cash investment doubles in ~7 years — after that, you're playing with house money.
Negotiation context
- It's been on market 56 days — a 3% lower offer ($87k) is reasonable based on typical stale-listing flexibility.
- 2 sale attempts; this cycle's ask has dropped $6k (6%) from the opening price — seller is motivated, your offer sets the floor, not the list.
- Current owner paid $41k; list at $90k implies a 120% gain — meaningful room to come down on a strong offer.
Risks & watch-outs
- Watch-outs: built in 1910 — expect roof / HVAC / electrical / plumbing capex.
- Climate carrying-cost: major flood risk — expect insurance premiums to compound above CPI over the hold.
Questions for the listing agent
- It's been on market 56 days. Have you received any prior offers? Is the seller open to a 3% concession, seller financing, or rate buy-down credit?
- Built in 1910 — when were the roof, HVAC, electrical panel, plumbing, and water heater last replaced?
- Is there a deadline driving the sale (1031 exchange, divorce, estate, relocation)? That informs how much negotiation room exists.
- Schools are D-rated, which usually means shorter tenancies and higher turnover. Who's the typical renter profile here, and what's been the actual vacancy rate?
- Crime grade is D in this area — have there been break-ins, vandalism, or insurance claims at this property in the last 3 years? What carrier currently insures it and at what premium?
- What's the average days-on-market for RENTAL listings here right now (not sales)? A rising rental-DOM trend means longer vacancies and softer asking-rent achievability than the comps imply.
- What's the recent tenant-quality profile in this submarket — average credit score on applications, eviction rate, late-payment / NSF rate, and stable-employment percentage? A property-management company in the area should have these aggregated.
- How much new for-sale + rental construction is in the pipeline within 1–3 miles? Heavy new supply typically softens prices + rents 12–24 months out; constrained supply supports both.
Investment metrics
- 1% rule
- 1.43% ✓
- Cap rate
- 11.51%
- Cash-on-cash
- 18.63%
- DSCR
- 1.83
- GRM
- 5.8
CMA / ARV
- ARV (median comp)
- $119,940
- List price
- $90,000
- Delta
- -24.96%
- Verdict
- UNDERPRICED
- Comps
- 20 within 1.0 mi
Show comp detail 12 sales within ~0.75 mi
| Address | Dist | Beds/Ba | Sqft | Sold | Price | $/sf | Match |
|---|---|---|---|---|---|---|---|
| 635 Newtown St | 0.14mi | 2/1.0 (-1) | 913 (+4%) | 8mo | $123,500 | $135 | 76 |
| 284 Universal Ave | 0.41mi | 2/1.0 (-1) | 888 (+1%) | 4mo | $159,900 | $180 | 71 |
| 266 Robert St | 0.46mi | 3/1.0 | 864 (-2%) | 5mo | $95,000 | $110 | 71 |
| 268 Robert St | 0.47mi | 3/1.0 | 828 (-6%) | 4mo | $75,000 | $91 | 65 |
| 928 Cedar | 0.31mi | 2/1.0 (-1) | 940 (+7%) | 12mo | $110,000 | $117 | 59 |
| 614 Chester St | 0.73mi | 2/1.0 (-1) | 875 (-1%) | 4mo | $112,765 | $129 | 56 |
| 719 Dubois St | 0.36mi | 3/1.0 | 1,008 (+14%) | 4mo | $120,000 | $119 | 55 |
| 649 Newtown St | 0.12mi | 2/1.0 (-1) | 768 (-13%) | 16mo | $50,000 | $65 | 54 |
| 763 Chester St | 0.74mi | 2/1.0 (-1) | 864 (-2%) | 4mo | $117,000 | $135 | 54 |
| 650 Medina St | 0.55mi | 2/1.0 (-1) | 857 (-3%) | 17mo | $45,000 | $53 | 50 |
| 235 Marion St | 0.52mi | 2/1.0 (-1) | 828 (-6%) | 14mo | $72,500 | $88 | 49 |
| 604 Spruce St | 0.49mi | 2/1.0 (-1) | 792 (-10%) | 12mo | $79,000 | $100 | 46 |
Match score weights: distance 35% · size 25% · config 20% · recency 20%. Top-matched comps best support the ARV.
Projected returns pro-forma
-3.0% appreciation · 3.0% rent growth · sell at horizon
- IRR
- 10.4%
- Equity multiple
- 1.41×
- Total profit
- $10,352
- Equity at exit
- $13,419
- IRR
- 19.5%
- Equity multiple
- 2.63×
- Total profit
- $41,177
- Equity at exit
- $7,782
Cash invested: $25,200 (down + closing). Projections, not guarantees.
Landlord ↔ Tenant lean methodology
- Overall (STATE)
- 15 Strongly Tenant-Friendly
- State New York
- 15 Strongly Tenant-Friendly · D+10
- County
- — inherits STATE
- City
- — inherits STATE
ZIP-level market 14904
- Home prices YoY
- -9.6%
- Active inventory
- 101
- Price-to-rent
- 5.8×
Monthly cashflow live
- Estimated rent
- $1,283 medium interval (Pro) →
- Mortgage (P&I)
- −$472
- Tax from tax record
- −$113 /mo · $1,357/yr
- Insurance
- −$38
- HOA
- −$0
- Vacancy / Maint / Mgmt
- −$269
- Net cashflow
- $391
Break-even live
Sensitivity live
| Price | -10% $442 | -5% $417 | +0% $391 | +5% $366 | +10% $340 |
|---|---|---|---|---|---|
| Rent | -10% $290 | -5% $341 | +0% $391 | +5% $442 | +10% $493 |
| Rate | -1.0pp $437 | -0.5pp $414 | base $391 | +0.5pp $368 | +1.0pp $344 |
UW: 25.0% down · 7.5% · 30yr · 1.5% tax · 5.0% vac · 8.0% maint · 8.0% mgmt
Financing live
Cash to close
- Down payment
- $22,500
- Closing costs
- $2,700
- Reserves months
- —
- Total cash needed
- —
Loan-product check · same deal, 3 products live
Conventional
25% down · 7.5% · 30yr
- Down + closing
- —
- Monthly P&I
- —
- Monthly cashflow
- —
- DSCR
- —
- Eligible?
- —
Personal DTI + credit; lowest rate.
DSCR
20% down · 8.5% · 30yr
- Down + closing
- —
- Monthly P&I
- —
- Monthly cashflow
- —
- DSCR
- —
- Eligible?
- —
No personal income docs; deal must DSCR.
Hard money
10% down · 12.0% · 12mo
- Down + closing
- —
- Monthly P&I
- —
- Monthly cashflow
- —
- DSCR
- —
- Eligible?
- —
Short-term bridge; refi at stabilization.
Rent comps 4 comps
| Address | Beds | Baths | Sqft | Rent | $/sqft | DOM | Units | Dist |
|---|---|---|---|---|---|---|---|---|
| 235 Allen St Elmira, NY | 2.0 | 1.0 | 780 | $950 | $1.22 | 44d | 1 | 0.50mi |
| 419 Jefferson St Unit A Elmira, NY | 2.0 | 2.0 | 1100 | $1,995 | $1.81 | 44d | 1 | 0.81mi |
| 711 W Water St Unit 1 Elmira, NY | 2.0 | 1.0 | 590 | $1,100 | $1.86 | 44d | 1 | 1.41mi |
| 363 W Water St #2 Elmira, NY | 3.0 | 1.0 | 1084 | $1,250 | $1.15 | 44d | 1 | 1.49mi |
Listing history 19 events
-
2026-06-19days on market $90,000 Active 56 DOM
-
2026-06-18days on market $90,000 Active 55 DOM
-
2026-06-17days on market $90,000 Active 54 DOM
-
2026-06-16days on market $90,000 Active 53 DOM
-
2026-06-16price $90,000 Active 52 DOM
-
2026-06-15days on market $96,000 Active 52 DOM
-
2026-06-14statusdays on market $96,000 Active 50 DOM
-
2026-06-12days on market $96,000 Active Under Contract 49 DOM
-
2026-06-09days on market $96,000 Active Under Contract 46 DOM
-
2026-06-08days on market $96,000 Active Under Contract 45 DOM
-
2026-06-07days on market $96,000 Active Under Contract 44 DOM
-
2026-06-05days on market $96,000 Active Under Contract 41 DOM
-
2026-06-03days on market $96,000 Active Under Contract 40 DOM
-
2026-06-02statusdays on market $96,000 Active Under Contract 39 DOM
-
2026-06-01days on market $96,000 Active 38 DOM
-
2026-05-31days on market $96,000 Active 37 DOM
-
2026-05-30days on market $96,000 Active 36 DOM
-
2026-04-24$96,000 Active 867-char remark
-
2006-09-10soldstatus $41,000
ⓘ Source: listings_history table (triggers on properties + properties_extension) + one-shot
backfill from property_details.listing_events for pre-trigger history.
Tax reassessment forecast NY · Partial reset (capped growth)
- Current annual tax
- $1,357 · $113/mo
- Projected year-2 tax
- $1,439 · $120/mo
- Expected delta
- +$82/yr (+$7/mo · 6.0%)
ⓘ Screening estimate from a state-policy table — verify with the county assessor before closing.
Climate risk First Street
- Flood 6/10 Major FEMA zone X · 71% chance over 30 yrs
- Wildfire 1/10 Low
- Heat 3/10 Moderate 8 d/yr ≥94°F today · 17 d/yr by 30 yrs out
- Wind 2/10 Low 100% chance of damaging wind over 30 yrs
- Air quality 1/10 Low 0 unhealthy d/yr today · 0 by 30 yrs out
Nearby sold comps map
Loading sold comps map…
Walkable amenities ~0.75 mi
Loading nearby amenities…
Taxation est. · year 1
- Rental income
- $15,399
- − Mortgage interest
- −$5,041
- − Property taxes
- −$1,357
- − Insurance
- −$450
- − Repairs & maintenance
- −$1,232
- − Management
- −$1,232
- − Depreciation
- −$2,618
- Taxable income
- $3,468
- Est. tax owed @ 24.0%
- −$832
- After-tax cash flow
- $3,862/yr
For passive investors: Depreciation is non-cash, so a rental often shows a tax loss while cash-flowing — sheltering income. Rental losses are passive: they offset passive income freely, and up to $25,000/yr can offset ordinary (W-2) income if you actively participate and your MAGI is under $100k (phasing out to $0 by $150k); unused losses carry forward. On sale, claimed depreciation is recaptured at up to 25%, and gains may owe capital-gains tax (a 1031 exchange can defer both). Figures are a year-1 estimate at your 24.0% rate — not tax advice; consult a CPA.
Schools (NCES district)
- District
- Elmira City School District
- NCES district ID
- 3610560
- Math proficiency
- 23% ▼ -7.00%
- Reading proficiency
- 35% ▲ 7.00%
- Median HH income
- $40,180
- Composite
- 24.39/100
- National rank
- #7688
- State rank
- #580 of 590 in NY
Livability — Southport
- Score
- 65/100
- State rank
- #690
- US rank
- #13026
Category grades
Schools grade is shown separately in the Schools card above.
Census & demographics
- Census place
- Southport, NY
- Population (ZIP)
- 14,276
Population outlook (Chemung County) Hauer SSP2
- Today (2025)
- 82,931 people
- By 2030
- 80,356 · -3.1%
- By 2040
- 74,745 · -9.9%
- By 2050
- 69,012 · -16.8%
- By 2075
- 55,689 · -32.8%
- By 2100
- 41,428 · -50.0%
Race, ethnicity, and origin ACS 2023
- Neighborhood character
- Predominantly White (83%)
- Race & ethnicity
- White 83% Two or more races 7% Black 7% Hispanic / Latino 5% Native American 1%
- Common ancestry
- Romanian 7% Lithuanian 3% Slovak 2%
- Foreign-born
- 2% · Canada, Jamaica, Dominican Republic
- Languages at home
- 97% English-only · Spanish 2%
Political lean MEDSL · Chemung
- 2024 margin
- R (+16.8) · D 41.6% · R 58.4%
- 2008→2024 swing
- -15.6pp toward R · 2008: -1.2pp · 2024: -16.8pp
- All cycles
- 2024: R+16.8 2020: R+13.4 2016: R+20.0 2012: R+2.9 2008: R+1.2
Not yet ingested
- Civics
- —
Market trends
- HPI YoY
- ▼ -23.33%
- Current HPI
- 220.688
- Rent YoY
- —
- Metro
- —
- State GDP YoY
- ▲ 2.60%
- F500 in state
- 92
Industry mix (Fortune 500 HQ in NY)
| Industry | F500 HQs | Revenue |
|---|---|---|
| Financial Services | 10 | $950B |
|
||
| Consumer Goods | 9 | $162B |
|
||
| Insurance | 4 | $225B |
|
||
| Telecommunications | 2 | $144B |
|
||
| Pharmaceuticals | 2 | $112B |
|
||
| Media / Entertainment | 2 | $69B |
|
||
Price history
+119.5% since first listed5 events — show timeline
- 2026-06-15 Price Changed $90,000 UNYREIS
- 2026-06-13 Relisted — UNYREIS
- 2026-06-02 Contingent — UNYREIS
- 2026-04-24 Listed $96,000 UNYREIS
- 2006-09-10 Sold (Public Records) $41,000 Public Records
Property tax history
+2.8%/yrLatest (2025): $1,357 · +3.3% YoY. Source: county tax records.
Cash-flow waterfall
monthlySold comps — $/sqft
last 12 mo · ≤1 miLoading sold comps…