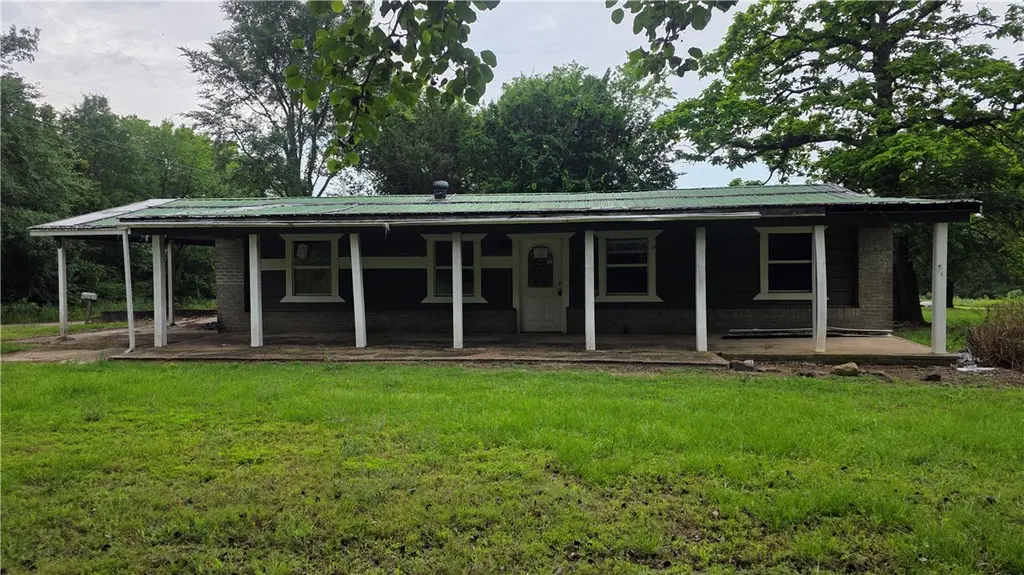
161 Hughes Rd · Lamar, AR
Flood risk 1/10 · Minimal
- FEMA flood zone
- X (unshaded)
- Chance of flooding over 30 yrs
- 0.0%
- Est. flood insurance / yr
- $507 – $1,088
Fire risk 5/10 · Moderate
- Est. fire insurance / yr
- $1,499 – $2,785
Heat risk 6/10 · Moderate
- Hot days now (above 111°F)
- 7 days/yr
- Hot days in 30 yrs
- 20 days/yr
Wind risk 2/10 · Minimal
- Chance of severe wind over 30 yrs
- 2.0%
Air-quality risk 1/10 · Minimal
- Unhealthy air days now
- 0 days/yr
- Unhealthy air days in 30 yrs
- 0 days/yr
Risk factors via First Street. Map © Google.
Why this score? — see what drove the B+ grade
The composite is a weighted blend of 9 inputs, each scored 0–100. Each bar is that input's sub-score; the figure is the points it added to the 100-point composite (weight × sub-score).
- Cash flow +30.0/30.0
- 1% rule +10.0/10.0
- DSCR +10.0/10.0
- Appreciation +8.1/10.0
- ARV discount +7.5/15.0
- Livability +3.6/5.0
- Schools +2.6/10.0
- Rent growth +2.5/5.0
- Condition / age +2.5/5.0
$36,000
🖨 Deal sheet 📄 Offer letter ✓ Due diligence
Listing remarks MLS
Charming updated home on the edge of Lamar features 4brs & a 30x20 shop (adjoining 30x15 slab). Nice flat lot w/ garden spot and many outdoor spaces including a full length front covered porch, deck, & patio. New flooring & paint as well as updated baths and kitchen provide a move-in-ready space. Tankless HHH (2018, and new HVAC (2018) & metal roof add to the value. Schedule to see this beautiful property today!!!
Key facts
- Generous lot
- Large workshop
- Outdoor improvements
Tags
Property features AI
Finance
- Other: Lot size approximately 0.83 acres
- Financial info: Financial details not provided
- HOA & community: HOA fee listed as monthly
Exterior
- Parking: Attached carport; 2 covered parking spaces; Has carport
- Security: No specific security features listed
- Utilities: Electricity available; Public water; Septic available (septic tank)
- Home design: Single-story; Metal roof; Brick, frame, and wood siding construction; Foundation: crawlspace and slab; Lot located in a subdivision; Paved public road frontage
- Construction: Built with brick, frame, and wood siding; Metal roof
- Exterior features: Gravel driveway; Covered patio/porch; Deck; Outbuilding
Interior
- Kitchen: Kitchen details not provided
- Bedrooms: Bedroom information not provided
- Flooring: Carpet; Laminate; Simulated wood; Vinyl
- Bathrooms: 2 full bathrooms
- Heating & cooling: Central heating (electric); Central air conditioning (electric)
- Interior features: No additional interior features listed
- Laundry & utility: Laundry/utility details not provided
Neighborhood map
What this means for you Summary
Snapshot
- This is a 4-bed/2.0-bath single-family listed at $36k.
Deal economics
- At list price, monthly cash flow is $503 ($6k/yr) — positive.
- The deal already cash-flows at list — no discount required.
- Meets the 1% rule at list price ($1k rent vs $36k).
Location & tenants
- Location reads 71/100 on livability (#47 in AR) — a middle-class / working-renter tenant base. Strengths: cost of living A+, housing A+, health & safety A+; Watch: schools D, employment D, amenities F.
- Lamar School District (rural): math 32% / reading 30% proficiency, ranked #152 of 238 in AR (top 64%) — families likely to look elsewhere, expect single-tenant / working-renter base with shorter leases.
- Market conditions: 36 active listings in the ZIP; 12 units permitted in Johnson County in 2024 (0 in 5+ unit buildings).
Forward outlook
- In year one you build about $2k of equity ($249 loan paydown + $2k appreciation (6.2% local appreciation)).
- Johnson County population projected at +8% by 2050 — modest demand growth; plan on rents tracking national, not racing it.
- At projected returns (6.2% appreciation + 3.0% rent growth), your $10k cash investment doubles in ~2 years — after that, you're playing with house money.
Negotiation context
- Only 11 days on market — expect competitive offers; lowballing is unlikely to land.
- 2 sale attempts since 6y ago with the ask held roughly flat each time — persistent listings suggest the price (not the market) is what's stuck; bring a comps-based counter.
Risks & watch-outs
- Watch-outs: property tax is 3.5% of price.
- Climate carrying-cost: moderate wildfire risk; extreme-heat days projected 7→20/yr by 2055 (HVAC capex compounding) — expect insurance premiums to compound above CPI over the hold.
Questions for the listing agent
- Built in 1978 — when were the roof, HVAC, electrical panel, plumbing, and water heater last replaced?
- Property tax is high relative to price — has the assessment been appealed recently, and will the sale trigger a re-assessment?
- Is there a deadline driving the sale (1031 exchange, divorce, estate, relocation)? That informs how much negotiation room exists.
- Schools are D-rated, which usually means shorter tenancies and higher turnover. Who's the typical renter profile here, and what's been the actual vacancy rate?
- What's the average days-on-market for RENTAL listings here right now (not sales)? A rising rental-DOM trend means longer vacancies and softer asking-rent achievability than the comps imply.
- What's the recent tenant-quality profile in this submarket — average credit score on applications, eviction rate, late-payment / NSF rate, and stable-employment percentage? A property-management company in the area should have these aggregated.
- How much new for-sale + rental construction is in the pipeline within 1–3 miles? Heavy new supply typically softens prices + rents 12–24 months out; constrained supply supports both.
Investment metrics
- 1% rule
- 2.86% ✓
- Cap rate
- 23.06%
- Cash-on-cash
- 59.89%
- DSCR
- 3.66
- GRM
- 2.9
CMA / ARV
- ARV (on-the-fly)
- $211,640
- Comps found
- 4
Show comp detail 4 sales within ~0.75 mi
| Address | Dist | Beds/Ba | Sqft | Sold | Price | $/sf | Match |
|---|---|---|---|---|---|---|---|
| 101 N Cumberland St | 0.52mi | 3/2.0 (-1) | 1,620 (-0%) | 11mo | $135,000 | $83 | 61 |
| 150 Ash St | 0.47mi | 3/2.5 (-1) | 1,714 (+5%) | 23mo | $184,900 | $108 | 43 |
| 141 Meadow Ln | 0.73mi | 3/2.0 (-1) | 1,780 (+9%) | 10mo | $239,000 | $134 | 37 |
| 152 Cedarwood Dr | 0.75mi | 3/2.0 (-1) | 1,388 (-15%) | 9mo | $180,000 | $130 | 28 |
Match score weights: distance 35% · size 25% · config 20% · recency 20%. Top-matched comps best support the ARV.
Projected returns pro-forma
6.25% appreciation · 3.0% rent growth · sell at horizon
- IRR
- 68.2%
- Equity multiple
- 5.27×
- Total profit
- $43,032
- Equity at exit
- $23,208
- IRR
- 65.0%
- Equity multiple
- 11.06×
- Total profit
- $101,455
- Equity at exit
- $42,593
Cash invested: $10,080 (down + closing). Projections, not guarantees.
Landlord ↔ Tenant lean methodology
- Overall (STATE)
- 92 Strongly Landlord-Friendly
- State Arkansas
- 92 Strongly Landlord-Friendly · R+14
- County
- — inherits STATE
- City
- — inherits STATE
ZIP-level market 72846
- Home prices YoY
- 3.3%
- Active inventory
- 36
- Price-to-rent
- 2.9×
Monthly cashflow live
- Estimated rent
- $1,028 medium interval (Pro) →
- Mortgage (P&I)
- −$189
- Tax from tax record
- −$105 /mo · $1,264/yr
- Insurance
- −$15
- HOA
- −$0
- Vacancy / Maint / Mgmt
- −$216
- Net cashflow
- $503
Break-even live
UW: 25.0% down · 7.5% · 30yr · 1.5% tax · 5.0% vac · 8.0% maint · 8.0% mgmt
Financing live
Cash to close
- Down payment
- $9,000
- Closing costs
- $1,080
- Reserves months
- —
- Total cash needed
- —
Loan-product check · same deal, 3 products live
Conventional
25% down · 7.5% · 30yr
- Down + closing
- —
- Monthly P&I
- —
- Monthly cashflow
- —
- DSCR
- —
- Eligible?
- —
Personal DTI + credit; lowest rate.
DSCR
20% down · 8.5% · 30yr
- Down + closing
- —
- Monthly P&I
- —
- Monthly cashflow
- —
- DSCR
- —
- Eligible?
- —
No personal income docs; deal must DSCR.
Hard money
10% down · 12.0% · 12mo
- Down + closing
- —
- Monthly P&I
- —
- Monthly cashflow
- —
- DSCR
- —
- Eligible?
- —
Short-term bridge; refi at stabilization.
Listing history 9 events
-
2026-06-19days on market $36,000 Active 11 DOM
-
2026-06-18days on market $36,000 Active 10 DOM
-
2026-06-17days on market $36,000 Active 9 DOM
-
2026-06-16days on market $36,000 Active 8 DOM
-
2026-06-15days on market $36,000 Active 7 DOM
-
2026-06-14days on market $36,000 Active 5 DOM
-
2026-06-12days on market $36,000 Active 4 DOM
-
2026-06-09remarks 539-char remark
-
2026-06-09$36,000 Active 1 DOM
ⓘ Source: listings_history table (triggers on properties + properties_extension) + one-shot
backfill from property_details.listing_events for pre-trigger history.
Tax reassessment forecast AR · Resets to sale price
- Current annual tax
- $1,264 · $105/mo
- Projected year-2 tax
- $1,264 · $105/mo
- Expected delta
- $0/yr ($0/mo · 0.0%)
ⓘ Screening estimate from a state-policy table — verify with the county assessor before closing.
Climate risk First Street
- Flood 1/10 Low FEMA zone X (unshaded) · 0% chance over 30 yrs
- Wildfire 5/10 Major
- Heat 6/10 Major 7 d/yr ≥111°F today · 20 d/yr by 30 yrs out
- Wind 2/10 Low 2% chance of damaging wind over 30 yrs
- Air quality 1/10 Low 0 unhealthy d/yr today · 0 by 30 yrs out
Nearby sold comps map
Loading sold comps map…
Walkable amenities ~0.75 mi
Loading nearby amenities…
Taxation est. · year 1
- Rental income
- $12,337
- − Mortgage interest
- −$2,017
- − Property taxes
- −$1,264
- − Insurance
- −$180
- − Repairs & maintenance
- −$987
- − Management
- −$987
- − Depreciation
- −$1,047
- Taxable income
- $5,856
- Est. tax owed @ 24.0%
- −$1,405
- After-tax cash flow
- $4,632/yr
For passive investors: Depreciation is non-cash, so a rental often shows a tax loss while cash-flowing — sheltering income. Rental losses are passive: they offset passive income freely, and up to $25,000/yr can offset ordinary (W-2) income if you actively participate and your MAGI is under $100k (phasing out to $0 by $150k); unused losses carry forward. On sale, claimed depreciation is recaptured at up to 25%, and gains may owe capital-gains tax (a 1031 exchange can defer both). Figures are a year-1 estimate at your 24.0% rate — not tax advice; consult a CPA.
Schools (NCES district)
- District
- Lamar School District
- NCES district ID
- 0508700
- Math proficiency
- 32% ▼ -18.00%
- Reading proficiency
- 30% ▼ -9.00%
- Median HH income
- $34,106
- Composite
- 25.53/100
- National rank
- #7432
- State rank
- #152 of 238 in AR
Livability — Lamar
- Score
- 71/100
- State rank
- #47
- US rank
- #7257
Category grades
Schools grade is shown separately in the Schools card above.
Census & demographics
- Census place
- Lamar, AR
- Population (ZIP)
- 3,874
Population outlook (Johnson County) Hauer SSP2
- Today (2025)
- 27,452 people
- By 2030
- 28,003 · +2.0%
- By 2040
- 28,960 · +5.5%
- By 2050
- 29,627 · +7.9%
- By 2075
- 31,000 · +12.9%
- By 2100
- 31,173 · +13.6%
Race, ethnicity, and origin ACS 2023
- Neighborhood character
- Predominantly White (85%)
- Race & ethnicity
- White 85% Two or more races 9% Hispanic / Latino 7%
- Hispanic origin (detail)
- Mexican 5%
- Common ancestry
- Italian 4% Iranian 2% Slovak 2%
- Foreign-born
- 1% · Canada
- Languages at home
- 95% English-only · Spanish 5%
Political lean MEDSL · Johnson
- 2024 margin
- Solid R (+51.4) · D 23.3% · R 74.7% · Other 2.0%
- 2008→2024 swing
- -28.4pp toward R · 2008: -23.1pp · 2024: -51.4pp
- All cycles
- 2024: R+51.4 2020: R+49.0 2016: R+40.6 2012: R+28.0 2008: R+23.1
Not yet ingested
- Civics
- —
Market trends
- HPI YoY
- ▲ 6.25%
- Current HPI
- 193.3176
- Rent YoY
- —
- Metro
- —
- State GDP YoY
- ▲ 3.80%
- F500 in state
- 10
Industry mix (Fortune 500 HQ in AR)
| Industry | F500 HQs | Revenue |
|---|---|---|
| Retail | 1 | $681B |
|
||
| Food / Agriculture | 1 | $53B |
|
||
| Retail / Energy | 1 | $22B |
|
||
| Transportation / Logistics | 1 | $12B |
|
||
| Energy | 1 | $4B |
|
||
Price history
-29.8% since first listed15 events — show timeline
- 2026-06-08 Listed $36,000 NWARMLS
- 2026-01-27 Price Changed $59,000 NWARMLS
- 2025-11-14 Price Changed $69,000 NWARMLS
- 2025-10-13 Price Changed $70,000 NWARMLS
- 2025-09-12 Price Changed $72,000 NWARMLS
- 2025-06-12 Price Changed $76,000 NWARMLS
- 2025-04-01 Price Changed $80,000 NWARMLS
- 2020-10-09 Sold (Public Records) $126,000 Public Records
- 2020-10-09 Sold (MLS) $126,000 NWARMLS
- 2020-07-28 Listed $119,900 NWARMLS
- 2014-06-13 Sold (Public Records) $42,000 Public Records
- 2008-12-12 Sold (Public Records) $92,000 Public Records
- 2007-07-18 Sold (Public Records) $80,000 Public Records
- 2006-03-23 Sold (Public Records) $22,606 Public Records
- 2003-03-03 Sold (Public Records) $51,295 Public Records
Property tax history
+6.1%/yrLatest (2025): $1,264 · +39.8% YoY. Source: county tax records.
Cash-flow waterfall
monthlySold comps — $/sqft
last 12 mo · ≤1 miLoading sold comps…