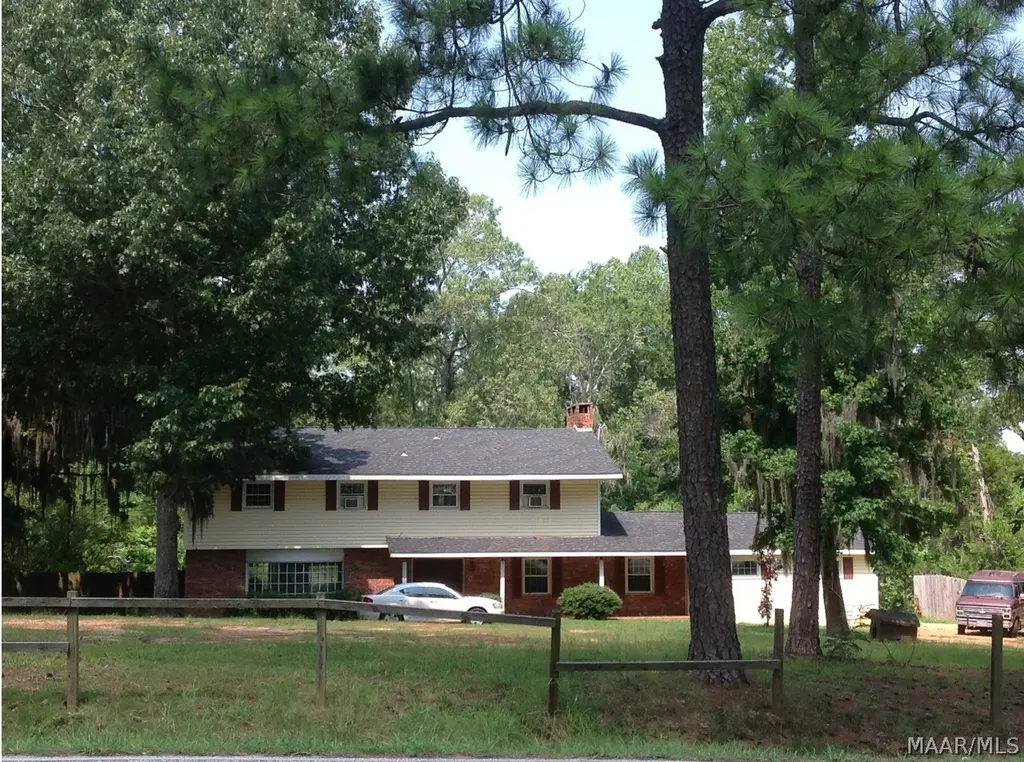
4912 Virginia Loop Rd · Montgomery, AL
Flood risk 1/10 · Minimal
- FEMA flood zone
- X (unshaded)
- Chance of flooding over 30 yrs
- 0.0%
- Est. flood insurance / yr
- $507 – $1,088
Fire risk 3/10 · Minor
- Est. fire insurance / yr
- $916 – $1,700
Heat risk 7/10 · Major
- Hot days now (above 108°F)
- 6 days/yr
- Hot days in 30 yrs
- 18 days/yr
Wind risk 8/10 · Major
- Chance of severe wind over 30 yrs
- 80.0%
Air-quality risk 2/10 · Minimal
- Unhealthy air days now
- 1 days/yr
- Unhealthy air days in 30 yrs
- 3 days/yr
Risk factors via First Street. Map © Google.
Why this score? — see what drove the C grade
The composite is a weighted blend of 9 inputs, each scored 0–100. Each bar is that input's sub-score; the figure is the points it added to the 100-point composite (weight × sub-score).
- Cash flow +20.1/30.0
- ARV discount +15.0/15.0
- DSCR +6.4/10.0
- 1% rule +4.5/10.0
- Rent growth +3.9/5.0
- Livability +3.2/5.0
- Condition / age +2.5/5.0
- Schools +1.7/10.0
- Appreciation +0.0/10.0
$205,000
🖨 Deal sheet 📄 Offer letter ✓ Due diligence
Listing remarks MLS
4+/- Acres of land with huge home right in town. Home has potential unlimited. Home features five bedrooms, three and a half baths. Ideal for a large family. Master has balcony overlooking the back. HVAC units were removed. Property to be sold as is. Agent unable to verify whether public sewer or septic.
Key facts
- Serene acres
- Formal living spaces
- Expansive den
Tags
Property features AI
Exterior
- Parking: Attached garage with 2 garage spaces; Additional parking pad spaces (3)
- Security: Intercom
- Utilities: Cable available; Electricity available; Natural gas available; Public water; Public sewer
- Home design: Two-story home; Brick construction
- Construction: Brick construction; Slab foundation; Year built per public records
- Exterior features: Balcony; Porch; Patio; Fence (partial); Storage; In-ground pool
Interior
- Kitchen: Kitchen on the first floor; Gas water heater
- Bedrooms: Multiple bedrooms located on the second floor; Additional bedroom on the first floor
- Flooring: Brick; Carpet; Tile; Wood
- Bathrooms: Three full bathrooms; Bathrooms located on both first and second floors
- Heating & cooling: Central heating; Gas heating
- Interior features: Blinds and window treatments; Bidet; Separate shower; Workshop; Intercom; Multiple fireplaces
- Laundry & utility: Washer hookup; Dryer hookup
Neighborhood map
What this means for you Summary
Snapshot
- This is a 5-bed/4.0-bath single-family listed at $205k.
Deal economics
- At list price, monthly cash flow is $255 ($3k/yr) — positive.
- The deal already cash-flows at list — no discount required.
- To meet the 1% rule (rent ≥ 1% of price), the offer needs to be $195k (5.0% below list).
- Recommended offer: $195k (5.0% below list) — sets the bar for 1% rule.
- Cap rate 7.8% vs local median 6.0% in Montgomery — meaningfully above typical; check what's discounted (condition, days-on-market, listing class) to confirm the premium yield is real.
Location & tenants
- Location reads 65/100 on livability (#138 in AL) — a middle-class / working-renter tenant base. Strengths: cost of living A+, housing A+; Watch: schools C-, employment D, crime F.
- Montgomery County (urban): math 9% / reading 31% proficiency, ranked #106 of 129 in AL (top 82%) — low school quality limits family demand, transient renter base, plan for 1-2y turnover; 70% free/reduced lunch — lower-income household profile, screen leases tightly.
- Market conditions: Rents rising fast (+5.7%/yr); 293 active listings in the ZIP; 1 comparable units currently listed for rent nearby; 460 units permitted in Montgomery County in 2024 (37 in 5+ unit buildings).
- This rent runs 42% of the median local income ($55k/yr) — at the standard rent-burdened threshold; future hikes will face affordability resistance.
Forward outlook
- Local home prices are declining (-3.0%/yr); year-one equity from $1k of loan paydown is wiped out by about $6k of value loss. Plan a longer hold.
- Montgomery County population projected to shrink 8% by 2050 — rents likely to lag national; underwrite the cash flow, not the appreciation.
Negotiation context
- It's been on market 31 days — a 3% lower offer ($199k) is reasonable based on typical stale-listing flexibility.
- 6 sale attempts since 30y ago with the ask held roughly flat each time — persistent listings suggest the price (not the market) is what's stuck; bring a comps-based counter.
- Current owner paid $80k; list at $205k implies a 156% gain — meaningful room to come down on a strong offer.
Risks & watch-outs
- Climate carrying-cost: severe wind risk, 80% chance of damaging wind over 30y; extreme-heat days projected 6→18/yr by 2055 (HVAC capex compounding) — expect insurance premiums to compound above CPI over the hold.
Questions for the listing agent
- It's been on market 31 days. Have you received any prior offers? Is the seller open to a 5% concession, seller financing, or rate buy-down credit?
- Built in 1963 — when were the roof, HVAC, electrical panel, plumbing, and water heater last replaced?
- Is there a deadline driving the sale (1031 exchange, divorce, estate, relocation)? That informs how much negotiation room exists.
- Crime grade is F in this area — have there been break-ins, vandalism, or insurance claims at this property in the last 3 years? What carrier currently insures it and at what premium?
- What's the average days-on-market for RENTAL listings here right now (not sales)? A rising rental-DOM trend means longer vacancies and softer asking-rent achievability than the comps imply.
- What's the recent tenant-quality profile in this submarket — average credit score on applications, eviction rate, late-payment / NSF rate, and stable-employment percentage? A property-management company in the area should have these aggregated.
- How much new for-sale + rental construction is in the pipeline within 1–3 miles? Heavy new supply typically softens prices + rents 12–24 months out; constrained supply supports both.
Investment metrics
- 1% rule
- 0.95% ✗
- Cap rate
- 7.79%
- Cash-on-cash
- 5.34%
- DSCR
- 1.24
- GRM
- 8.8
CMA / ARV
- ARV (on-the-fly)
- $306,694
- Comps found
- 1
Show comp detail 1 sale within ~0.75 mi
| Address | Dist | Beds/Ba | Sqft | Sold | Price | $/sf | Match |
|---|---|---|---|---|---|---|---|
| 4817 Patterson Rd | 0.72mi | 6/4.5 (+1) | 3,134 (-9%) | 11mo | $280,000 | $89 | 35 |
Match score weights: distance 35% · size 25% · config 20% · recency 20%. Top-matched comps best support the ARV.
Projected returns pro-forma
-3.0% appreciation · 5.65% rent growth · sell at horizon
- IRR
- -5.3%
- Equity multiple
- 0.80×
- Total profit
- $-11,681
- Equity at exit
- $30,566
- IRR
- 7.0%
- Equity multiple
- 1.59×
- Total profit
- $33,647
- Equity at exit
- $17,725
Cash invested: $57,400 (down + closing). Projections, not guarantees.
Landlord ↔ Tenant lean methodology
- Overall (STATE)
- 90 Strongly Landlord-Friendly
- State Alabama
- 90 Strongly Landlord-Friendly · R+15
- County
- — inherits STATE
- City
- — inherits STATE
ZIP-level market 36116
- Home prices YoY
- -9.7%
- Rents YoY
- 5.7%
- Active inventory
- 293
- Price-to-rent
- 8.8×
Monthly cashflow live
- Estimated rent
- $1,948 medium interval (Pro) →
- Mortgage (P&I)
- −$1,075
- Tax from tax record
- −$123 /mo · $1,473/yr
- Insurance
- −$85
- HOA
- −$0
- Vacancy / Maint / Mgmt
- −$409
- Net cashflow
- $255
Break-even live
UW: 25.0% down · 7.5% · 30yr · 1.5% tax · 5.0% vac · 8.0% maint · 8.0% mgmt
Financing live
Cash to close
- Down payment
- $51,250
- Closing costs
- $6,150
- Reserves months
- —
- Total cash needed
- —
Loan-product check · same deal, 3 products live
Conventional
25% down · 7.5% · 30yr
- Down + closing
- —
- Monthly P&I
- —
- Monthly cashflow
- —
- DSCR
- —
- Eligible?
- —
Personal DTI + credit; lowest rate.
DSCR
20% down · 8.5% · 30yr
- Down + closing
- —
- Monthly P&I
- —
- Monthly cashflow
- —
- DSCR
- —
- Eligible?
- —
No personal income docs; deal must DSCR.
Hard money
10% down · 12.0% · 12mo
- Down + closing
- —
- Monthly P&I
- —
- Monthly cashflow
- —
- DSCR
- —
- Eligible?
- —
Short-term bridge; refi at stabilization.
Rent comps 1 comps
| Address | Beds | Baths | Sqft | Rent | $/sqft | DOM | Units | Dist |
|---|---|---|---|---|---|---|---|---|
| 5175 Patterson Rd Montgomery, AL | 4.0 | 3.0 | 2558 | $2,495 | $0.98 | 43d | 1 | 1.36mi |
Listing history 22 events
-
2026-06-18days on market $205,000 Active 31 DOM
-
2026-06-17days on market $205,000 Active 30 DOM
-
2026-06-16days on market $205,000 Active 29 DOM
-
2026-06-15days on market $205,000 Active 28 DOM
-
2026-06-14days on market $205,000 Active 26 DOM
-
2026-06-13days on market $205,000 Active 25 DOM
-
2026-06-10days on market $205,000 Active 23 DOM
-
2026-06-09days on market $205,000 Active 22 DOM
-
2026-06-08days on market $205,000 Active 21 DOM
-
2026-06-07days on market $205,000 Active 20 DOM
-
2026-06-03days on market $205,000 Active 16 DOM
-
2026-06-02days on market $205,000 Active 15 DOM
-
2026-06-01days on market $205,000 Active 14 DOM
-
2026-05-31days on market $205,000 Active 13 DOM
-
2026-05-30days on market $205,000 Active 12 DOM
-
2026-05-18$205,000 Active
-
2010-12-07soldstatus $80,000 305-char remark
Show marketing remark (305 chars)
4+/- Acres of land with huge home right in town. Home has potential unlimited. Home features five bedrooms, three and a half baths. Ideal for a large family. Master has balcony overlooking the back. HVAC units were removed. Property to be sold as is. Agent unable to verify whether public sewer or septic.
-
2010-05-03$84,900 305-char remark
Show marketing remark (305 chars)
4+/- Acres of land with huge home right in town. Home has potential unlimited. Home features five bedrooms, three and a half baths. Ideal for a large family. Master has balcony overlooking the back. HVAC units were removed. Property to be sold as is. Agent unable to verify whether public sewer or septic.
-
2009-10-05$155,000
-
2008-02-11$179,712
-
2007-08-08$169,000
-
1996-09-07$178,900
ⓘ Source: listings_history table (triggers on properties + properties_extension) + one-shot
backfill from property_details.listing_events for pre-trigger history.
Tax reassessment forecast AL · Resets to sale price
- Current annual tax
- $1,473 · $123/mo
- Projected year-2 tax
- $1,473 · $123/mo
- Expected delta
- $0/yr ($0/mo · 0.0%)
ⓘ Screening estimate from a state-policy table — verify with the county assessor before closing.
Climate risk First Street
- Flood 1/10 Low FEMA zone X (unshaded) · 0% chance over 30 yrs
- Wildfire 3/10 Moderate
- Heat 7/10 Severe 6 d/yr ≥108°F today · 18 d/yr by 30 yrs out
- Wind 8/10 Severe 80% chance of damaging wind over 30 yrs
- Air quality 2/10 Low 1 unhealthy d/yr today · 3 by 30 yrs out
Nearby sold comps map
Loading sold comps map…
Walkable amenities ~0.75 mi
Loading nearby amenities…
Taxation est. · year 1
- Rental income
- $23,370
- − Mortgage interest
- −$11,483
- − Property taxes
- −$1,473
- − Insurance
- −$1,025
- − Repairs & maintenance
- −$1,870
- − Management
- −$1,870
- − Depreciation
- −$5,964
- Taxable loss
- −$314
- Est. tax savings @ 24.0%
- +$75
- After-tax cash flow
- $3,139/yr
For passive investors: Depreciation is non-cash, so a rental often shows a tax loss while cash-flowing — sheltering income. Rental losses are passive: they offset passive income freely, and up to $25,000/yr can offset ordinary (W-2) income if you actively participate and your MAGI is under $100k (phasing out to $0 by $150k); unused losses carry forward. On sale, claimed depreciation is recaptured at up to 25%, and gains may owe capital-gains tax (a 1031 exchange can defer both). Figures are a year-1 estimate at your 24.0% rate — not tax advice; consult a CPA.
Schools (NCES district)
- District
- Montgomery County
- NCES district ID
- 0102430
- Math proficiency
- 9% ▼ -21.00%
- Reading proficiency
- 31% ▼ -1.00%
- Median HH income
- $43,902
- Composite
- 17.24/100
- National rank
- #9093
- State rank
- #106 of 129 in AL
Livability — Montgomery
- Score
- 65/100
- State rank
- #138
- US rank
- #13416
Category grades
Schools grade is shown separately in the Schools card above.
Census & demographics
- Census place
- Montgomery, AL
- County
- Montgomery County · 190,016 people
- City population
- 175,913
- Metro
- Montgomery, AL
- Population (ZIP)
- 45,250
- Household income
- $55,160
- Rent vs Own
- Severe rent burden
- 2786.0
Population outlook (Montgomery County) Hauer SSP2
- Today (2025)
- 224,008 people
- By 2030
- 221,460 · -1.1%
- By 2040
- 214,179 · -4.4%
- By 2050
- 204,912 · -8.5%
- By 2075
- 177,821 · -20.6%
- By 2100
- 145,134 · -35.2%
Race, ethnicity, and origin ACS 2023
- Neighborhood character
- Predominantly Black (80%)
- Race & ethnicity
- Black 80% White 12% Two or more races 4% Asian 3% Hispanic / Latino 2%
- Common ancestry
- Italian 1%
- Foreign-born
- 5% · Canada, South Korea
- Languages at home
- 94% English-only · Spanish 2% Other Indo-European 1% Korean 1%
Political lean MEDSL · Montgomery
- 2024 margin
- Solid D (+30.7) · D 64.8% · R 34.1% · Other 1.1%
- 2008→2024 swing
- +11.5pp toward D · 2008: 19.2pp · 2024: 30.7pp
- All cycles
- 2024: D+30.7 2020: D+31.5 2016: D+26.2 2012: D+24.3 2008: D+19.2
Not yet ingested
- Civics
- —
Market trends
- HPI YoY
- ▼ -16.31%
- Current HPI
- 151.8598
- Rent YoY
- ▲ 5.65%
- Metro
- Montgomery, AL
- State GDP YoY
- ▲ 2.94%
- F500 in state
- 4
Industry mix (Fortune 500 HQ in AL)
| Industry | F500 HQs | Revenue |
|---|---|---|
| Financial Services | 1 | $8B |
|
||
| Healthcare | 1 | $5B |
|
||
Price history
+14.6% since first listed7 events — show timeline
- 2026-05-18 Listed $205,000 MAAR
- 2010-12-07 Sold (MLS) $80,000 MAAR
- 2010-05-03 Listed $84,900 MAAR
- 2009-10-05 Listed $155,000 MAAR
- 2008-02-11 Listed $179,712 MAAR
- 2007-08-08 Listed $169,000 MAAR
- 1996-09-07 Listed $178,900 MAAR
Property tax history
+12.3%/yrLatest (2023): $1,473 · +39.7% YoY. Source: county tax records.
Cash-flow waterfall
monthlySold comps — $/sqft
last 12 mo · ≤1 miLoading sold comps…