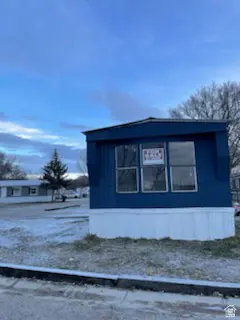
1265 N Corbonville Rd #100 · Carbonville, UT
Flood risk 1/10 · Minimal
- FEMA flood zone
- X (unshaded)
- Chance of flooding over 30 yrs
- 0.0%
- Est. flood insurance / yr
- $507 – $1,088
Fire risk 6/10 · Moderate
- Est. fire insurance / yr
- $453 – $841
Heat risk 3/10 · Minor
- Hot days now (above 92°F)
- 4 days/yr
- Hot days in 30 yrs
- 11 days/yr
Wind risk 1/10 · Minimal
- Chance of severe wind over 30 yrs
- —
Air-quality risk 2/10 · Minimal
- Unhealthy air days now
- 1 days/yr
- Unhealthy air days in 30 yrs
- 2 days/yr
Risk factors via First Street. Map © Google.
Why this score? — see what drove the B grade
The composite is a weighted blend of 9 inputs, each scored 0–100. Each bar is that input's sub-score; the figure is the points it added to the 100-point composite (weight × sub-score).
- Cash flow +30.0/30.0
- 1% rule +10.0/10.0
- DSCR +10.0/10.0
- ARV discount +7.5/15.0
- Condition / age +3.8/5.0
- Schools +3.4/10.0
- Livability +3.3/5.0
- Rent growth +2.5/5.0
- Appreciation +0.0/10.0
$36,000
🖨 Deal sheet 📄 Offer letter ✓ Due diligence
Listing remarks MLS
Recently remodeled 1982 home. 3 bedroom and 1.5 bath. Sold as is. New metal roof, new furnace, new flooring. Come see this home and make it yours. Located in a desired area in Carbonville. Just minutes from grocery store, parks, trails, shopping and more. Come see it before it's gone. Square footage provided from building records and as a curtesy only, Buyer and Buyer's agent to verify all information. Easy and now more affordable financing call us for details.
Key facts
- New metal roof
- New furnace
- Minutes from trails
Tags
Neighborhood map
What this means for you Summary
Snapshot
- This is a 3-bed/1.5-bath manufactured listed at $36k. Condition is rated good.
Deal economics
- At list price, monthly cash flow is $266 ($3k/yr) — positive.
- The deal already cash-flows at list — no discount required.
- Meets the 1% rule at list price ($1k rent vs $36k).
- Recommended offer: $33k (9.0% below list) — sets the bar for market timing.
Location & tenants
- Location reads 66/100 on livability (#146 in UT) — a middle-class / working-renter tenant base. Strengths: crime A+, cost of living A+, housing A+; Watch: schools F, amenities F, commute F.
- Carbon District (town): math 36% / reading 43% proficiency, ranked #53 of 80 in UT (top 66%) — families likely to look elsewhere, expect single-tenant / working-renter base with shorter leases.
- Market conditions: 146 active listings in the ZIP; 196 units permitted in Carbon County in 2024 (168 in 5+ unit buildings).
Forward outlook
- Local home prices are declining (-3.0%/yr); year-one equity from $249 of loan paydown is wiped out by about $1k of value loss. Plan a longer hold.
- Carbon County population projected at -22% by 2050 — secular population decline; favor cash flow + early exit over multi-decade hold.
- At projected returns (-3.0% appreciation + 3.0% rent growth), your $10k cash investment doubles in ~4 years — after that, you're playing with house money.
Negotiation context
- It's been on market 111 days — a 9% lower offer ($33k) is reasonable based on typical stale-listing flexibility.
Risks & watch-outs
- Watch-outs: HOA is 35% of rent.
- Climate carrying-cost: major wildfire risk — expect insurance premiums to compound above CPI over the hold.
Questions for the listing agent
- It's been on market 111 days. Have you received any prior offers? Is the seller open to a 9% concession, seller financing, or rate buy-down credit?
- What does the HOA fee cover, when was the last increase, and are there any pending special assessments or reserve-fund shortfalls?
- Why hasn't it sold? Are there any deal-killer items the seller is aware of (foundation, flood, title, zoning, code violations)?
- Is there a deadline driving the sale (1031 exchange, divorce, estate, relocation)? That informs how much negotiation room exists.
- Schools are F-rated, which usually means shorter tenancies and higher turnover. Who's the typical renter profile here, and what's been the actual vacancy rate?
- What's the average days-on-market for RENTAL listings here right now (not sales)? A rising rental-DOM trend means longer vacancies and softer asking-rent achievability than the comps imply.
- What's the recent tenant-quality profile in this submarket — average credit score on applications, eviction rate, late-payment / NSF rate, and stable-employment percentage? A property-management company in the area should have these aggregated.
- How much new for-sale + rental construction is in the pipeline within 1–3 miles? Heavy new supply typically softens prices + rents 12–24 months out; constrained supply supports both.
Investment metrics
- 1% rule
- 3.25% ✓
- Cap rate
- 15.16%
- Cash-on-cash
- 31.65%
- DSCR
- 2.41
- GRM
- 2.6
CMA / ARV
No comps found within radius.
Projected returns pro-forma
-3.0% appreciation · 3.0% rent growth · sell at horizon
- IRR
- 27.0%
- Equity multiple
- 2.13×
- Total profit
- $11,369
- Equity at exit
- $5,368
- IRR
- 34.8%
- Equity multiple
- 4.25×
- Total profit
- $32,800
- Equity at exit
- $3,113
Cash invested: $10,080 (down + closing). Projections, not guarantees.
Landlord ↔ Tenant lean methodology
- Overall (STATE)
- 86 Strongly Landlord-Friendly
- State Utah
- 86 Strongly Landlord-Friendly · R+15
- County
- — inherits STATE
- City
- — inherits STATE
ZIP-level market 84501
- Active inventory
- 146
- Price-to-rent
- 2.6×
Monthly cashflow live
- Estimated rent
- $1,170 medium interval (Pro) →
- Mortgage (P&I)
- −$189
- Tax est. 1.5%
- −$45 /mo · $540/yr
- Insurance
- −$15
- HOA
- −$410
- Vacancy / Maint / Mgmt
- −$246
- Net cashflow
- $266
Break-even live
UW: 25.0% down · 7.5% · 30yr · 1.5% tax · 5.0% vac · 8.0% maint · 8.0% mgmt
Financing live
Cash to close
- Down payment
- $9,000
- Closing costs
- $1,080
- Reserves months
- —
- Total cash needed
- —
Loan-product check · same deal, 3 products live
Conventional
25% down · 7.5% · 30yr
- Down + closing
- —
- Monthly P&I
- —
- Monthly cashflow
- —
- DSCR
- —
- Eligible?
- —
Personal DTI + credit; lowest rate.
DSCR
20% down · 8.5% · 30yr
- Down + closing
- —
- Monthly P&I
- —
- Monthly cashflow
- —
- DSCR
- —
- Eligible?
- —
No personal income docs; deal must DSCR.
Hard money
10% down · 12.0% · 12mo
- Down + closing
- —
- Monthly P&I
- —
- Monthly cashflow
- —
- DSCR
- —
- Eligible?
- —
Short-term bridge; refi at stabilization.
HOA detail
- Monthly dues
- $410 · $4,920/yr
Listing history 14 events
-
2026-06-15days on market $36,000 Active 111 DOM
-
2026-06-14days on market $36,000 Active 109 DOM
-
2026-06-10days on market $36,000 Active 106 DOM
-
2026-06-09days on market $36,000 Active 105 DOM
-
2026-06-08days on market $36,000 Active 104 DOM
-
2026-06-07days on market $36,000 Active 103 DOM
-
2026-06-03days on market $36,000 Active 99 DOM
-
2026-06-02days on market $36,000 Active 98 DOM
-
2026-06-01days on market $36,000 Active 97 DOM
-
2026-05-31days on market $36,000 Active 96 DOM
-
2026-05-31days on market $36,000 Active 95 DOM
-
2026-05-02price $36,000 465-char remark
Show marketing remark (465 chars)
Recently remodeled 1982 home. 3 bedroom and 1.5 bath. Sold as is. New metal roof, new furnace, new flooring. Come see this home and make it yours. Located in a desired area in Carbonville. Just minutes from grocery store, parks, trails, shopping and more. Come see it before it's gone. Square footage provided from building records and as a curtesy only, Buyer and Buyer's agent to verify all information. Easy and now more affordable financing call us for details.
-
2026-03-14price $49,999 465-char remark
Show marketing remark (465 chars)
Recently remodeled 1982 home. 3 bedroom and 1.5 bath. Sold as is. New metal roof, new furnace, new flooring. Come see this home and make it yours. Located in a desired area in Carbonville. Just minutes from grocery store, parks, trails, shopping and more. Come see it before it's gone. Square footage provided from building records and as a curtesy only, Buyer and Buyer's agent to verify all information. Easy and now more affordable financing call us for details.
-
2026-02-24$59,999 Active 465-char remark
Show marketing remark (465 chars)
Recently remodeled 1982 home. 3 bedroom and 1.5 bath. Sold as is. New metal roof, new furnace, new flooring. Come see this home and make it yours. Located in a desired area in Carbonville. Just minutes from grocery store, parks, trails, shopping and more. Come see it before it's gone. Square footage provided from building records and as a curtesy only, Buyer and Buyer's agent to verify all information. Easy and now more affordable financing call us for details.
ⓘ Source: listings_history table (triggers on properties + properties_extension) + one-shot
backfill from property_details.listing_events for pre-trigger history.
Climate risk First Street
- Flood 1/10 Low FEMA zone X (unshaded) · 0% chance over 30 yrs
- Wildfire 6/10 Major
- Heat 3/10 Moderate 4 d/yr ≥92°F today · 11 d/yr by 30 yrs out
- Wind 1/10 Low
- Air quality 2/10 Low 1 unhealthy d/yr today · 2 by 30 yrs out
Nearby sold comps map
Loading sold comps map…
Walkable amenities ~0.75 mi
Loading nearby amenities…
Taxation est. · year 1
- Rental income
- $14,045
- − Mortgage interest
- −$2,017
- − Property taxes
- −$540
- − Insurance
- −$180
- − Repairs & maintenance
- −$1,124
- − Management
- −$1,124
- − HOA
- −$4,920
- − Depreciation
- −$1,047
- Taxable income
- $3,094
- Est. tax owed @ 24.0%
- −$743
- After-tax cash flow
- $2,448/yr
For passive investors: Depreciation is non-cash, so a rental often shows a tax loss while cash-flowing — sheltering income. Rental losses are passive: they offset passive income freely, and up to $25,000/yr can offset ordinary (W-2) income if you actively participate and your MAGI is under $100k (phasing out to $0 by $150k); unused losses carry forward. On sale, claimed depreciation is recaptured at up to 25%, and gains may owe capital-gains tax (a 1031 exchange can defer both). Figures are a year-1 estimate at your 24.0% rate — not tax advice; consult a CPA.
Condition & rehab AI · 11 photos
This recently remodeled 1982 manufactured home is in good condition with a new metal roof and furnace. It has potential for further updates to enhance its resale and rental value.
Repairs flagged
- Minor kitchen cabinets — slight wear
- Minor bathroom fixtures — standard, no visible damage
- Minor interior walls — paint appears worn
Value-add opportunities
- Resale paint interior walls — enhances curb appeal
- Rental replace carpet in living areas — improves comfort and appearance
Renovation cost estimate screening
| Repair item | Severity | Est. cost |
|---|---|---|
| kitchen cabinets · slight wear | Minor | $500–3,000 |
| bathroom fixtures · standard, no visible damage | Minor | $500–3,000 |
| interior walls · paint appears worn | Minor | $500–3,000 |
| Total estimated repair cost · 3 items | $1,500–9,000 |
Value-add ROI direction
- Resale paint interior walls — enhances curb appeal ↑
- Rental replace carpet in living areas — improves comfort and appearance ↑
ⓘ Cost ranges are severity-bucket heuristics (US national rule-of-thumb). Get contractor quotes + a written scope before underwriting a rehab budget.
Schools (NCES district)
- District
- Carbon District
- NCES district ID
- 4900150
- Math proficiency
- 36% ▼ -7.00%
- Reading proficiency
- 43% ▼ -4.00%
- Median HH income
- $45,189
- Composite
- 33.6/100
- National rank
- #5416
- State rank
- #53 of 80 in UT
Livability — Carbonville
- Score
- 66/100
- State rank
- #146
- US rank
- #12131
Category grades
Schools grade is shown separately in the Schools card above.
Census & demographics
- Census place
- Carbonville, UT
- Population (ZIP)
- 13,002
Population outlook (Carbon County) Hauer SSP2
- Today (2025)
- 18,972 people
- By 2030
- 18,081 · -4.7%
- By 2040
- 16,260 · -14.3%
- By 2050
- 14,895 · -21.5%
- By 2075
- 13,123 · -30.8%
- By 2100
- 13,066 · -31.1%
Race, ethnicity, and origin ACS 2023
- Neighborhood character
- Predominantly White (81%)
- Race & ethnicity
- White 81% Hispanic / Latino 14% Two or more races 7%
- Hispanic origin (detail)
- Mexican 12%
- Common ancestry
- Italian 3% Scottish 2% Slovak 2%
- Foreign-born
- 3% · Canada
- Languages at home
- 93% English-only · Spanish 6% Other Indo-European 1%
Political lean MEDSL · Carbon
- 2024 margin
- Solid R (+44.4) · D 26.7% · R 71.1% · Other 2.1%
- 2008→2024 swing
- -36.4pp toward R · 2008: -8.0pp · 2024: -44.4pp
- All cycles
- 2024: R+44.4 2020: R+45.9 2016: R+44.6 2012: R+36.4 2008: R+8.0
Not yet ingested
- Civics
- —
Market trends
- HPI YoY
- ▼ -119.96%
- Current HPI
- 222.2891
- Rent YoY
- —
- Metro
- —
- State GDP YoY
- ▲ 3.54%
- F500 in state
- 2
Industry mix (Fortune 500 HQ in UT)
| Industry | F500 HQs | Revenue |
|---|---|---|
| Financial Services | 1 | $3B |
|
||
Price history
-40.0% since first listed3 events — show timeline
- 2026-05-02 Price Changed $36,000 WFRMLS
- 2026-03-14 Price Changed $49,999 WFRMLS
- 2026-02-24 Listed $59,999 WFRMLS
Cash-flow waterfall
monthlySold comps — $/sqft
last 12 mo · ≤1 miLoading sold comps…