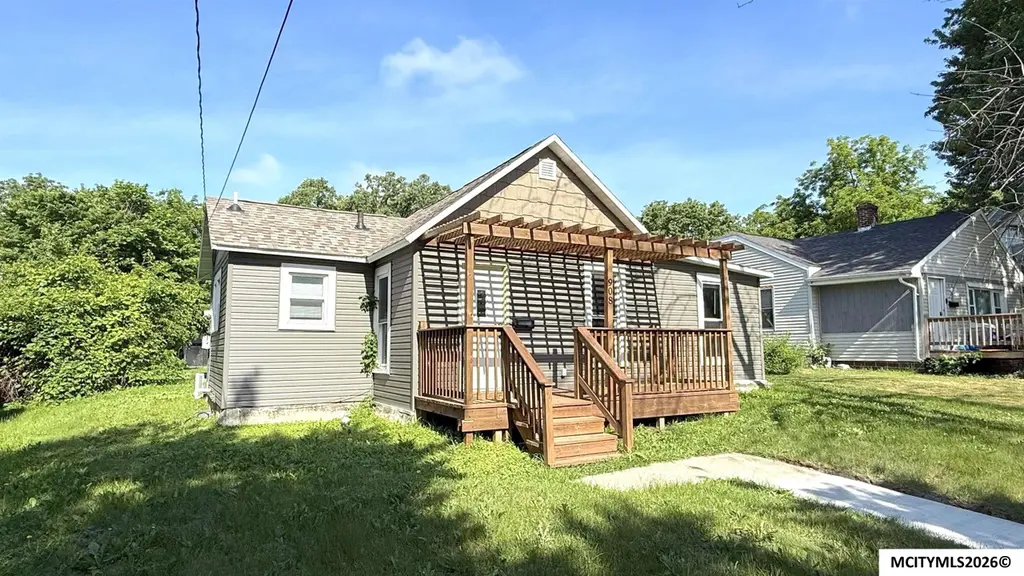
908 N Pennsylvania Ave · Mason City, IA
Flood risk 1/10 · Minimal
- FEMA flood zone
- X (unshaded)
- Chance of flooding over 30 yrs
- 0.0%
- Est. flood insurance / yr
- $473 – $860
Fire risk 3/10 · Minor
- Est. fire insurance / yr
- $902 – $1,676
Heat risk 2/10 · Minimal
- Hot days now (above 101°F)
- 7 days/yr
- Hot days in 30 yrs
- 16 days/yr
Wind risk 2/10 · Minimal
- Chance of severe wind over 30 yrs
- —
Air-quality risk 1/10 · Minimal
- Unhealthy air days now
- 0 days/yr
- Unhealthy air days in 30 yrs
- 0 days/yr
Risk factors via First Street. Map © Google.
Why this score? — see what drove the B+ grade
The composite is a weighted blend of 9 inputs, each scored 0–100. Each bar is that input's sub-score; the figure is the points it added to the 100-point composite (weight × sub-score).
- Cash flow +30.0/30.0
- ARV discount +14.1/15.0
- DSCR +10.0/10.0
- 1% rule +9.2/10.0
- Schools +4.5/10.0
- Livability +4.0/5.0
- Rent growth +2.5/5.0
- Condition / age +2.5/5.0
- Appreciation +0.0/10.0
$90,000
🖨 Deal sheet 📄 Offer letter ✓ Due diligence
Listing remarks MLS
Forget cookie-cutter when you can have character, updates, and a backyard that feels like your own private park! Framed by a newer pergola and welcoming deck, this refreshed home blends comfort with practical improvements already in place. Inside, newer flooring creates a clean, modern feel while bright windows fill the living spaces with natural light. The kitchen and dining area offer an easy flow for everyday living, and the bedrooms provide comfortable retreats at the end of the day. Major exterior updates include newer siding, roof, windows, and central A/C, helping take some of the guesswork out of homeownership. A newer sidewalk and front walkway lead directly to the house, adding convenience and curb appeal from the moment you arrive. Out back, the oversized yard offers room to garden, entertain, play, or simply relax, while the detached two-stall garage provides valuable storage and workspace. Come see what makes this one stand out! Theres space here to grow, gather, and enjoy
Key facts
- Newer pergola
- Newer flooring
- Welcoming deck
Tags
Property features AI
Finance
- Other: Residential property (Single Family Residence)
Exterior
- Parking: Detached 2-car garage with asphalt driveway
- Security: Smoke detector(s)
- Utilities: Public water; Public sewer
- Home design: Single-family residence; 1 story
- Construction: Frame construction with metal siding; Asphalt roof; Has partial basement
- Exterior features: Patio; Lot approximately 52 x 164; Zoning: Z2 - Sub-Urban District
Interior
- Kitchen: Gas Range, Microwave, Refrigerator
- Bedrooms: 1 main-level bedroom
- Flooring: Carpet; Laminate; Vinyl
- Bathrooms: 2 main-level bathrooms
- Heating & cooling: Central air; Forced air heating (natural gas)
- Interior features: Gas Range, Microwave, Refrigerator; Carpet, Laminate, Vinyl flooring; Partial basement; Central air; Forced air heating (natural gas)
Neighborhood map
What this means for you Summary
Snapshot
- This is a 2-bed/1.0-bath single-family listed at $90k.
Deal economics
- At list price, monthly cash flow is $413 ($5k/yr) — positive.
- The deal already cash-flows at list — no discount required.
- Meets the 1% rule at list price ($1k rent vs $90k).
- Cap rate 11.8% vs local median 5.2% in Mason City — top-decile yield for the area; either an underpriced asset or a hidden risk that comps aren't pricing in. Stress-test before assuming the spread holds.
Location & tenants
- Location reads 81/100 on livability (#67 in IA, #1,477 nationally) — a professional / high-income tenant draw. Strengths: commute A+, cost of living A+, housing A+; Watch: amenities F.
- Mason City Community School District (town): math 50% / reading 58% proficiency, ranked #271 of 289 in IA (top 94%) — acceptable for families but not a draw, mixed tenant base, ~2y average lease.
- Market conditions: 153 active listings in the ZIP; 2 comparable units currently listed for rent nearby; 54 units permitted in Cerro Gordo County in 2024 (6 in 5+ unit buildings).
Forward outlook
- Local home prices are declining (-3.0%/yr); year-one equity from $622 of loan paydown is wiped out by about $3k of value loss. Plan a longer hold.
- Cerro Gordo County population projected at -18% by 2050 — secular population decline; favor cash flow + early exit over multi-decade hold.
- At projected returns (-3.0% appreciation + 3.0% rent growth), your $25k cash investment doubles in ~7 years — after that, you're playing with house money.
Negotiation context
- Only 8 days on market — expect competitive offers; lowballing is unlikely to land.
- 3 sale attempts since 7y ago with the ask held roughly flat each time — persistent listings suggest the price (not the market) is what's stuck; bring a comps-based counter.
- Current owner paid $49k; list at $90k implies a 84% gain — meaningful room to come down on a strong offer.
Risks & watch-outs
- Watch-outs: built in 1910 — expect roof / HVAC / electrical / plumbing capex.
Questions for the listing agent
- Built in 1910 — when were the roof, HVAC, electrical panel, plumbing, and water heater last replaced?
- Is there a deadline driving the sale (1031 exchange, divorce, estate, relocation)? That informs how much negotiation room exists.
- What's the average days-on-market for RENTAL listings here right now (not sales)? A rising rental-DOM trend means longer vacancies and softer asking-rent achievability than the comps imply.
- What's the recent tenant-quality profile in this submarket — average credit score on applications, eviction rate, late-payment / NSF rate, and stable-employment percentage? A property-management company in the area should have these aggregated.
- How much new for-sale + rental construction is in the pipeline within 1–3 miles? Heavy new supply typically softens prices + rents 12–24 months out; constrained supply supports both.
Investment metrics
- 1% rule
- 1.42% ✓
- Cap rate
- 11.80%
- Cash-on-cash
- 19.65%
- DSCR
- 1.87
- GRM
- 5.9
CMA / ARV
- ARV (on-the-fly)
- $105,512
- Comps found
- 11
Show comp detail 11 sales within ~0.75 mi
| Address | Dist | Beds/Ba | Sqft | Sold | Price | $/sf | Match |
|---|---|---|---|---|---|---|---|
| 311 10th St NE | 0.13mi | 2/1.0 | 1,001 (+15%) | 8mo | $110,000 | $110 | 63 |
| 1012 Elm Dr Dr | 0.16mi | 1/1.0 (-1) | 832 (-5%) | 23mo | $65,000 | $78 | 61 |
| 311 14th St NW | 0.53mi | 3/2.0 (+1) | 869 (-0%) | 10mo | $50,000 | $58 | 57 |
| 711 N Van Buren Ave | 0.75mi | 3/1.2 (+1) | 896 (+3%) | 1mo | $126,000 | $141 | 54 |
| 650 13th St NE | 0.53mi | 3/1.0 (+1) | 864 (-1%) | 18mo | $86,400 | $100 | 53 |
| 1008 N Hampshire Ave | 0.51mi | 2/0.8 | 784 (-10%) | 7mo | $128,500 | $164 | 52 |
| 832 9th St NE | 0.71mi | 2/1.0 | 962 (+10%) | 1mo | $117,500 | $122 | 49 |
| 808 9th St NE | 0.65mi | 2/1.0 | 778 (-11%) | 5mo | $94,000 | $121 | 48 |
| 929 N Van Buren Ave | 0.74mi | 2/1.0 | 816 (-6%) | 16mo | $142,000 | $174 | 42 |
| 1538 N Hampshire Ave | 0.74mi | 3/1.0 (+1) | 972 (+12%) | 7mo | $117,000 | $120 | 36 |
| 829 12th St NE | 0.72mi | 2/1.0 | 766 (-12%) | 22mo | $125,000 | $163 | 28 |
Match score weights: distance 35% · size 25% · config 20% · recency 20%. Top-matched comps best support the ARV.
Projected returns pro-forma
-3.0% appreciation · 3.0% rent growth · sell at horizon
- IRR
- 11.7%
- Equity multiple
- 1.46×
- Total profit
- $11,706
- Equity at exit
- $13,419
- IRR
- 20.7%
- Equity multiple
- 2.75×
- Total profit
- $44,053
- Equity at exit
- $7,782
Cash invested: $25,200 (down + closing). Projections, not guarantees.
Landlord ↔ Tenant lean methodology
- Overall (STATE)
- 83 Strongly Landlord-Friendly
- State Iowa
- 83 Strongly Landlord-Friendly · R+6
- County
- — inherits STATE
- City
- — inherits STATE
ZIP-level market 50401
- Active inventory
- 153
- Price-to-rent
- 5.9×
Monthly cashflow live
- Estimated rent
- $1,275 medium interval (Pro) →
- Mortgage (P&I)
- −$472
- Tax from tax record
- −$85 /mo · $1,020/yr
- Insurance
- −$38
- HOA
- −$0
- Vacancy / Maint / Mgmt
- −$268
- Net cashflow
- $413
Break-even live
UW: 25.0% down · 7.5% · 30yr · 1.5% tax · 5.0% vac · 8.0% maint · 8.0% mgmt
Financing live
Cash to close
- Down payment
- $22,500
- Closing costs
- $2,700
- Reserves months
- —
- Total cash needed
- —
Loan-product check · same deal, 3 products live
Conventional
25% down · 7.5% · 30yr
- Down + closing
- —
- Monthly P&I
- —
- Monthly cashflow
- —
- DSCR
- —
- Eligible?
- —
Personal DTI + credit; lowest rate.
DSCR
20% down · 8.5% · 30yr
- Down + closing
- —
- Monthly P&I
- —
- Monthly cashflow
- —
- DSCR
- —
- Eligible?
- —
No personal income docs; deal must DSCR.
Hard money
10% down · 12.0% · 12mo
- Down + closing
- —
- Monthly P&I
- —
- Monthly cashflow
- —
- DSCR
- —
- Eligible?
- —
Short-term bridge; refi at stabilization.
Rent comps 2 comps
| Address | Beds | Baths | Sqft | Rent | $/sqft | DOM | Units | Dist |
|---|---|---|---|---|---|---|---|---|
| 110 N Delaware Ave Unit 211 Mason City, IA | 2.0 | 1.0 | 919 | $1,395 | $1.52 | 43d | 1 | 0.49mi |
| 110 N Delaware Ave Unit 208 Mason City, IA | 1.0 | 1.0 | 552 | $1,095 | $1.98 | 43d | 1 | 0.49mi |
Listing history 7 events
-
2026-06-18days on market $90,000 Active 8 DOM
-
2026-06-17days on market $90,000 Active 7 DOM
-
2026-06-16days on market $90,000 Active 6 DOM
-
2026-06-15days on market $90,000 Active 5 DOM
-
2026-06-13days on market $90,000 Active 3 DOM
-
2026-06-12remarks 699-char remark
-
2026-06-12$90,000 Active 2 DOM
ⓘ Source: listings_history table (triggers on properties + properties_extension) + one-shot
backfill from property_details.listing_events for pre-trigger history.
Tax reassessment forecast IA · Partial reset (capped growth)
- Current annual tax
- $1,020 · $85/mo
- Projected year-2 tax
- $1,216 · $101/mo
- Expected delta
- +$196/yr (+$16/mo · 19.3%)
ⓘ Screening estimate from a state-policy table — verify with the county assessor before closing.
Climate risk First Street
- Flood 1/10 Low FEMA zone X (unshaded) · 0% chance over 30 yrs
- Wildfire 3/10 Moderate
- Heat 2/10 Low 7 d/yr ≥101°F today · 16 d/yr by 30 yrs out
- Wind 2/10 Low
- Air quality 1/10 Low 0 unhealthy d/yr today · 0 by 30 yrs out
Nearby sold comps map
Loading sold comps map…
Walkable amenities ~0.75 mi
Loading nearby amenities…
Taxation est. · year 1
- Rental income
- $15,299
- − Mortgage interest
- −$5,041
- − Property taxes
- −$1,020
- − Insurance
- −$450
- − Repairs & maintenance
- −$1,224
- − Management
- −$1,224
- − Depreciation
- −$2,618
- Taxable income
- $3,722
- Est. tax owed @ 24.0%
- −$893
- After-tax cash flow
- $4,060/yr
For passive investors: Depreciation is non-cash, so a rental often shows a tax loss while cash-flowing — sheltering income. Rental losses are passive: they offset passive income freely, and up to $25,000/yr can offset ordinary (W-2) income if you actively participate and your MAGI is under $100k (phasing out to $0 by $150k); unused losses carry forward. On sale, claimed depreciation is recaptured at up to 25%, and gains may owe capital-gains tax (a 1031 exchange can defer both). Figures are a year-1 estimate at your 24.0% rate — not tax advice; consult a CPA.
Schools (NCES district)
- District
- Mason City Community School District
- NCES district ID
- 1918780
- Math proficiency
- 50% ▼ -1.00%
- Reading proficiency
- 58% ▼ -7.00%
- Median HH income
- $43,668
- Composite
- 45.47/100
- National rank
- #2614
- State rank
- #271 of 289 in IA
Livability — Mason City
- Score
- 81/100
- State rank
- #67
- US rank
- #1477
Category grades
Schools grade is shown separately in the Schools card above.
Census & demographics
- Census place
- Mason City, IA
- City population
- 28,818
- Population (ZIP)
- 28,818
Population outlook (Cerro Gordo County) Hauer SSP2
- Today (2025)
- 41,080 people
- By 2030
- 39,746 · -3.2%
- By 2040
- 36,608 · -10.9%
- By 2050
- 33,682 · -18.0%
- By 2075
- 29,702 · -27.7%
- By 2100
- 27,399 · -33.3%
Race, ethnicity, and origin ACS 2023
- Neighborhood character
- Predominantly White (87%)
- Race & ethnicity
- White 87% Hispanic / Latino 6% Two or more races 5% Black 3% Asian 1%
- Hispanic origin (detail)
- Mexican 5%
- Common ancestry
- Portuguese 12% Iranian 2% Lithuanian 2%
- Foreign-born
- 2% · Canada, Vietnam
- Languages at home
- 96% English-only · Spanish 3% Other Asian/Pacific 1%
Political lean MEDSL · Cerro Gordo
- 2024 margin
- R (+11.7) · D 43.4% · R 55.0% · Other 1.6%
- 2008→2024 swing
- -32.5pp toward R · 2008: 20.8pp · 2024: -11.7pp
- All cycles
- 2024: R+11.7 2020: R+6.3 2016: R+7.7 2012: D+13.2 2008: D+20.8
Not yet ingested
- Civics
- —
Market trends
- HPI YoY
- ▼ -130.01%
- Current HPI
- 199.1966
- Rent YoY
- —
- Metro
- —
- State GDP YoY
- ▲ 2.48%
- F500 in state
- 4
Industry mix (Fortune 500 HQ in IA)
| Industry | F500 HQs | Revenue |
|---|---|---|
| Financial Services | 1 | $16B |
|
||
| Retail / Convenience | 1 | $15B |
|
||
Price history
+133.8% since first listed7 events — show timeline
- 2026-06-10 Listed $90,000 IAR
- 2026-06-10 Listed $90,000 Greater Mason BOR
- 2024-01-30 Sold (Public Records) $49,000 Public Records
- 2019-10-11 Sold (Public Records) $29,500 Public Records
- 2019-10-07 Sold (Public Records) $29,500 Public Records
- 2019-09-23 Sold (MLS) $29,500 Greater Mason BOR
- 2019-04-10 Listed $38,500 Greater Mason BOR
Property tax history
+5.9%/yrLatest (2025): $1,020 · +2.8% YoY. Source: county tax records.
Cash-flow waterfall
monthlySold comps — $/sqft
last 12 mo · ≤1 miLoading sold comps…