272 Huguenot Trl Unit Ll365 · Charleston, SC
Flood risk No data
- FEMA flood zone
- —
- Chance of flooding over 30 yrs
- —
- Est. flood insurance / yr
- —
Fire risk No data
- Est. fire insurance / yr
- —
Heat risk No data
- Hot days now (above threshold)
- —
- Hot days in 30 yrs
- —
Wind risk No data
- Chance of severe wind over 30 yrs
- —
Air-quality risk No data
- Unhealthy air days now
- —
- Unhealthy air days in 30 yrs
- —
Risk factors via First Street. Map © Google.
Why this score? — see what drove the F grade
The composite is a weighted blend of 9 inputs, each scored 0–100. Each bar is that input's sub-score; the figure is the points it added to the 100-point composite (weight × sub-score).
- ARV discount +7.7/15.0
- Cash flow +4.6/30.0
- Appreciation +4.4/10.0
- Livability +3.8/5.0
- Schools +3.6/10.0
- Rent growth +2.5/5.0
- Condition / age +1.0/5.0
- 1% rule +0.7/10.0
- DSCR +0.0/10.0
$521,990
🖨 Deal sheet 📄 Offer letter ✓ Due diligence
Listing remarks
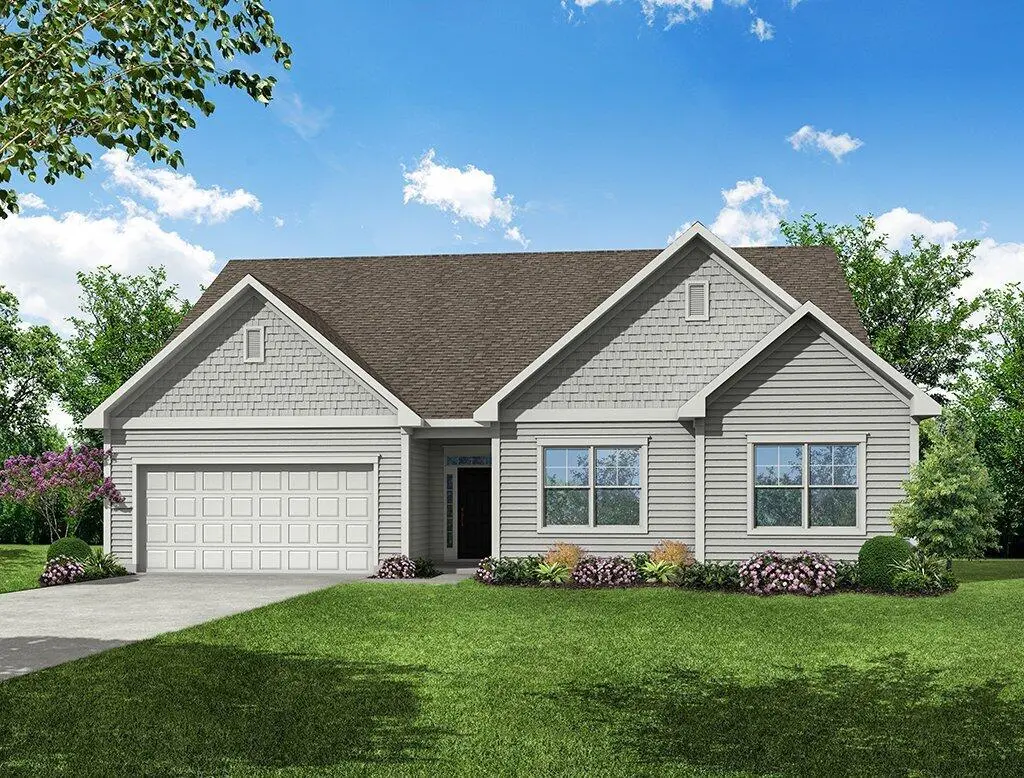
FINAL PHASE 2 PRICING BUILD LOT! Welcome Home to Enclave at French Quarter Creek! Beautiful ranch home community, nestled along outskirts of Francis Marion National Forest, minutes to nearby Mount Pleasant shopping/dining/recreation & quick access to both Wando & Cooper River. * * Proposed Construction - List price includes base price & lot premium. Buyer will have opportunity for personalized design appointment * * The Alexandria is a 3BR/2.5 Bath ranch-style home w/ spacious family room, rear facing kitchen, center island, oversized pantry and covered rear patio. Options to personalize your home at additional cost such as office with French doors in lieu of bedroom th
Key facts
- Rear facing kitchen
- Ranch home community
- Covered rear patio
Tags
Property features AI
Finance
- HOA & community: Annual association fee; Community pool
Exterior
- Parking: 2-car garage
- Utilities: Septic tank; BCW & SA water; Berkeley Electric Cooperative power; Dominion Energy
- Home design: Single family detached residential home; One story; Ground level entry; Fee simple ownership
- Construction: Architectural asphalt roof
- Exterior features: Lawn irrigation; Rain gutters; Pond site
Interior
- Kitchen: Dishwasher; Disposal; Electric range; Microwave; Kitchen island; Pantry; Eat-in kitchen
- Bedrooms: 3 bedrooms; Primary bedroom located on lower level with garden tub/shower and walk-in closet(s)
- Flooring: Carpet; Ceramic tile; Luxury vinyl
- Bathrooms: 2.5 bathrooms (3 total)
- Heating & cooling: Central air conditioning; Forced air heating; Natural gas heating
- Interior features: Smooth ceilings; High ceilings; Garden tub/shower; Kitchen island; Walk-in closets; Eat-in kitchen; Family room; Entrance foyer; Pantry
- Laundry & utility: Laundry room with washer hookup and electric dryer hookup; Tankless water heater
Neighborhood map
What this means for you Summary
Snapshot
- This is a 3-bed/2.5-bath single-family listed at $522k. Condition is rated poor.
Deal economics
- At list price, monthly cash flow is $-1k ($-16k/yr) — negative.
- To cash-flow at today's rent, offer at most $331k (36.7% below list).
- To meet the 1% rule (rent ≥ 1% of price), the offer needs to be $300k (42.6% below list).
- Recommended offer: $300k (42.6% below list) — sets the bar for 1% rule.
- Cap rate 3.3% vs local median 2.4% in Charleston — top-decile yield for the area; either an underpriced asset or a hidden risk that comps aren't pricing in. Stress-test before assuming the spread holds.
Location & tenants
- Location reads 76/100 on livability (#22 in SC, #3,336 nationally) — a middle-class / working-renter tenant base. Strengths: amenities A+, housing A+, health & safety A+; Watch: crime D+, commute F, cost of living D-.
- Berkeley 01 (suburban): math 35% / reading 48% proficiency, ranked #30 of 80 in SC (top 38%) — families likely to look elsewhere, expect single-tenant / working-renter base with shorter leases.
- Zoned schools: Cainhoy Elementary (math 2% / reading 12%, grade F, #594 of 597 statewide, top 100%, 154 students, 100% FRL); Philip Simmons Middle (math 31% / reading 48%, grade F, #82 of 229 statewide, top 37%, 428 students, 35% FRL); Philip Simmons High (math 42% / reading 92%, grade B, #73 of 196 statewide, top 41%, 771 students, 21% FRL) — zoned schools at 52% FRL track the district average.
- Market conditions: 69 active listings in the ZIP; 1 comparable units currently listed for rent nearby; 3,183 units permitted in Berkeley County in 2024 (580 in 5+ unit buildings).
Forward outlook
- Local home prices are declining (-1.1%/yr); year-one equity from $4k of loan paydown is wiped out by about $6k of value loss. Plan a longer hold.
- Berkeley County population projected at +48% by 2050 — long-run rental-demand tailwind backs the buy-and-hold thesis.
Negotiation context
- It's been on market 28 days — a 2% lower offer ($514k) is reasonable based on typical stale-listing flexibility.
Questions for the listing agent
- What do current leases actually rent for vs. the listed asking? Can we see a recent rent roll and the last 12 months of T-12 income?
- Have any recent inspections been done? Can we get a copy of the seller's disclosures and any deferred-maintenance estimates?
- What does the HOA fee cover, when was the last increase, and are there any pending special assessments or reserve-fund shortfalls?
- Is there a deadline driving the sale (1031 exchange, divorce, estate, relocation)? That informs how much negotiation room exists.
- Schools are A-rated — typically a magnet for longer-tenancy family renters. What's the average tenant stay here, and is there a school-zone premium baked into asking?
- Crime grade is D in this area — have there been break-ins, vandalism, or insurance claims at this property in the last 3 years? What carrier currently insures it and at what premium?
- The area grade is low — what's the realistic commute time and amenity access for the typical tenant pool here? Any planned neighborhood developments (good or bad) we should know about?
- What's the average days-on-market for RENTAL listings here right now (not sales)? A rising rental-DOM trend means longer vacancies and softer asking-rent achievability than the comps imply.
- What's the recent tenant-quality profile in this submarket — average credit score on applications, eviction rate, late-payment / NSF rate, and stable-employment percentage? A property-management company in the area should have these aggregated.
- How much new for-sale + rental construction is in the pipeline within 1–3 miles? Heavy new supply typically softens prices + rents 12–24 months out; constrained supply supports both.
Investment metrics
- 1% rule
- 0.57% ✗
- Cap rate
- 3.25%
- Cash-on-cash
- -10.86%
- DSCR
- 0.52
- GRM
- 14.5
CMA / ARV
- ARV (on-the-fly)
- $523,940
- Comps found
- 12
Show comp detail 12 sales within ~0.75 mi
| Address | Dist | Beds/Ba | Sqft | Sold | Price | $/sf | Match |
|---|---|---|---|---|---|---|---|
| 225 Huguenot Trl | 0.06mi | 3/2.5 | 1,955 (0%) | 6mo | $518,157 | $265 | 92 |
| 252 Huguenot Trl | 0.24mi | 3/2.5 | 1,955 (0%) | 4mo | $531,013 | $272 | 85 |
| 240 Silver Creek Dr | 0.56mi | 3/3.0 | 1,940 (-1%) | 3mo | $535,000 | $276 | 69 |
| 104 Wild Orchid Way | 0.71mi | 3/3.0 | 1,940 (-1%) | 9mo | $520,000 | $268 | 56 |
| 1146 Wading Point Blvd | 0.73mi | 4/3.0 (+1) | 1,940 (-1%) | 4mo | $529,000 | $273 | 54 |
| 317 Cypress Br | 0.68mi | 4/2.0 (+1) | 1,925 (-2%) | 6mo | $490,000 | $255 | 53 |
| 246 Silver Creek Dr | 0.58mi | 3/2.5 | 2,207 (+13%) | 1mo | $535,000 | $242 | 50 |
| 1173 Wading Point Blvd | 0.71mi | 4/2.0 (+1) | 1,871 (-4%) | 8mo | $505,000 | $270 | 46 |
| 312 Cypress Branch Rd | 0.66mi | 4/2.0 (+1) | 1,871 (-4%) | 12mo | $520,000 | $278 | 45 |
| 1144 Wading Point Blvd | 0.70mi | 3/2.5 | 2,188 (+12%) | 4mo | $525,000 | $240 | 44 |
| 308 Cypress Branch Rd | 0.69mi | 3/2.5 | 2,207 (+13%) | 7mo | $499,999 | $227 | 41 |
| 313 Cypress Branch Rd | 0.70mi | 3/2.5 | 2,190 (+12%) | 10mo | $515,000 | $235 | 39 |
Match score weights: distance 35% · size 25% · config 20% · recency 20%. Top-matched comps best support the ARV.
Projected returns pro-forma
-1.12% appreciation · 3.0% rent growth · sell at horizon
- IRR
- -20.8%
- Equity multiple
- 0.14×
- Total profit
- $-126,222
- Equity at exit
- $123,096
- IRR
- -14.3%
- Equity multiple
- -0.22×
- Total profit
- $-178,334
- Equity at exit
- $126,799
Cash invested: $146,157 (down + closing). Projections, not guarantees.
Landlord ↔ Tenant lean methodology
- Overall (STATE)
- 90 Strongly Landlord-Friendly
- State South Carolina
- 90 Strongly Landlord-Friendly · R+6
- County
- — inherits STATE
- City
- — inherits STATE
ZIP-level market 29450
- Home prices YoY
- -0.2%
- Active inventory
- 69
- Price-to-rent
- 14.5×
Monthly cashflow live
- Estimated rent
- $2,995 medium interval (Pro) →
- Mortgage (P&I)
- −$2,737
- Tax est. 1.5%
- −$652 /mo · $7,830/yr
- Insurance
- −$217
- HOA
- −$82
- Vacancy / Maint / Mgmt
- −$629
- Net cashflow
- $-1,323
Break-even live
UW: 25.0% down · 7.5% · 30yr · 1.5% tax · 5.0% vac · 8.0% maint · 8.0% mgmt
Financing live
Cash to close
- Down payment
- $130,498
- Closing costs
- $15,660
- Reserves months
- —
- Total cash needed
- —
Loan-product check · same deal, 3 products live
Conventional
25% down · 7.5% · 30yr
- Down + closing
- —
- Monthly P&I
- —
- Monthly cashflow
- —
- DSCR
- —
- Eligible?
- —
Personal DTI + credit; lowest rate.
DSCR
20% down · 8.5% · 30yr
- Down + closing
- —
- Monthly P&I
- —
- Monthly cashflow
- —
- DSCR
- —
- Eligible?
- —
No personal income docs; deal must DSCR.
Hard money
10% down · 12.0% · 12mo
- Down + closing
- —
- Monthly P&I
- —
- Monthly cashflow
- —
- DSCR
- —
- Eligible?
- —
Short-term bridge; refi at stabilization.
Rent comps 1 comps
| Address | Beds | Baths | Sqft | Rent | $/sqft | DOM | Units | Dist |
|---|---|---|---|---|---|---|---|---|
| 1024 Wading Point Blvd Huger, SC | 4.0 | 2.0 | 1871 | $2,995 | $1.60 | 3d | 1 | 0.53mi |
HOA detail
- Monthly dues
- $82 · $984/yr
Listing history 1 events
-
2026-05-01$521,990 Active
ⓘ Source: listings_history table (triggers on properties + properties_extension) + one-shot
backfill from property_details.listing_events for pre-trigger history.
Nearby sold comps map
Loading sold comps map…
Walkable amenities ~0.75 mi
Loading nearby amenities…
Taxation est. · year 1
- Rental income
- $35,940
- − Mortgage interest
- −$29,240
- − Property taxes
- −$7,830
- − Insurance
- −$2,610
- − Repairs & maintenance
- −$2,875
- − Management
- −$2,875
- − HOA
- −$984
- − Depreciation
- −$15,185
- Taxable loss
- −$25,659
- Est. tax savings @ 24.0%
- +$6,158
- After-tax cash flow
- $-9,722/yr
For passive investors: Depreciation is non-cash, so a rental often shows a tax loss while cash-flowing — sheltering income. Rental losses are passive: they offset passive income freely, and up to $25,000/yr can offset ordinary (W-2) income if you actively participate and your MAGI is under $100k (phasing out to $0 by $150k); unused losses carry forward. On sale, claimed depreciation is recaptured at up to 25%, and gains may owe capital-gains tax (a 1031 exchange can defer both). Figures are a year-1 estimate at your 24.0% rate — not tax advice; consult a CPA.
Condition & rehab AI · 1 photo
The property requires extensive repairs and improvements to its exterior, interior, and systems, significantly impacting its current condition and value. Landscaping and curb appeal improvements would be a good starting point to enhance its visual appeal and value.
Repairs flagged
- Major roof — No visible roof in the satellite image.
- Major exterior — No visible exterior in the satellite image.
- Major flooring — No visible interior or exterior flooring in the satellite image.
- Major interior walls/paint — No visible interior walls or paint in the satellite image.
- Major systems — No visible systems in the satellite image.
Value-add opportunities
- Both landscaping and curb appeal — Improving the landscaping and curb appeal would enhance the home's visual appeal and potentially its value.
- Both exterior and interior repairs — Addressing the extensive repairs needed would significantly improve the home's condition and value.
- Both roof replacement — Replacing the roof would be a critical repair that would improve the home's structural integrity and value.
- Both exterior and interior painting — Painting the exterior and interior would improve the home's appearance and potentially its value.
- Both system upgrades — Upgrading the systems would improve the home's functionality and potentially its value.
Renovation cost estimate screening
| Repair item | Severity | Est. cost |
|---|---|---|
| roof · No visible roof in the satellite image. | Major | $15,000–50,000 |
| exterior · No visible exterior in the satellite image. | Major | $15,000–50,000 |
| flooring · No visible interior or exterior flooring in the satellite image. | Major | $15,000–50,000 |
| interior walls/paint · No visible interior walls or paint in the satellite image. | Major | $15,000–50,000 |
| systems · No visible systems in the satellite image. | Major | $15,000–50,000 |
| Total estimated repair cost · 5 items | $75,000–250,000 |
Value-add ROI direction
- Both landscaping and curb appeal — Improving the landscaping and curb appeal would enhance the home's visual appeal and potentially its value. ↑
- Both exterior and interior repairs — Addressing the extensive repairs needed would significantly improve the home's condition and value. ↑
- Both roof replacement — Replacing the roof would be a critical repair that would improve the home's structural integrity and value. ↑
- Both exterior and interior painting — Painting the exterior and interior would improve the home's appearance and potentially its value. ↑
- Both system upgrades — Upgrading the systems would improve the home's functionality and potentially its value. ↑
ⓘ Cost ranges are severity-bucket heuristics (US national rule-of-thumb). Get contractor quotes + a written scope before underwriting a rehab budget.
Schools (NCES district)
- District
- Berkeley 01
- NCES district ID
- 4501170
- Math proficiency
- 35% ▼ -8.00%
- Reading proficiency
- 48% ▼ -2.00%
- Median HH income
- $52,724
- Composite
- 35.95/100
- National rank
- #4799
- State rank
- #30 of 80 in SC
Livability — Charleston
- Score
- 76/100
- State rank
- #22
- US rank
- #3336
Category grades
Schools grade is shown separately in the Schools card above.
Census & demographics
- City population
- 200,573
- Population (ZIP)
- 3,124
Population outlook (Berkeley County) Hauer SSP2
- Today (2025)
- 254,184 people
- By 2030
- 279,677 · +10.0%
- By 2040
- 329,379 · +29.6%
- By 2050
- 375,557 · +47.8%
- By 2075
- 476,740 · +87.6%
- By 2100
- 535,945 · +110.8%
Race, ethnicity, and origin ACS 2023
- Neighborhood character
- Majority Black (64%)
- Race & ethnicity
- Black 64% White 25% Hispanic / Latino 9% Two or more races 4%
- Hispanic origin (detail)
- Mexican 6% Dominican 2%
- Common ancestry
- Serbian 7% Italian 1% Lithuanian 1%
- Foreign-born
- 2% · Canada
- Languages at home
- 96% English-only · Spanish 3%
Political lean MEDSL · Berkeley
- 2024 margin
- R (+16.3) · D 41.1% · R 57.4% · Other 1.4%
- 2008→2024 swing
- -3.2pp toward R · 2008: -13.1pp · 2024: -16.3pp
- All cycles
- 2024: R+16.3 2020: R+11.7 2016: R+17.4 2012: R+18.9 2008: R+13.1
Not yet ingested
- Civics
- —
Market trends
- HPI YoY
- ▼ -1.12%
- Current HPI
- 462.4619
- Rent YoY
- —
- Metro
- —
- State GDP YoY
- ▲ 4.51%
- F500 in state
- 2
Industry mix (Fortune 500 HQ in SC)
| Industry | F500 HQs | Revenue |
|---|---|---|
| Packaging | 1 | $7B |
|
||
Price history
1 event — show timeline
- 2026-05-01 Listed $521,990 Charleston Trident MLS
Cash-flow waterfall
monthlySold comps — $/sqft
last 12 mo · ≤1 miLoading sold comps…