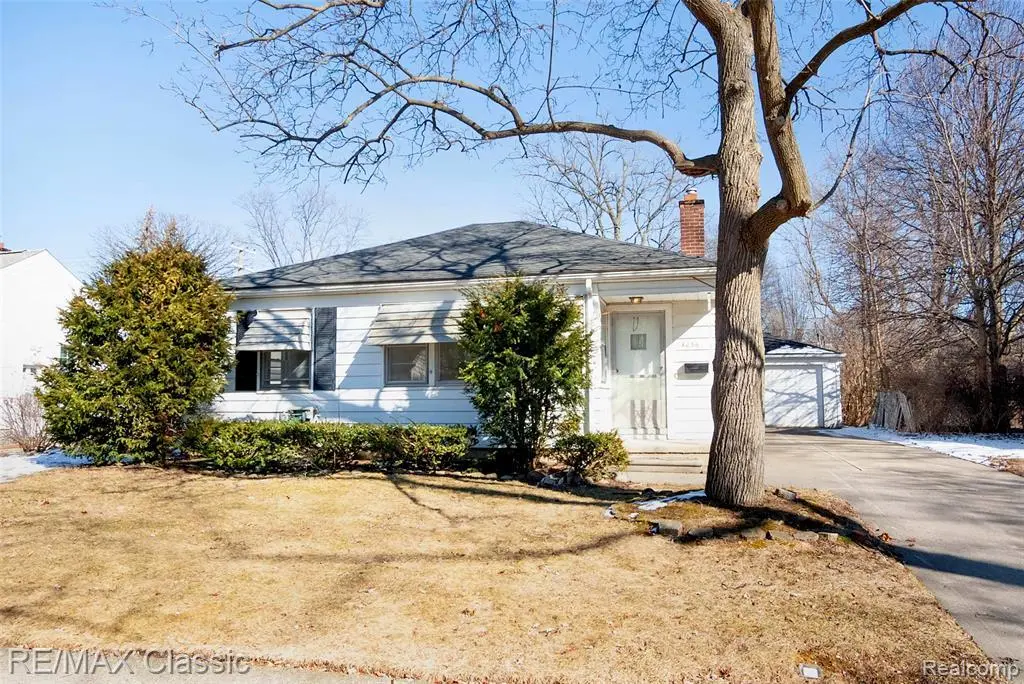
4056 Robina Ave · Berkley, MI
Flood risk 1/10 · Minimal
- FEMA flood zone
- X (unshaded)
- Chance of flooding over 30 yrs
- 0.0%
- Est. flood insurance / yr
- $473 – $860
Fire risk 1/10 · Minimal
- Est. fire insurance / yr
- $784 – $1,456
Heat risk 2/10 · Minimal
- Hot days now (above 97°F)
- 7 days/yr
- Hot days in 30 yrs
- 14 days/yr
Wind risk 2/10 · Minimal
- Chance of severe wind over 30 yrs
- —
Air-quality risk 4/10 · Minor
- Unhealthy air days now
- 3 days/yr
- Unhealthy air days in 30 yrs
- 6 days/yr
Risk factors via First Street. Map © Google.
Why this score? — see what drove the C grade
The composite is a weighted blend of 9 inputs, each scored 0–100. Each bar is that input's sub-score; the figure is the points it added to the 100-point composite (weight × sub-score).
- Cash flow +18.0/30.0
- ARV discount +15.0/15.0
- 1% rule +5.8/10.0
- DSCR +5.7/10.0
- Schools +4.9/10.0
- Livability +4.6/5.0
- Rent growth +2.5/5.0
- Condition / age +2.5/5.0
- Appreciation +0.0/10.0
$210,000
🖨 Deal sheet 📄 Offer letter ✓ Due diligence
Listing remarks MLS
Multiple Offers being presented Fri 3/20/26 @ 9:00 am. This 3-bedroom home offers strong potential for an investor, flipper, or buyer looking to renovate and build equity. The property is in need of significant updates including kitchen, flooring, paint, windows, and general cosmetic improvements. The roof appears to be in decent condition. Brand new furnace, new bathroom vanity, and plumbing repairs in the kitchen including a new disposal and PVC line to the basement. Hardwood floors believed to be under the carpeting in the living room and possibly other areas. Unique bedroom layout with one bedroom leading to a third bedroom, which also has a separate exterior entrance from the enclosed porch - potentially ideal for rental or flexible living arrangements. Fenced yard and a 1.5-car garage add to the value. Charming, street appeal. Conveniently located within walking distance to Pattengill Elementary and Bacon Park. No FHA/VA.
Key facts
- Significant updates
- New bathroom vanity
- Brand new furnace
Tags
Neighborhood map
What this means for you Summary
Snapshot
- This is a 3-bed/1.0-bath single-family listed at $210k.
Deal economics
- At list price, monthly cash flow is $182 ($2k/yr) — positive.
- The deal already cash-flows at list — no discount required.
- Meets the 1% rule at list price ($2k rent vs $210k).
- Cap rate 7.3% vs local median 4.0% in Berkley — top-decile yield for the area; either an underpriced asset or a hidden risk that comps aren't pricing in. Stress-test before assuming the spread holds.
Location & tenants
- Location reads 92/100 on livability (#1 in MI, #33 nationally) — a professional / high-income tenant draw. Strengths: schools A+, crime A+, commute A+.
- Berkley School District (suburban): math 47% / reading 62% proficiency, ranked #64 of 540 in MI (top 12%) — acceptable for families but not a draw, mixed tenant base, ~2y average lease; only 18% free/reduced lunch — higher-income household profile.
- Market conditions: 82 active listings in the ZIP; 16 comparable units currently listed for rent nearby; rentals at typical pace (median 24d on market — plan ~3-4 weeks tenant-placement turnaround); high-income renter base; 2,614 units permitted in Oakland County in 2024 (721 in 5+ unit buildings).
Forward outlook
- Local home prices are declining (-3.0%/yr); year-one equity from $1k of loan paydown is wiped out by about $6k of value loss. Plan a longer hold.
- Oakland County population projected at +10% by 2050 — modest demand growth; plan on rents tracking national, not racing it.
Negotiation context
- Only 7 days on market — expect competitive offers; lowballing is unlikely to land.
- 2 sale attempts with the ask held roughly flat each time — persistent listings suggest the price (not the market) is what's stuck; bring a comps-based counter.
- Current owner paid $92k; list at $210k implies a 128% gain — meaningful room to come down on a strong offer.
Risks & watch-outs
- Watch-outs: built in 1943 — expect roof / HVAC / electrical / plumbing capex.
Questions for the listing agent
- Built in 1943 — when were the roof, HVAC, electrical panel, plumbing, and water heater last replaced?
- Is there a deadline driving the sale (1031 exchange, divorce, estate, relocation)? That informs how much negotiation room exists.
- Schools are A-rated — typically a magnet for longer-tenancy family renters. What's the average tenant stay here, and is there a school-zone premium baked into asking?
- What's the average days-on-market for RENTAL listings here right now (not sales)? A rising rental-DOM trend means longer vacancies and softer asking-rent achievability than the comps imply.
- What's the recent tenant-quality profile in this submarket — average credit score on applications, eviction rate, late-payment / NSF rate, and stable-employment percentage? A property-management company in the area should have these aggregated.
- How much new for-sale + rental construction is in the pipeline within 1–3 miles? Heavy new supply typically softens prices + rents 12–24 months out; constrained supply supports both.
Investment metrics
- 1% rule
- 1.08% ✓
- Cap rate
- 7.33%
- Cash-on-cash
- 3.71%
- DSCR
- 1.17
- GRM
- 7.7
CMA / ARV
- ARV (on-the-fly)
- $370,403
- Comps found
- 12
Show comp detail 12 sales within ~0.75 mi
| Address | Dist | Beds/Ba | Sqft | Sold | Price | $/sf | Match |
|---|---|---|---|---|---|---|---|
| 4112 Cornwall St | 0.17mi | 3/2.5 | 1,626 (-2%) | 1mo | $502,000 | $309 | 82 |
| 4195 Griffith Ave | 0.12mi | 2/1.0 (-1) | 1,558 (-6%) | 0mo | $260,000 | $167 | 79 |
| 3600 Royal Ave | 0.38mi | 3/1.0 | 1,520 (-8%) | 0mo | $329,000 | $216 | 68 |
| 2958 Woodslee Dr | 0.68mi | 3/1.5 | 1,692 (+2%) | 1mo | $489,900 | $290 | 62 |
| 3104 Prairie Ave | 0.64mi | 3/2.0 | 1,587 (-4%) | 0mo | $370,000 | $233 | 59 |
| 3911 Thomas Ave | 0.63mi | 3/2.0 | 1,590 (-4%) | 3mo | $340,000 | $214 | 57 |
| 3102 Woodslee Dr | 0.60mi | 3/1.5 | 1,810 (+9%) | 2mo | $366,000 | $202 | 53 |
| 3343 Harvard Rd | 0.68mi | 3/1.5 | 1,788 (+8%) | 2mo | $307,000 | $172 | 52 |
| 3992 Greenfield Rd | 0.70mi | 3/1.0 | 1,457 (-12%) | 0mo | $265,000 | $182 | 46 |
| 3690 Phillips Ave | 0.43mi | 4/2.5 (+1) | 1,442 (-13%) | 1mo | $365,000 | $253 | 46 |
| 3155 Griffith Ave | 0.53mi | 4/1.5 (+1) | 1,426 (-14%) | 0mo | $325,000 | $228 | 45 |
| 2795 Robina Ave | 0.75mi | 3/2.0 | 1,838 (+11%) | 2mo | $410,000 | $223 | 41 |
Match score weights: distance 35% · size 25% · config 20% · recency 20%. Top-matched comps best support the ARV.
Projected returns pro-forma
-3.0% appreciation · 3.0% rent growth · sell at horizon
- IRR
- -10.4%
- Equity multiple
- 0.62×
- Total profit
- $-22,324
- Equity at exit
- $31,312
- IRR
- -1.0%
- Equity multiple
- 0.93×
- Total profit
- $-4,009
- Equity at exit
- $18,157
Cash invested: $58,800 (down + closing). Projections, not guarantees.
Landlord ↔ Tenant lean methodology
- Overall (STATE)
- 62 Landlord-Friendly
- State Michigan
- 62 Landlord-Friendly · EVEN
- County
- — inherits STATE
- City
- — inherits STATE
ZIP-level market 48072
- Active inventory
- 82
- Price-to-rent
- 7.7×
Monthly cashflow live
- Estimated rent
- $2,262 high interval (Pro) →
- Mortgage (P&I)
- −$1,101
- Tax from tax record
- −$417 /mo · $5,000/yr
- Insurance
- −$88
- HOA
- −$0
- Vacancy / Maint / Mgmt
- −$475
- Net cashflow
- $182
Break-even live
UW: 25.0% down · 7.5% · 30yr · 1.5% tax · 5.0% vac · 8.0% maint · 8.0% mgmt
Financing live
Cash to close
- Down payment
- $52,500
- Closing costs
- $6,300
- Reserves months
- —
- Total cash needed
- —
Loan-product check · same deal, 3 products live
Conventional
25% down · 7.5% · 30yr
- Down + closing
- —
- Monthly P&I
- —
- Monthly cashflow
- —
- DSCR
- —
- Eligible?
- —
Personal DTI + credit; lowest rate.
DSCR
20% down · 8.5% · 30yr
- Down + closing
- —
- Monthly P&I
- —
- Monthly cashflow
- —
- DSCR
- —
- Eligible?
- —
No personal income docs; deal must DSCR.
Hard money
10% down · 12.0% · 12mo
- Down + closing
- —
- Monthly P&I
- —
- Monthly cashflow
- —
- DSCR
- —
- Eligible?
- —
Short-term bridge; refi at stabilization.
Rent comps 16 comps
| Address | Beds | Baths | Sqft | Rent | $/sqft | DOM | Units | Dist |
|---|---|---|---|---|---|---|---|---|
| 3185 Buckingham Ave Berkley, MI | 3.0 | 1.0 | 1091 | $1,895 | $1.74 | 24d | 1 | 0.54mi |
| 3003 Garden Ave Royal Oak, MI | 3.0 | 3.0 | 1788 | $2,850 | $1.59 | 16d | 1 | 0.56mi |
| 2330 Wiltshire Rd Berkley, MI | 3.0 | 1.0 | 1254 | $2,400 | $1.91 | 2d | 1 | 0.73mi |
| 3324 Greenfield Rd Berkley, MI | 2.0 | 2.0 | 1563 | $2,200 | $1.41 | 43d | 1 | 0.80mi |
| 2575 Catalpa Dr Unit 2575-06 Berkley, MI | 2.0 | 2.0 | 1100 | $1,695 | $1.54 | 24d | 1 | 0.89mi |
| 2575 Catalpa Dr Unit 2575-16 Berkley, MI | 2.0 | 1.0 | 1100 | $1,495 | $1.36 | 24d | 1 | 0.89mi |
| 3902 Springer Ave Royal Oak, MI | 4.0 | 2.5 | 2225 | $2,800 | $1.26 | 14d | 1 | 0.94mi |
| 29890 Everett St Southfield, MI | 3.0 | 1.5 | 1100 | $2,200 | $2.00 | 43d | 1 | 0.95mi |
| 28124 Brentwood St Southfield, MI | 3.0 | 1.0 | 1056 | $1,800 | $1.70 | 24d | 1 | 1.05mi |
| 3912 Hillside Dr Royal Oak, MI | 3.0 | 1.5 | 1196 | $2,495 | $2.09 | 2d | 1 | 1.07mi |
| 3818 Edgeland Ave Royal Oak, MI | 3.0 | 2.0 | 1100 | $2,400 | $2.18 | 3d | 1 | 1.14mi |
| 1674 Eaton Rd Berkley, MI | 3.0 | 2.0 | 1500 | $2,975 | $1.98 | 43d | 1 | 1.21mi |
| 27435 Greenfield Rd Southfield, MI | 2.0 | 2.0 | 1200 | $1,399 | $1.17 | 5d | 1 | 1.27mi |
| 28291 Pierce St Southfield, MI | 2.0 | 1.0 | 1332 | $1,580 | $1.19 | 24d | 1 | 1.39mi |
| 4307 Cooper Ave Royal Oak, MI | 3.0 | 2.0 | 1679 | $2,550 | $1.52 | 17d | 1 | 1.39mi |
| 1641 Fairview Ave Royal Oak, MI | 2.0 | 1.0 | 1650 | $1,640 | $0.99 | 24d | 1 | 1.40mi |
Listing history 6 events
-
2026-03-22status Pending 941-char remark
Show marketing remark (941 chars)
Multiple Offers being presented Fri 3/20/26 @ 9:00 am. This 3-bedroom home offers strong potential for an investor, flipper, or buyer looking to renovate and build equity. The property is in need of significant updates including kitchen, flooring, paint, windows, and general cosmetic improvements. The roof appears to be in decent condition. Brand new furnace, new bathroom vanity, and plumbing repairs in the kitchen including a new disposal and PVC line to the basement. Hardwood floors believed to be under the carpeting in the living room and possibly other areas. Unique bedroom layout with one bedroom leading to a third bedroom, which also has a separate exterior entrance from the enclosed porch - potentially ideal for rental or flexible living arrangements. Fenced yard and a 1.5-car garage add to the value. Charming, street appeal. Conveniently located within walking distance to Pattengill Elementary and Bacon Park. No FHA/VA.
-
2026-03-22status Pending
Show marketing remark (941 chars)
Multiple Offers being presented Fri 3/20/26 @ 9:00 am. This 3-bedroom home offers strong potential for an investor, flipper, or buyer looking to renovate and build equity. The property is in need of significant updates including kitchen, flooring, paint, windows, and general cosmetic improvements. The roof appears to be in decent condition. Brand new furnace, new bathroom vanity, and plumbing repairs in the kitchen including a new disposal and PVC line to the basement. Hardwood floors believed to be under the carpeting in the living room and possibly other areas. Unique bedroom layout with one bedroom leading to a third bedroom, which also has a separate exterior entrance from the enclosed porch - potentially ideal for rental or flexible living arrangements. Fenced yard and a 1.5-car garage add to the value. Charming, street appeal. Conveniently located within walking distance to Pattengill Elementary and Bacon Park. No FHA/VA.
-
2026-03-15$210,000 Active 941-char remark
Show marketing remark (941 chars)
Multiple Offers being presented Fri 3/20/26 @ 9:00 am. This 3-bedroom home offers strong potential for an investor, flipper, or buyer looking to renovate and build equity. The property is in need of significant updates including kitchen, flooring, paint, windows, and general cosmetic improvements. The roof appears to be in decent condition. Brand new furnace, new bathroom vanity, and plumbing repairs in the kitchen including a new disposal and PVC line to the basement. Hardwood floors believed to be under the carpeting in the living room and possibly other areas. Unique bedroom layout with one bedroom leading to a third bedroom, which also has a separate exterior entrance from the enclosed porch - potentially ideal for rental or flexible living arrangements. Fenced yard and a 1.5-car garage add to the value. Charming, street appeal. Conveniently located within walking distance to Pattengill Elementary and Bacon Park. No FHA/VA.
-
2026-03-15$210,000 Active
Show marketing remark (941 chars)
Multiple Offers being presented Fri 3/20/26 @ 9:00 am. This 3-bedroom home offers strong potential for an investor, flipper, or buyer looking to renovate and build equity. The property is in need of significant updates including kitchen, flooring, paint, windows, and general cosmetic improvements. The roof appears to be in decent condition. Brand new furnace, new bathroom vanity, and plumbing repairs in the kitchen including a new disposal and PVC line to the basement. Hardwood floors believed to be under the carpeting in the living room and possibly other areas. Unique bedroom layout with one bedroom leading to a third bedroom, which also has a separate exterior entrance from the enclosed porch - potentially ideal for rental or flexible living arrangements. Fenced yard and a 1.5-car garage add to the value. Charming, street appeal. Conveniently located within walking distance to Pattengill Elementary and Bacon Park. No FHA/VA.
-
1995-10-26soldstatus $92,000
-
1985-03-01soldstatus $40,000
ⓘ Source: listings_history table (triggers on properties + properties_extension) + one-shot
backfill from property_details.listing_events for pre-trigger history.
Tax reassessment forecast MI · Partial reset (capped growth)
- Current annual tax
- $5,000 · $417/mo
- Projected year-2 tax
- $5,000 · $417/mo
- Expected delta
- $0/yr ($0/mo · 0.0%)
ⓘ Screening estimate from a state-policy table — verify with the county assessor before closing.
Climate risk First Street
- Flood 1/10 Low FEMA zone X (unshaded) · 0% chance over 30 yrs
- Wildfire 1/10 Low
- Heat 2/10 Low 7 d/yr ≥97°F today · 14 d/yr by 30 yrs out
- Wind 2/10 Low
- Air quality 4/10 Moderate 3 unhealthy d/yr today · 6 by 30 yrs out
Nearby sold comps map
Loading sold comps map…
Walkable amenities ~0.75 mi
Loading nearby amenities…
Taxation est. · year 1
- Rental income
- $27,147
- − Mortgage interest
- −$11,763
- − Property taxes
- −$5,000
- − Insurance
- −$1,050
- − Repairs & maintenance
- −$2,172
- − Management
- −$2,172
- − Depreciation
- −$6,109
- Taxable loss
- −$1,119
- Est. tax savings @ 24.0%
- +$268
- After-tax cash flow
- $2,450/yr
For passive investors: Depreciation is non-cash, so a rental often shows a tax loss while cash-flowing — sheltering income. Rental losses are passive: they offset passive income freely, and up to $25,000/yr can offset ordinary (W-2) income if you actively participate and your MAGI is under $100k (phasing out to $0 by $150k); unused losses carry forward. On sale, claimed depreciation is recaptured at up to 25%, and gains may owe capital-gains tax (a 1031 exchange can defer both). Figures are a year-1 estimate at your 24.0% rate — not tax advice; consult a CPA.
Schools (NCES district)
- District
- Berkley School District
- NCES district ID
- 2605010
- Math proficiency
- 47% ▼ -10.00%
- Reading proficiency
- 62% ▼ -3.00%
- Median HH income
- $72,519
- Composite
- 48.61/100
- National rank
- #2109
- State rank
- #64 of 540 in MI
Livability — Berkley
- Score
- 92/100
- State rank
- #1
- US rank
- #33
Category grades
Schools grade is shown separately in the Schools card above.
Census & demographics
- Census place
- Berkley, MI
- County
- Oakland County · 1,009,092 people
- City population
- 15,149
- Metro
- Detroit-Warren-Dearborn, MI
- Population (ZIP)
- 15,149
- Household income
- $116,239
- Rent vs Own
- Severe rent burden
- 127.0
Population outlook (Oakland County) Hauer SSP2
- Today (2025)
- 1,335,747 people
- By 2030
- 1,375,100 · +2.9%
- By 2040
- 1,435,385 · +7.5%
- By 2050
- 1,469,250 · +10.0%
- By 2075
- 1,531,946 · +14.7%
- By 2100
- 1,450,485 · +8.6%
Race, ethnicity, and origin ACS 2023
- Neighborhood character
- Predominantly White (86%)
- Race & ethnicity
- White 86% Two or more races 8% Hispanic / Latino 3% Black 2%
- Common ancestry
- Romanian 12% Lithuanian 4% Slovak 4%
- Foreign-born
- 3% · Canada
- Languages at home
- 96% English-only · Other Indo-European 1% Spanish 1% Russian/Polish/Slavic 1%
Political lean MEDSL · Oakland
- 2024 margin
- D (+10.6) · D 54.4% · R 43.8% · Other 1.9%
- 2008→2024 swing
- -3.9pp toward R · 2008: 14.5pp · 2024: 10.6pp
- All cycles
- 2024: D+10.6 2020: D+14.1 2016: D+8.1 2012: D+8.1 2008: D+14.5
Not yet ingested
- Civics
- —
Market trends
- HPI YoY
- ▼ -502.41%
- Current HPI
- 225.7389
- Rent YoY
- —
- Metro
- Detroit-Warren-Dearborn, MI
- State GDP YoY
- ▲ 1.37%
- F500 in state
- 28
Industry mix (Fortune 500 HQ in MI)
| Industry | F500 HQs | Revenue |
|---|---|---|
| Automotive Parts | 3 | $48B |
|
||
| Automotive | 2 | $372B |
|
||
| Chemicals | 1 | $45B |
|
||
| Automotive Retail | 1 | $29B |
|
||
| Healthcare / Medical Devices | 1 | $23B |
|
||
| Automotive Technology | 1 | $20B |
|
||
Price history
+425.0% since first listed6 events — show timeline
- 2026-03-22 Pending — MiRealSource-MiMLS
- 2026-03-22 Pending — REALCOMP
- 2026-03-15 Listed $210,000 REALCOMP
- 2026-03-15 Listed $210,000 MiRealSource-MiMLS
- 1995-10-26 Sold (Public Records) $92,000 Public Records
- 1985-03-01 Sold (Public Records) $40,000 Public Records
Property tax history
+2.6%/yrLatest (2025): $5,000 · +2.6% YoY. Source: county tax records.
Cash-flow waterfall
monthlySold comps — $/sqft
last 12 mo · ≤1 miLoading sold comps…