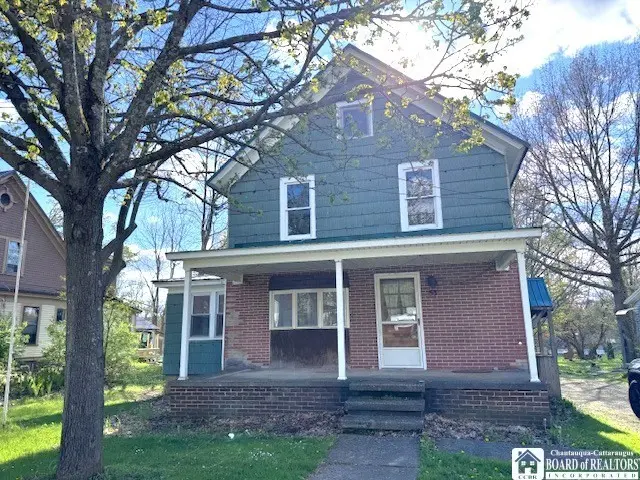
53 N Main St · Cassadaga, NY
Flood risk 1/10 · Minimal
- FEMA flood zone
- X
- Chance of flooding over 30 yrs
- 0.0%
- Est. flood insurance / yr
- $473 – $860
Fire risk 3/10 · Minor
- Est. fire insurance / yr
- $691 – $1,283
Heat risk 1/10 · Minimal
- Hot days now (above 90°F)
- 7 days/yr
- Hot days in 30 yrs
- 17 days/yr
Wind risk 1/10 · Minimal
- Chance of severe wind over 30 yrs
- —
Air-quality risk 2/10 · Minimal
- Unhealthy air days now
- 1 days/yr
- Unhealthy air days in 30 yrs
- 2 days/yr
Risk factors via First Street. Map © Google.
Why this score? — see what drove the B grade
The composite is a weighted blend of 9 inputs, each scored 0–100. Each bar is that input's sub-score; the figure is the points it added to the 100-point composite (weight × sub-score).
- Cash flow +25.5/30.0
- ARV discount +15.0/15.0
- DSCR +8.5/10.0
- 1% rule +7.2/10.0
- Appreciation +5.7/10.0
- Schools +4.3/10.0
- Livability +3.0/5.0
- Rent growth +2.5/5.0
- Condition / age +2.5/5.0
$99,900
🖨 Deal sheet (PDF) 📄 Offer letter ✓ Due diligence
Listing remarks
One of just a couple homes currently for sale in the village of Cassadaga! This home, right around the corner from the Lake, is a fixer-upper but the price reflects this and the potential is unlimited! This 2 story 3 bedroom home has 3 bedrooms and full bathroom on 2nd floor, and kitchen, half bath, living room, dining room and office/bonus room all on the 1st floor. The deep lot goes all the way back 330' feet and you can see Cassadaga Lake from the backyard! There is a basement for all the mechanicals and laundry room, 2 car garage, forced hot air heating, and a steel roof on both house and garage. Walking distance to the Lake, Beach, Lily Dale, coffee shop, grocery, small shops and a mil
Key facts
- Deep lot
- Steel roof
- 0.45 acre lot
Tags
Property features AI
Exterior
- Parking: Detached garage; 2-car garage
- Utilities: Electricity connected; Public water connected; Septic tank sewer
- Home design: Two-story home; Existing (previously built) property; Rectangular residential lot with city street frontage
- Construction: Composite siding; Metal roof; Block and stone foundation; Built prior to current listing (existing)
- Exterior features: Blacktop driveway; Deck; Covered porch
Interior
- Kitchen: Free-standing range; Oven; Refrigerator
- Bedrooms: 7 total rooms including living spaces, office, den and laundry
- Flooring: Carpet; Vinyl; Varied flooring
- Bathrooms: 1 full bathroom; 1 half bathroom; One main-level bathroom
- Heating & cooling: Gas forced-air heating
- Interior features: Den; Separate/formal dining room; Eat-in kitchen; Separate/formal living room; Home office; Natural woodwork
- Laundry & utility: Laundry in the basement; Gas water heater
Neighborhood map
What this means for you Summary
Snapshot
- This is a 3-bed/2.0-bath single-family listed at $100k.
Deal economics
- At list price, monthly cash flow is $234 ($3k/yr) — positive.
- The deal already cash-flows at list — no discount required.
- Meets the 1% rule at list price ($1k rent vs $100k).
- Recommended offer: $97k (3.0% below list) — sets the bar for market timing.
Location & tenants
- Location reads 60/100 on livability (#979 in NY) — a middle-class / working-renter tenant base. Strengths: cost of living A+, housing A+; Watch: schools F, crime F, amenities F.
- Cassadaga Valley Central School District (rural): math 41% / reading 61% proficiency, ranked #372 of 590 in NY (top 63%) — acceptable for families but not a draw, mixed tenant base, ~2y average lease.
- Market conditions: 12 active listings in the ZIP; 127 units permitted in Chautauqua County in 2024 (0 in 5+ unit buildings).
Forward outlook
- In year one you build about $2k of equity ($691 loan paydown + $1k appreciation (1.4% local appreciation)).
- Chautauqua County population projected at -22% by 2050 — secular population decline; favor cash flow + early exit over multi-decade hold.
- At projected returns (1.4% appreciation + 3.0% rent growth), your $28k cash investment doubles in ~5 years — after that, you're playing with house money.
Negotiation context
- It's been on market 47 days — a 3% lower offer ($97k) is reasonable based on typical stale-listing flexibility.
Risks & watch-outs
- Watch-outs: built in 1910 — expect roof / HVAC / electrical / plumbing capex.
Questions for the listing agent
- It's been on market 47 days. Have you received any prior offers? Is the seller open to a 3% concession, seller financing, or rate buy-down credit?
- Built in 1910 — when were the roof, HVAC, electrical panel, plumbing, and water heater last replaced?
- Is there a deadline driving the sale (1031 exchange, divorce, estate, relocation)? That informs how much negotiation room exists.
- Schools are F-rated, which usually means shorter tenancies and higher turnover. Who's the typical renter profile here, and what's been the actual vacancy rate?
- Crime grade is F in this area — have there been break-ins, vandalism, or insurance claims at this property in the last 3 years? What carrier currently insures it and at what premium?
- What's the average days-on-market for RENTAL listings here right now (not sales)? A rising rental-DOM trend means longer vacancies and softer asking-rent achievability than the comps imply.
- What's the recent tenant-quality profile in this submarket — average credit score on applications, eviction rate, late-payment / NSF rate, and stable-employment percentage? A property-management company in the area should have these aggregated.
- How much new for-sale + rental construction is in the pipeline within 1–3 miles? Heavy new supply typically softens prices + rents 12–24 months out; constrained supply supports both.
Investment metrics
- 1% rule
- 1.22% ✓
- Cap rate
- 9.11%
- Cash-on-cash
- 10.05%
- DSCR
- 1.45
- GRM
- 6.8
CMA / ARV
- ARV (median comp)
- $196,395
- List price
- $99,900
- Delta
- -49.13%
- Verdict
- UNDERPRICED
- Comps
- 12 within 1.0 mi
Show comp detail 2 sales within ~0.75 mi
| Address | Dist | Beds/Ba | Sqft | Sold | Price | $/sf | Match |
|---|---|---|---|---|---|---|---|
| 77 N Main St | 0.06mi | 4/1.5 (+1) | 1,220 (-9%) | 20mo | $169,900 | $139 | 58 |
| 22 Burnham Pl | 0.67mi | 3/1.0 | 1,419 (+6%) | 10mo | $175,000 | $123 | 47 |
Match score weights: distance 35% · size 25% · config 20% · recency 20%. Top-matched comps best support the ARV.
Projected returns pro-forma
1.39% appreciation · 3.0% rent growth · sell at horizon
- IRR
- 12.9%
- Equity multiple
- 1.67×
- Total profit
- $18,736
- Equity at exit
- $36,135
- IRR
- 16.1%
- Equity multiple
- 3.03×
- Total profit
- $56,849
- Equity at exit
- $49,631
Cash invested: $27,972 (down + closing). Projections, not guarantees.
Landlord ↔ Tenant lean methodology
- Overall (STATE)
- 15 Strongly Tenant-Friendly
- State New York
- 15 Strongly Tenant-Friendly · D+10
- County
- — inherits STATE
- City
- — inherits STATE
ZIP-level market 14718
- Home prices YoY
- 0.5%
- Active inventory
- 12
- Price-to-rent
- 6.8×
Monthly cashflow live
- Estimated rent
- $1,223 medium interval (Pro) →
- Mortgage (P&I)
- −$524
- Tax from tax record
- −$167 /mo · $2,001/yr
- Insurance
- −$42
- HOA
- −$0
- Vacancy / Maint / Mgmt
- −$257
- Net cashflow
- $234
Break-even live
Sensitivity live
| Price | -10% $291 | -5% $262 | +0% $234 | +5% $206 | +10% $178 |
|---|---|---|---|---|---|
| Rent | -10% $138 | -5% $186 | +0% $234 | +5% $283 | +10% $331 |
| Rate | -1.0pp $284 | -0.5pp $260 | base $234 | +0.5pp $208 | +1.0pp $182 |
UW: 25.0% down · 7.5% · 30yr · 1.5% tax · 5.0% vac · 8.0% maint · 8.0% mgmt
Financing live
Cash to close
- Down payment
- $24,975
- Closing costs
- $2,997
- Reserves months
- —
- Total cash needed
- —
Loan-product check · same deal, 3 products live
Conventional
25% down · 7.5% · 30yr
- Down + closing
- —
- Monthly P&I
- —
- Monthly cashflow
- —
- DSCR
- —
- Eligible?
- —
Personal DTI + credit; lowest rate.
DSCR
20% down · 8.5% · 30yr
- Down + closing
- —
- Monthly P&I
- —
- Monthly cashflow
- —
- DSCR
- —
- Eligible?
- —
No personal income docs; deal must DSCR.
Hard money
10% down · 12.0% · 12mo
- Down + closing
- —
- Monthly P&I
- —
- Monthly cashflow
- —
- DSCR
- —
- Eligible?
- —
Short-term bridge; refi at stabilization.
Listing history 16 events
-
2026-06-19days on market $99,900 Active 47 DOM
-
2026-06-18days on market $99,900 Active 46 DOM
-
2026-06-17days on market $99,900 Active 45 DOM
-
2026-06-16days on market $99,900 Active 44 DOM
-
2026-06-15days on market $99,900 Active 43 DOM
-
2026-06-14days on market $99,900 Active 41 DOM
-
2026-06-12days on market $99,900 Active 40 DOM
-
2026-06-09days on market $99,900 Active 37 DOM
-
2026-06-08days on market $99,900 Active 36 DOM
-
2026-06-07days on market $99,900 Active 35 DOM
-
2026-06-03days on market $99,900 Active 31 DOM
-
2026-06-02days on market $99,900 Active 30 DOM
-
2026-06-01days on market $99,900 Active 29 DOM
-
2026-05-31days on market $99,900 Active 28 DOM
-
2026-05-30days on market $99,900 Active 27 DOM
-
2026-05-03$99,900 Active 859-char remark
ⓘ Source: listings_history table (triggers on properties + properties_extension) + one-shot
backfill from property_details.listing_events for pre-trigger history.
Tax reassessment forecast NY · Partial reset (capped growth)
- Current annual tax
- $2,001 · $167/mo
- Projected year-2 tax
- $2,001 · $167/mo
- Expected delta
- $0/yr ($0/mo · 0.0%)
ⓘ Screening estimate from a state-policy table — verify with the county assessor before closing.
Climate risk First Street
- Flood 1/10 Low FEMA zone X · 0% chance over 30 yrs
- Wildfire 3/10 Moderate
- Heat 1/10 Low 7 d/yr ≥90°F today · 17 d/yr by 30 yrs out
- Wind 1/10 Low
- Air quality 2/10 Low 1 unhealthy d/yr today · 2 by 30 yrs out
Nearby sold comps map
Loading sold comps map…
Walkable amenities ~0.75 mi
Loading nearby amenities…
Taxation est. · year 1
- Rental income
- $14,680
- − Mortgage interest
- −$5,596
- − Property taxes
- −$2,001
- − Insurance
- −$500
- − Repairs & maintenance
- −$1,174
- − Management
- −$1,174
- − Depreciation
- −$2,906
- Taxable income
- $1,329
- Est. tax owed @ 24.0%
- −$319
- After-tax cash flow
- $2,491/yr
For passive investors: Depreciation is non-cash, so a rental often shows a tax loss while cash-flowing — sheltering income. Rental losses are passive: they offset passive income freely, and up to $25,000/yr can offset ordinary (W-2) income if you actively participate and your MAGI is under $100k (phasing out to $0 by $150k); unused losses carry forward. On sale, claimed depreciation is recaptured at up to 25%, and gains may owe capital-gains tax (a 1031 exchange can defer both). Figures are a year-1 estimate at your 24.0% rate — not tax advice; consult a CPA.
Schools (NCES district)
- District
- Cassadaga Valley Central School District
- NCES district ID
- 3606660
- Math proficiency
- 41% ▼ -3.00%
- Reading proficiency
- 61% ▲ 15.00%
- Median HH income
- $46,654
- Composite
- 43.22/100
- National rank
- #3059
- State rank
- #372 of 590 in NY
Livability — Cassadaga
- Score
- 60/100
- State rank
- #979
- US rank
- #19142
Category grades
Schools grade is shown separately in the Schools card above.
Census & demographics
- Census place
- Cassadaga, NY
- Population (ZIP)
- 1,961
Population outlook (Chautauqua County) Hauer SSP2
- Today (2025)
- 123,454 people
- By 2030
- 118,509 · -4.0%
- By 2040
- 107,311 · -13.1%
- By 2050
- 96,703 · -21.7%
- By 2075
- 76,757 · -37.8%
- By 2100
- 60,984 · -50.6%
Race, ethnicity, and origin ACS 2023
- Neighborhood character
- Predominantly White (84%)
- Race & ethnicity
- White 84% Black 9% Hispanic / Latino 4% Two or more races 2%
- Common ancestry
- Romanian 12% Slovak 1% Lithuanian 1%
- Foreign-born
- 2%
- Languages at home
- 95% English-only · Spanish 2% Russian/Polish/Slavic 1% Other Indo-European 1%
Political lean MEDSL · Chautauqua
- 2024 margin
- Strong R (+22.0) · D 39.0% · R 61.0%
- 2008→2024 swing
- -22.9pp toward R · 2008: 0.9pp · 2024: -22.0pp
- All cycles
- 2024: R+22.0 2020: R+19.8 2016: R+24.6 2012: R+8.2 2008: D+0.9
Not yet ingested
- Civics
- —
Market trends
- HPI YoY
- ▲ 1.39%
- Current HPI
- 280.4078
- Rent YoY
- —
- Metro
- —
- State GDP YoY
- ▲ 2.60%
- F500 in state
- 92
Industry mix (Fortune 500 HQ in NY)
| Industry | F500 HQs | Revenue |
|---|---|---|
| Financial Services | 10 | $950B |
|
||
| Consumer Goods | 9 | $162B |
|
||
| Insurance | 4 | $225B |
|
||
| Telecommunications | 2 | $144B |
|
||
| Pharmaceuticals | 2 | $112B |
|
||
| Media / Entertainment | 2 | $69B |
|
||
Price history
1 event — show timeline
- 2026-05-03 Listed $99,900 UNYREIS
Property tax history
+3.8%/yrLatest (2025): $2,001 · +4.5% YoY. Source: county tax records.
Cash-flow waterfall
monthlySold comps — $/sqft
last 12 mo · ≤1 miLoading sold comps…