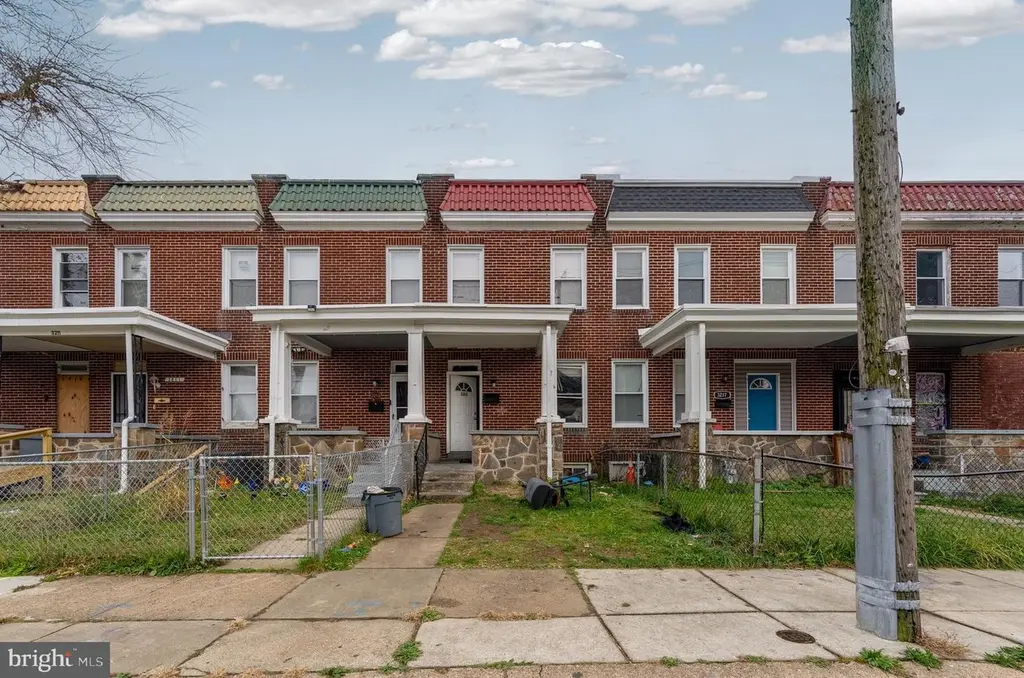
3215 Phelps Ln · Baltimore, MD
Flood risk 1/10 · Minimal
- FEMA flood zone
- X (unshaded)
- Chance of flooding over 30 yrs
- 0.0%
- Est. flood insurance / yr
- $473 – $860
Fire risk 1/10 · Minimal
- Est. fire insurance / yr
- $755 – $1,403
Heat risk 7/10 · Major
- Hot days now (above 103°F)
- 7 days/yr
- Hot days in 30 yrs
- 15 days/yr
Wind risk 6/10 · Moderate
- Chance of severe wind over 30 yrs
- 27.0%
Air-quality risk 3/10 · Minor
- Unhealthy air days now
- 3 days/yr
- Unhealthy air days in 30 yrs
- 4 days/yr
Risk factors via First Street. Map © Google.
Why this score? — see what drove the B grade
The composite is a weighted blend of 9 inputs, each scored 0–100. Each bar is that input's sub-score; the figure is the points it added to the 100-point composite (weight × sub-score).
- Cash flow +30.0/30.0
- ARV discount +12.3/15.0
- DSCR +10.0/10.0
- 1% rule +8.6/10.0
- Rent growth +3.8/5.0
- Livability +3.8/5.0
- Condition / age +2.5/5.0
- Schools +1.0/10.0
- Appreciation +0.0/10.0
$130,000
🖨 Deal sheet 📄 Offer letter ✓ Due diligence
Listing remarks MLS
* INVESTOR ALERT * Recently renovated and tenant occupied 1500+ SQFT 3 Bed / 1 Bath. Monthly rent of $1,650 with HABC. Recent updates include flooring, windows, HVAC, roof, bathroom, etc.
Key facts
- Recent updates
- Hvac
- Roof
Tags
Neighborhood map
What this means for you Summary
Snapshot
- This is a 3-bed/1.0-bath townhouse listed at $130k.
Deal economics
- At list price, monthly cash flow is $517 ($6k/yr) — positive.
- The deal already cash-flows at list — no discount required.
- Meets the 1% rule at list price ($2k rent vs $130k).
- Recommended offer: $114k (12.0% below list) — sets the bar for market timing.
- Cap rate 11.1% vs local median 6.0% in Baltimore — top-decile yield for the area; either an underpriced asset or a hidden risk that comps aren't pricing in. Stress-test before assuming the spread holds.
Location & tenants
- Location reads 76/100 on livability (#90 in MD, #3,396 nationally) — a middle-class / working-renter tenant base. Strengths: amenities A+, commute A+, housing A+; Watch: schools D, crime F.
- Baltimore City Public Schools (urban): math 7% / reading 16% proficiency, ranked #24 of 24 in MD (top 100%) — low school quality limits family demand, transient renter base, plan for 1-2y turnover; 79% free/reduced lunch — lower-income household profile, screen leases tightly.
- Market conditions: Rents rising fast (+5.4%/yr); 252 active listings in the ZIP; 40 comparable units currently listed for rent nearby; rentals at typical pace (median 24d on market — plan ~3-4 weeks tenant-placement turnaround); 40% of comp listings sitting > 30 days — soft ceiling on asking rent; 1,273 units permitted in Baltimore city in 2024 (1,104 in 5+ unit buildings).
- This rent runs 35% of the median local income ($60k/yr) — at the standard rent-burdened threshold; future hikes will face affordability resistance.
Forward outlook
- Local home prices are declining (-3.0%/yr); year-one equity from $899 of loan paydown is wiped out by about $4k of value loss. Plan a longer hold.
- Baltimore County population projected to shrink 4% by 2050 — rents likely to lag national; underwrite the cash flow, not the appreciation.
- At projected returns (-3.0% appreciation + 5.4% rent growth), your $36k cash investment doubles in ~7 years — after that, you're playing with house money.
Negotiation context
- It's been on market 195 days — a 12% lower offer ($114k) is reasonable based on typical stale-listing flexibility.
- 9 sale attempts since 25y ago; this cycle's ask has dropped $10k (7%) from the opening price — seller is motivated, your offer sets the floor, not the list.
- Current owner paid $75k; list at $130k implies a 73% gain — meaningful room to come down on a strong offer.
Risks & watch-outs
- Watch-outs: built in 1929 — expect roof / HVAC / electrical / plumbing capex.
- Climate carrying-cost: major wind risk, 27% chance of damaging wind over 30y; extreme-heat days projected 7→15/yr by 2055 (HVAC capex compounding) — expect insurance premiums to compound above CPI over the hold.
Questions for the listing agent
- It's been on market 195 days. Have you received any prior offers? Is the seller open to a 12% concession, seller financing, or rate buy-down credit?
- Built in 1929 — when were the roof, HVAC, electrical panel, plumbing, and water heater last replaced?
- Why hasn't it sold? Are there any deal-killer items the seller is aware of (foundation, flood, title, zoning, code violations)?
- Is there a deadline driving the sale (1031 exchange, divorce, estate, relocation)? That informs how much negotiation room exists.
- Schools are D-rated, which usually means shorter tenancies and higher turnover. Who's the typical renter profile here, and what's been the actual vacancy rate?
- Crime grade is F in this area — have there been break-ins, vandalism, or insurance claims at this property in the last 3 years? What carrier currently insures it and at what premium?
- What's the average days-on-market for RENTAL listings here right now (not sales)? A rising rental-DOM trend means longer vacancies and softer asking-rent achievability than the comps imply.
- What's the recent tenant-quality profile in this submarket — average credit score on applications, eviction rate, late-payment / NSF rate, and stable-employment percentage? A property-management company in the area should have these aggregated.
- How much new for-sale + rental construction is in the pipeline within 1–3 miles? Heavy new supply typically softens prices + rents 12–24 months out; constrained supply supports both.
Investment metrics
- 1% rule
- 1.36% ✓
- Cap rate
- 11.07%
- Cash-on-cash
- 17.05%
- DSCR
- 1.76
- GRM
- 6.1
CMA / ARV
- ARV (median comp)
- $145,463
- List price
- $130,000
- Delta
- -10.63%
- Verdict
- UNDERPRICED
- Comps
- 20 within 1.0 mi
Show comp detail 12 sales within ~0.75 mi
| Address | Dist | Beds/Ba | Sqft | Sold | Price | $/sf | Match |
|---|---|---|---|---|---|---|---|
| 222 N Hilton St | 0.17mi | 3/1.0 | 1,120 (+3%) | 1mo | $89,775 | $80 | 87 |
| 119 Hilton St | 0.07mi | 2/2.0 (-1) | 1,040 (-5%) | 0mo | $211,000 | $203 | 80 |
| 107 N Monastery Ave | 0.28mi | 2/1.5 (-1) | 1,080 (-1%) | 2mo | $65,000 | $60 | 77 |
| 133 N Monastery Ave | 0.26mi | 2/2.0 (-1) | 1,080 (-1%) | 3mo | $142,000 | $131 | 74 |
| 209 Mount Holly St | 0.49mi | 3/2.0 | 1,080 (-1%) | 2mo | $228,000 | $211 | 70 |
| 3039 Harlem Ave | 0.59mi | 3/1.0 | 1,070 (-2%) | 1mo | $27,500 | $26 | 68 |
| 907 N Rosedale St | 0.72mi | 3/1.0 | 1,088 (-0%) | 4mo | $90,000 | $83 | 62 |
| 3302 W Franklin St | 0.41mi | 3/1.0 | 960 (-12%) | 2mo | $50,000 | $52 | 59 |
| 3306 W Franklin St | 0.41mi | 3/2.0 | 960 (-12%) | 1mo | $51,500 | $54 | 55 |
| 537 Longwood St | 0.54mi | 4/2.0 (+1) | 1,176 (+8%) | 0mo | $60,000 | $51 | 53 |
| 2576 W Baltimore St W | 0.65mi | 3/2.0 | 1,200 (+10%) | 2mo | $152,000 | $127 | 47 |
| 2544 W Fairmount Ave | 0.70mi | 2/1.5 (-1) | 1,204 (+10%) | 2mo | $55,000 | $46 | 41 |
Match score weights: distance 35% · size 25% · config 20% · recency 20%. Top-matched comps best support the ARV.
Projected returns pro-forma
-3.0% appreciation · 5.38% rent growth · sell at horizon
- IRR
- 10.9%
- Equity multiple
- 1.45×
- Total profit
- $16,206
- Equity at exit
- $19,383
- IRR
- 21.8%
- Equity multiple
- 3.07×
- Total profit
- $75,195
- Equity at exit
- $11,240
Cash invested: $36,400 (down + closing). Projections, not guarantees.
Landlord ↔ Tenant lean methodology
- Overall (CITY)
- 12 Strongly Tenant-Friendly
- State Maryland
- 27 Tenant-Leaning · D+14
- County
- — inherits STATE
- City Baltimore
- 12 Strongly Tenant-Friendly · D+58
ZIP-level market 21229
- Rents YoY
- 5.4%
- Active inventory
- 252
- Price-to-rent
- 6.1×
Monthly cashflow live
- Estimated rent
- $1,763 high interval (Pro) →
- Mortgage (P&I)
- −$682
- Tax from tax record
- −$140 /mo · $1,675/yr
- Insurance
- −$54
- HOA
- −$0
- Vacancy / Maint / Mgmt
- −$370
- Net cashflow
- $517
Break-even live
UW: 25.0% down · 7.5% · 30yr · 1.5% tax · 5.0% vac · 8.0% maint · 8.0% mgmt
Financing live
Cash to close
- Down payment
- $32,500
- Closing costs
- $3,900
- Reserves months
- —
- Total cash needed
- —
Loan-product check · same deal, 3 products live
Conventional
25% down · 7.5% · 30yr
- Down + closing
- —
- Monthly P&I
- —
- Monthly cashflow
- —
- DSCR
- —
- Eligible?
- —
Personal DTI + credit; lowest rate.
DSCR
20% down · 8.5% · 30yr
- Down + closing
- —
- Monthly P&I
- —
- Monthly cashflow
- —
- DSCR
- —
- Eligible?
- —
No personal income docs; deal must DSCR.
Hard money
10% down · 12.0% · 12mo
- Down + closing
- —
- Monthly P&I
- —
- Monthly cashflow
- —
- DSCR
- —
- Eligible?
- —
Short-term bridge; refi at stabilization.
Rent comps 40 comps
| Address | Beds | Baths | Sqft | Rent | $/sqft | DOM | Units | Dist |
|---|---|---|---|---|---|---|---|---|
| 3310 Elbert St Baltimore, MD | 2.0 | 1.0 | 920 | $1,550 | $1.68 | 23d | 1 | 0.12mi |
| 3336 W Caton Ave Baltimore, MD | 3.0 | 2.0 | 1236 | $1,625 | $1.31 | 23d | 1 | 0.13mi |
| 41 N Kossuth St Baltimore, MD | 3.0 | 2.0 | 1216 | $1,800 | $1.48 | 23d | 1 | 0.16mi |
| 3607 W Lexington St Baltimore, MD | 3.0 | 2.0 | 1050 | $1,895 | $1.80 | 4d | 1 | 0.39mi |
| 405 N Edgewood St Baltimore, MD | 4.0 | 2.0 | 1408 | $2,950 | $2.10 | 4d | 1 | 0.42mi |
| 3423 Edmondson Ave Baltimore, MD | 2.0 | 1.5 | 1400 | $1,710 | $1.22 | 43d | 1 | 0.51mi |
| 3130 Stafford St Baltimore, MD | 3.0 | 1.0 | 1200 | $1,500 | $1.25 | 20d | 1 | 0.52mi |
| 3507 Edmondson Ave Baltimore, MD | 4.0 | 2.0 | 1428 | $2,300 | $1.61 | 43d | 1 | 0.54mi |
| 2815 W Mulberry St Baltimore, MD | 4.0 | 2.0 | 1040 | $2,050 | $1.97 | 43d | 1 | 0.58mi |
| 3706 W Franklin St Unit 1 Baltimore, MD | 2.0 | 1.0 | 735 | $1,100 | $1.50 | 4d | 1 | 0.59mi |
| 709 Denison St Baltimore, MD | 2.0 | 2.0 | 840 | $1,630 | $1.94 | 23d | 1 | 0.61mi |
| 623 N Grantley St Baltimore, MD | 4.0 | 2.0 | 1250 | $2,000 | $1.60 | 23d | 1 | 0.64mi |
| 212 S Loudon Ave Baltimore, MD | 3.0 | 1.5 | 1310 | $1,550 | $1.18 | 43d | 1 | 0.66mi |
| 3015 Rayner Ave Baltimore, MD | 3.0 | 1.0 | 1152 | $1,350 | $1.17 | 43d | 1 | 0.67mi |
| 730 Linnard St Unit 1 Baltimore, MD | 4.0 | 1.0 | 1360 | $1,750 | $1.29 | 23d | 1 | 0.68mi |
| 4018 Massachusetts Ave Baltimore, MD | 3.0 | 1.0 | 1050 | $1,400 | $1.33 | 23d | 1 | 0.69mi |
| 780 Linnard St Baltimore, MD | 3.0 | 2.0 | 1224 | $1,590 | $1.30 | 43d | 1 | 0.72mi |
| 2537 Hollins St Baltimore, MD | 3.0 | 2.0 | 1200 | $1,450 | $1.21 | 23d | 1 | 0.72mi |
| 787 N Grantley St Baltimore, MD | 3.0 | 1.0 | 1116 | $1,575 | $1.41 | 23d | 1 | 0.74mi |
| 2636 Lauretta Ave Baltimore, MD | 3.0 | 2.5 | 1232 | $1,900 | $1.54 | 43d | 1 | 0.75mi |
| 2516 Hollins St Baltimore, MD | 3.0 | 2.0 | 1100 | $1,700 | $1.55 | 43d | 1 | 0.75mi |
| 3712 Gelston Dr Baltimore, MD | 3.0 | 2.0 | 1250 | $2,500 | $2.00 | 23d | 1 | 0.75mi |
| 2609 Lauretta Ave Baltimore, MD | 3.0 | 1.0 | 1286 | $1,675 | $1.30 | 23d | 1 | 0.76mi |
| 332 S Franklintown Rd Unit 2 Baltimore, MD | 2.0 | 1.0 | 776 | $795 | $1.02 | 23d | 1 | 0.76mi |
| 798 N Grantley St Baltimore, MD | 3.0 | 2.0 | 1360 | $2,295 | $1.69 | 23d | 1 | 0.77mi |
| 304 Collins Ave Unit 2 Baltimore, MD | 3.0 | 1.0 | 1016 | $2,100 | $2.07 | 43d | 1 | 0.80mi |
| 110 S Catherine St Unit 1 Baltimore, MD | 2.0 | 1.0 | 1330 | $1,500 | $1.13 | 43d | 1 | 0.80mi |
| 2540 Frederick Ave Baltimore, MD | 3.0 | 1.0 | 1075 | $1,400 | $1.30 | 23d | 1 | 0.81mi |
| 2657 Lehman St Unit 1 Baltimore, MD | 2.0 | 1.0 | 1056 | $1,000 | $0.95 | 43d | 1 | 0.82mi |
| 2 S Woodington Rd Baltimore, MD | 2.0 | 1.0 | 856 | $1,160 | $1.36 | 14d | 1 | 0.86mi |
| 2 N Woodington Rd Baltimore, MD | 1.0–2.0 | 1.0 | 738 | $1,335 | $1.81 | 3d | 5 | 0.86mi |
| 2738 Wilkens Ave Baltimore, MD | 3.0 | 1.0 | 1183 | $1,500 | $1.27 | 43d | 1 | 0.87mi |
| 4020 Gelston Dr Baltimore, MD | 3.0 | 2.0 | 1270 | $1,875 | $1.48 | 43d | 1 | 0.89mi |
| 2737 Wilkens Ave Baltimore, MD | 3.0 | 1.5 | 1232 | $1,650 | $1.34 | 4d | 1 | 0.90mi |
| 2671 Saint Benedict St Baltimore, MD | 2.0 | 1.0 | 1144 | $1,325 | $1.16 | 43d | 1 | 0.90mi |
| 3392 Saint Benedict St Baltimore, MD | 2.0 | 1.0 | 864 | $1,450 | $1.68 | 23d | 1 | 0.92mi |
| 62 N Gorman Ave Baltimore, MD | 3.0 | 2.0 | 1100 | $2,500 | $2.27 | 17d | 1 | 0.93mi |
| 1042 Ellicott Dr Baltimore, MD | 2.0 | 1.0 | 900 | $1,450 | $1.61 | 43d | 1 | 0.93mi |
| 2744 W Mosher St Baltimore, MD | 4.0 | 2.0 | 1412 | $2,100 | $1.49 | 23d | 1 | 0.96mi |
| 3238 Westmont Ave Baltimore, MD | 3.0 | 1.0 | 1280 | $1,600 | $1.25 | 43d | 1 | 0.98mi |
Listing history 29 events
-
2026-06-08statusdays on market $130,000 Pending 195 DOM
-
2026-06-07days on market $130,000 Active 194 DOM
-
2026-06-04days on market $130,000 Active 191 DOM
-
2026-06-03days on market $130,000 Active 190 DOM
-
2026-06-02days on market $130,000 Active 189 DOM
-
2026-06-01days on market $130,000 Active 188 DOM
-
2026-05-31days on market $130,000 Active 187 DOM
-
2026-02-27price $130,000 188-char remark
Show marketing remark (188 chars)
* INVESTOR ALERT * Recently renovated and tenant occupied 1500+ SQFT 3 Bed / 1 Bath. Monthly rent of $1,650 with HABC. Recent updates include flooring, windows, HVAC, roof, bathroom, etc.
-
2025-11-25$140,000 Active 188-char remark
Show marketing remark (188 chars)
* INVESTOR ALERT * Recently renovated and tenant occupied 1500+ SQFT 3 Bed / 1 Bath. Monthly rent of $1,650 with HABC. Recent updates include flooring, windows, HVAC, roof, bathroom, etc.
-
2023-12-06historical $1,300
-
2023-09-15$1,300
-
2021-06-11soldstatus $75,000 Closed 429-char remark
Show marketing remark (429 chars)
This property is tenant occupied, do not go to the property without an appointment or agent. 5-14-2021- OPEN HOUSE CANCELLED This is a great pick up for an investor. 3 bedrooms, 1 bathroom well kept rental property. Carpet throughout, large bedrooms, and spacious kitchen. The tenant is a long term tenant and wants to stay. You won't want to miss this one. It has great features and well maintained as well as instant cash flow.
-
2021-05-14historical Active Under Contract 429-char remark
Show marketing remark (429 chars)
This property is tenant occupied, do not go to the property without an appointment or agent. 5-14-2021- OPEN HOUSE CANCELLED This is a great pick up for an investor. 3 bedrooms, 1 bathroom well kept rental property. Carpet throughout, large bedrooms, and spacious kitchen. The tenant is a long term tenant and wants to stay. You won't want to miss this one. It has great features and well maintained as well as instant cash flow.
-
2021-05-11price $84,900 429-char remark
Show marketing remark (429 chars)
This property is tenant occupied, do not go to the property without an appointment or agent. 5-14-2021- OPEN HOUSE CANCELLED This is a great pick up for an investor. 3 bedrooms, 1 bathroom well kept rental property. Carpet throughout, large bedrooms, and spacious kitchen. The tenant is a long term tenant and wants to stay. You won't want to miss this one. It has great features and well maintained as well as instant cash flow.
-
2021-04-12$89,900 Active 429-char remark
Show marketing remark (429 chars)
This property is tenant occupied, do not go to the property without an appointment or agent. 5-14-2021- OPEN HOUSE CANCELLED This is a great pick up for an investor. 3 bedrooms, 1 bathroom well kept rental property. Carpet throughout, large bedrooms, and spacious kitchen. The tenant is a long term tenant and wants to stay. You won't want to miss this one. It has great features and well maintained as well as instant cash flow.
-
2018-05-05historical
-
2018-05-05historical Withdrawn
-
2018-04-25$59,995 Active
-
2018-04-25Active
-
2018-01-01historical Expired
-
2017-04-04Active
-
2017-04-04$64,995 Active
-
2003-06-19soldstatus $38,000
-
2003-05-10soldstatus $38,000
-
2003-03-10historical
-
2003-03-06$42,500
-
2002-06-17historical
-
2001-06-27
-
1983-09-29soldstatus $17,900
ⓘ Source: listings_history table (triggers on properties + properties_extension) + one-shot
backfill from property_details.listing_events for pre-trigger history.
Tax reassessment forecast MD · Partial reset (capped growth)
- Current annual tax
- $1,675 · $140/mo
- Projected year-2 tax
- $1,675 · $140/mo
- Expected delta
- $0/yr ($0/mo · 0.0%)
ⓘ Screening estimate from a state-policy table — verify with the county assessor before closing.
Climate risk First Street
- Flood 1/10 Low FEMA zone X (unshaded) · 0% chance over 30 yrs
- Wildfire 1/10 Low
- Heat 7/10 Severe 7 d/yr ≥103°F today · 15 d/yr by 30 yrs out
- Wind 6/10 Major 27% chance of damaging wind over 30 yrs
- Air quality 3/10 Moderate 3 unhealthy d/yr today · 4 by 30 yrs out
Nearby sold comps map
Loading sold comps map…
Walkable amenities ~0.75 mi
Loading nearby amenities…
Taxation est. · year 1
- Rental income
- $21,154
- − Mortgage interest
- −$7,282
- − Property taxes
- −$1,675
- − Insurance
- −$650
- − Repairs & maintenance
- −$1,692
- − Management
- −$1,692
- − Depreciation
- −$3,782
- Taxable income
- $4,380
- Est. tax owed @ 24.0%
- −$1,051
- After-tax cash flow
- $5,154/yr
For passive investors: Depreciation is non-cash, so a rental often shows a tax loss while cash-flowing — sheltering income. Rental losses are passive: they offset passive income freely, and up to $25,000/yr can offset ordinary (W-2) income if you actively participate and your MAGI is under $100k (phasing out to $0 by $150k); unused losses carry forward. On sale, claimed depreciation is recaptured at up to 25%, and gains may owe capital-gains tax (a 1031 exchange can defer both). Figures are a year-1 estimate at your 24.0% rate — not tax advice; consult a CPA.
Schools (NCES district)
- District
- Baltimore City Public Schools
- NCES district ID
- 2400090
- Math proficiency
- 7% ▼ -9.00%
- Reading proficiency
- 16% ▼ -5.00%
- Median HH income
- $42,108
- Composite
- 10.08/100
- National rank
- #9805
- State rank
- #24 of 24 in MD
Livability — Baltimore
- Score
- 76/100
- State rank
- #90
- US rank
- #3396
Category grades
Schools grade is shown separately in the Schools card above.
Census & demographics
- Census place
- Baltimore, MD
- County
- Baltimore City · 558,601 people
- City population
- 588,727
- Metro
- Baltimore-Columbia-Towson, MD
- Population (ZIP)
- 46,679
- Household income
- $60,047
- Rent vs Own
- Severe rent burden
- 2776.0
Population outlook (Baltimore County) Hauer SSP2
- Today (2025)
- 624,249 people
- By 2030
- 621,541 · -0.4%
- By 2040
- 609,756 · -2.3%
- By 2050
- 597,249 · -4.3%
- By 2075
- 552,236 · -11.5%
- By 2100
- 513,934 · -17.7%
Race, ethnicity, and origin ACS 2023
- Neighborhood character
- Predominantly Black (73%)
- Race & ethnicity
- Black 73% White 15% Hispanic / Latino 6% Two or more races 4% Asian 3%
- Hispanic origin (detail)
- Common ancestry
- Lithuanian 1% Romanian 1% Serbian 1%
- Foreign-born
- 5% · Canada, Philippines
- Languages at home
- 91% English-only · Spanish 4% Other Indo-European 2% Other Asian/Pacific 1%
Political lean MEDSL · Baltimore
- 2024 margin
- Solid D (+73.0) · D 85.2% · R 12.2% · Other 2.6%
- 2008→2024 swing
- -2.5pp toward R · 2008: 75.5pp · 2024: 73.0pp
- All cycles
- 2024: D+73.0 2020: D+76.6 2016: D+74.6 2012: D+76.4 2008: D+75.5
Not yet ingested
- Civics
- —
Market trends
- HPI YoY
- ▼ -259.07%
- Current HPI
- 226.896
- Rent YoY
- ▲ 5.38%
- Metro
- Baltimore-Columbia-Towson, MD
- State GDP YoY
- ▲ 2.97%
- F500 in state
- 12
Industry mix (Fortune 500 HQ in MD)
| Industry | F500 HQs | Revenue |
|---|---|---|
| Aerospace / Defense | 1 | $71B |
|
||
| Utilities | 1 | $25B |
|
||
| Hotels | 1 | $24B |
|
||
| Consumer Goods | 1 | $7B |
|
||
| Real Estate | 1 | $6B |
|
||
| Chemicals | 1 | $2B |
|
||
Price history
+626.3% since first listed22 events — show timeline
- 2026-02-27 Price Changed $130,000 BRIGHT MLS
- 2025-11-25 Listed $140,000 BRIGHT MLS
- 2023-12-06 Rental Removed $1,300 APPFOLIO
- 2023-09-15 Listed for Rent $1,300 APPFOLIO
- 2021-06-11 Sold (MLS) $75,000 BRIGHT MLS
- 2021-05-14 Contingent — BRIGHT MLS
- 2021-05-11 Price Changed $84,900 BRIGHT MLS
- 2021-04-12 Listed $89,900 BRIGHT MLS
- 2018-05-05 Listing Removed — BRIGHT MLS
- 2018-05-05 Delisted — MRIS
- 2018-04-25 Listed — MRIS
- 2018-04-25 Listed $59,995 BRIGHT MLS
- 2018-01-01 Delisted — MRIS
- 2017-04-04 Listed — MRIS
- 2017-04-04 Listed $64,995 BRIGHT MLS
- 2003-06-19 Sold (Public Records) $38,000 Public Records
- 2003-05-10 Sold (MLS) $38,000 MRIS
- 2003-03-10 Delisted — MRIS
- 2003-03-06 Listed $42,500 MRIS
- 2002-06-17 Delisted — MRIS
- 2001-06-27 Listed — MRIS
- 1983-09-29 Sold (Public Records) $17,900 Public Records
Property tax history
+0.0%/yrLatest (2025): $1,675 · -1.5% YoY. Source: county tax records.
Cash-flow waterfall
monthlySold comps — $/sqft
last 12 mo · ≤1 miLoading sold comps…