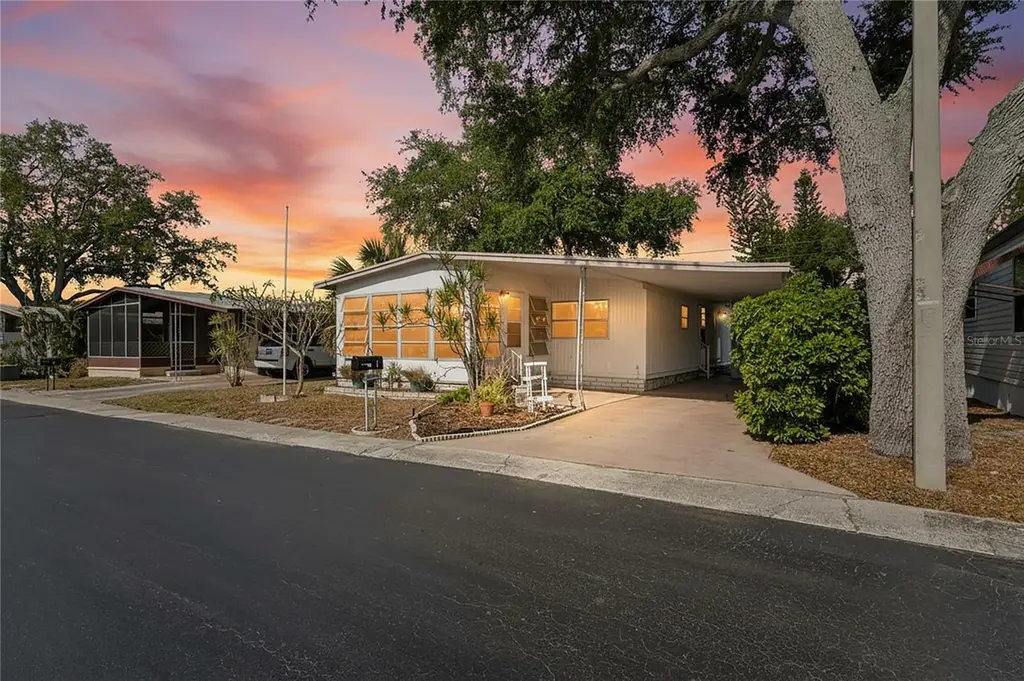
6950 46th Ave N #1 · West Lealman, FL
Flood risk 4/10 · Minor
- FEMA flood zone
- X (unshaded)
- Chance of flooding over 30 yrs
- 0.23%
- Est. flood insurance / yr
- $507 – $1,088
Fire risk 1/10 · Minimal
- Est. fire insurance / yr
- $947 – $1,759
Heat risk 10/10 · Severe
- Hot days now (above 107°F)
- 7 days/yr
- Hot days in 30 yrs
- 23 days/yr
Wind risk 10/10 · Severe
- Chance of severe wind over 30 yrs
- 99.0%
Air-quality risk 4/10 · Minor
- Unhealthy air days now
- 4 days/yr
- Unhealthy air days in 30 yrs
- 4 days/yr
Risk factors via First Street. Map © Google.
Why this score? — see what drove the B grade
The composite is a weighted blend of 9 inputs, each scored 0–100. Each bar is that input's sub-score; the figure is the points it added to the 100-point composite (weight × sub-score).
- Cash flow +30.0/30.0
- 1% rule +10.0/10.0
- DSCR +10.0/10.0
- ARV discount +7.5/15.0
- Schools +4.3/10.0
- Livability +4.0/5.0
- Rent growth +2.7/5.0
- Condition / age +2.5/5.0
- Appreciation +0.0/10.0
$110,000
🖨 Deal sheet 📄 Offer letter ✓ Due diligence
Listing remarks
Motivated Seller!! Welcome to this charming and conveniently located mobile home in a 55+ park, Victory Estates. This community offers a peaceful setting while being just minutes from shopping, dining, Bay Pines, and entertainment options. You’re also a short drive from beautiful Gulf beaches, parks, and vibrant downtown St. Pete. This well-maintained home offers comfortable living with an open layout that maximizes space and natural light. Enjoy easy access with no stairs, making daily living a breeze. Ideal for a primary residence, seasonal getaway, don’t miss your chance to own a slice of Florida living at an affordable price!
Key facts
- Open layout
- Peaceful setting
- 6.98 acre lot
Tags
Property features AI
Finance
- Other: Total lot approximately 6.98 acres; Living area reported as 960 (source: public records); Building area reported as 1,776 (source: public records)
- HOA & community: Has HOA — $300 monthly; Community clubhouse; Community pool; Buyer approval required; Senior community; No pets allowed
Exterior
- Parking: Has carport; 1 carport space
- Utilities: Public water; Public sewer; Electricity connected; Cable available; Broadband/high-speed internet available
- Home design: Manufactured home (double wide); One story; Northeast facing; Entry level: One
- Construction: Metal siding; Metal roof; Crawlspace foundation; Built as a manufactured double wide
- Exterior features: Awning(s); Asphalt road access
Interior
- Kitchen: Built-in oven; Range; Range hood; Dishwasher; Refrigerator
- Bedrooms: 2 bedrooms
- Flooring: Laminate flooring
- Bathrooms: 2 full bathrooms
- Heating & cooling: Central heating; Central air conditioning
- Interior features: Ceiling fans; Thermostat; Walk-in closet(s)
- Laundry & utility: Washer hookup; Electric dryer hookup; Laundry inside
Neighborhood map
What this means for you Summary
Snapshot
- This is a 2-bed/2.0-bath manufactured listed at $110k.
Deal economics
- At list price, monthly cash flow is $462 ($6k/yr) — positive.
- The deal already cash-flows at list — no discount required.
- Meets the 1% rule at list price ($2k rent vs $110k).
- Cap rate 11.3% vs local median 1.8% in West Lealman — top-decile yield for the area; either an underpriced asset or a hidden risk that comps aren't pricing in. Stress-test before assuming the spread holds.
Location & tenants
- Location reads 81/100 on livability (#84 in FL, #1,396 nationally) — a professional / high-income tenant draw. Strengths: commute A+, cost of living A+, housing A+; Watch: schools C-, employment D+, amenities F.
- Pinellas (suburban): math 51% / reading 51% proficiency, ranked #31 of 73 in FL (top 42%) — acceptable for families but not a draw, mixed tenant base, ~2y average lease.
- Market conditions: Rents flat; 309 active listings in the ZIP; 40 comparable units currently listed for rent nearby; rentals at typical pace (median 22d on market — plan ~3-4 weeks tenant-placement turnaround); 2,676 units permitted in Pinellas County in 2024 (1,422 in 5+ unit buildings).
- This rent runs 40% of the median local income ($54k/yr) — at the standard rent-burdened threshold; future hikes will face affordability resistance.
Forward outlook
- Local home prices are declining (-3.0%/yr); year-one equity from $761 of loan paydown is wiped out by about $3k of value loss. Plan a longer hold.
- Pinellas County population projected at +14% by 2050 — modest demand growth; plan on rents tracking national, not racing it.
- At projected returns (-3.0% appreciation + 1.0% rent growth), your $31k cash investment doubles in ~9 years — after that, you're playing with house money.
Negotiation context
- Only 11 days on market — expect competitive offers; lowballing is unlikely to land.
- 2 sale attempts with the ask held roughly flat each time — persistent listings suggest the price (not the market) is what's stuck; bring a comps-based counter.
Risks & watch-outs
- Climate carrying-cost: severe wind risk, 99% chance of damaging wind over 30y; extreme-heat days projected 7→23/yr by 2055 (HVAC capex compounding) — expect insurance premiums to compound above CPI over the hold.
Questions for the listing agent
- Built in 1979 — when were the roof, HVAC, electrical panel, plumbing, and water heater last replaced?
- What does the HOA fee cover, when was the last increase, and are there any pending special assessments or reserve-fund shortfalls?
- Is there a deadline driving the sale (1031 exchange, divorce, estate, relocation)? That informs how much negotiation room exists.
- What's the average days-on-market for RENTAL listings here right now (not sales)? A rising rental-DOM trend means longer vacancies and softer asking-rent achievability than the comps imply.
- What's the recent tenant-quality profile in this submarket — average credit score on applications, eviction rate, late-payment / NSF rate, and stable-employment percentage? A property-management company in the area should have these aggregated.
- How much new for-sale + rental construction is in the pipeline within 1–3 miles? Heavy new supply typically softens prices + rents 12–24 months out; constrained supply supports both.
Investment metrics
- 1% rule
- 1.62% ✓
- Cap rate
- 11.33%
- Cash-on-cash
- 18.00%
- DSCR
- 1.80
- GRM
- 5.1
CMA / ARV
- ARV (on-the-fly)
- $72,000
- Comps found
- 1
Show comp detail 1 sale within ~0.75 mi
| Address | Dist | Beds/Ba | Sqft | Sold | Price | $/sf | Match |
|---|---|---|---|---|---|---|---|
| 4173 72nd St N #30 | 0.30mi | 2/2.0 | 912 (-5%) | 4mo | $68,000 | $75 | 74 |
Match score weights: distance 35% · size 25% · config 20% · recency 20%. Top-matched comps best support the ARV.
Projected returns pro-forma
-3.0% appreciation · 0.99% rent growth · sell at horizon
- IRR
- 7.0%
- Equity multiple
- 1.27×
- Total profit
- $8,200
- Equity at exit
- $16,401
- IRR
- 14.3%
- Equity multiple
- 2.03×
- Total profit
- $31,646
- Equity at exit
- $9,511
Cash invested: $30,800 (down + closing). Projections, not guarantees.
Landlord ↔ Tenant lean methodology
- Overall (STATE)
- 87 Strongly Landlord-Friendly
- State Florida
- 87 Strongly Landlord-Friendly · R+3
- County
- — inherits STATE
- City
- — inherits STATE
ZIP-level market 33709
- Rents YoY
- 1.0%
- Active inventory
- 309
- Price-to-rent
- 5.1×
Monthly cashflow live
- Estimated rent
- $1,787 high interval (Pro) →
- Mortgage (P&I)
- −$577
- Tax from tax record
- −$27 /mo · $327/yr
- Insurance
- −$46
- HOA
- −$300
- Vacancy / Maint / Mgmt
- −$375
- Net cashflow
- $462
Break-even live
UW: 25.0% down · 7.5% · 30yr · 1.5% tax · 5.0% vac · 8.0% maint · 8.0% mgmt
Financing live
Cash to close
- Down payment
- $27,500
- Closing costs
- $3,300
- Reserves months
- —
- Total cash needed
- —
Loan-product check · same deal, 3 products live
Conventional
25% down · 7.5% · 30yr
- Down + closing
- —
- Monthly P&I
- —
- Monthly cashflow
- —
- DSCR
- —
- Eligible?
- —
Personal DTI + credit; lowest rate.
DSCR
20% down · 8.5% · 30yr
- Down + closing
- —
- Monthly P&I
- —
- Monthly cashflow
- —
- DSCR
- —
- Eligible?
- —
No personal income docs; deal must DSCR.
Hard money
10% down · 12.0% · 12mo
- Down + closing
- —
- Monthly P&I
- —
- Monthly cashflow
- —
- DSCR
- —
- Eligible?
- —
Short-term bridge; refi at stabilization.
Rent comps 40 comps
| Address | Beds | Baths | Sqft | Rent | $/sqft | DOM | Units | Dist |
|---|---|---|---|---|---|---|---|---|
| 4390 68th St N Saint Petersburg, FL | 3.0 | 1.0 | 864 | $1,950 | $2.26 | 24d | 1 | 0.03mi |
| 4711 Sunnydale Ln N Unit A St. Petersburg, FL | 2.0 | 1.0 | 800 | $1,750 | $2.19 | 24d | 1 | 0.20mi |
| 4701 68th St N Saint Petersburg, FL | 1.0 | 1.0 | 700 | $1,099 | $1.57 | 24d | 1 | 0.25mi |
| 6801 48th Ave N Unit B St. Petersburg, FL | 1.0 | 1.0 | 650 | $1,525 | $2.35 | 24d | 1 | 0.26mi |
| 4801 71st St N St Petersburg, FL | 2.0 | 1.0 | 726 | $1,900 | $2.62 | 18d | 1 | 0.29mi |
| 4801 71st St N Saint Petersburg, FL | 2.0 | 1.0 | 726 | $1,900 | $2.62 | 4d | 1 | 0.29mi |
| 7317 46th Ave N Unit 4 St. Petersburg, FL | 1.0 | 1.0 | 528 | $1,200 | $2.27 | 14d | 1 | 0.37mi |
| 6538 42nd Ave N Unit 7 Kenneth City, FL | 2.0 | 1.0 | 648 | $2,000 | $3.09 | 24d | 1 | 0.42mi |
| 5136 68th St N Unit C St. Petersburg, FL | 2.0 | 1.0 | 957 | $1,700 | $1.78 | 4d | 1 | 0.45mi |
| 3855 39th Ave N St Petersburg, FL | 2.0 | 2.5 | 1100 | $1,850 | $1.68 | 22d | 1 | 0.59mi |
| 3556 66th St N St. Petersburg, FL | 1.0 | 1.0 | 610 | $1,300 | $2.13 | 15d | 1 | 0.61mi |
| 3980 64th St N Saint Petersburg, FL | 1.0–2.0 | 1.0–2.0 | 707 | $1,500 | $2.12 | 3d | 6 | 0.63mi |
| 6522 54th Ave N Saint Petersburg, FL | 1.0–3.0 | 1.0–2.0 | 892 | $1,600 | $1.79 | 2d | 10 | 0.66mi |
| 5411 70th Ln N Saint Petersburg, FL | 2.0 | 1.0 | 600 | $1,800 | $3.00 | 24d | 1 | 0.67mi |
| 6524 54th Ave N Unit 2 St. Petersburg, FL | 2.0 | 1.0 | 840 | $1,360 | $1.62 | 24d | 1 | 0.75mi |
| 7140 55th Ave N Saint Petersburg, FL | 3.0 | 2.0 | 1085 | $2,000 | $1.84 | 22d | 1 | 0.75mi |
| 7249 Parkside Villas Dr N Saint Petersburg, FL | 2.0 | 2.0 | 956 | $1,950 | $2.04 | 24d | 1 | 0.77mi |
| 7238 55th Ave N Saint Petersburg, FL | 2.0 | 2.0 | 1085 | $1,899 | $1.75 | 18d | 1 | 0.78mi |
| 6423 34th Ter N Saint Petersburg, FL | 3.0 | 1.0 | 900 | $2,200 | $2.44 | 4d | 1 | 0.81mi |
| 3000 70th Ln N Saint Petersburg, FL | 2.0 | 1.0 | 875 | $1,600 | $1.83 | 22d | 1 | 0.88mi |
| 7045 30th Ave N Saint Petersburg, FL | 1.0–2.0 | 1.0–2.0 | 825 | $1,595 | $1.93 | 8d | 1 | 0.88mi |
| 7801 34th Ave N #88 Saint Petersburg, FL | 2.0 | 1.0 | 624 | $1,400 | $2.24 | 24d | 1 | 0.98mi |
| 7801 34th Ave N #88 Saint Petersburg, FL | 2.0 | 1.0 | 624 | $1,300 | $2.08 | 2d | 1 | 0.98mi |
| 8002 48th Ave N Saint Petersburg, FL | 1.0 | 1.0 | 1050 | $2,000 | $1.90 | 3d | 1 | 1.01mi |
| 2871 67th St N Saint Petersburg, FL | 3.0 | 1.0 | 1075 | $2,500 | $2.33 | 24d | 1 | 1.01mi |
| 5255 62nd St N Kenneth City, FL | 1.0–3.0 | 1.0–2.0 | 1000 | $1,538 | $1.54 | 3d | 2 | 1.02mi |
| 6190 36th Ave N Saint Petersburg, FL | 2.0 | 1.0 | 1008 | $2,500 | $2.48 | 4d | 1 | 1.03mi |
| 5217 81st St N #22 Saint Petersburg, FL | 2.0 | 1.0 | 1010 | $1,700 | $1.68 | 24d | 1 | 1.12mi |
| 5521 80th St N #312 Saint Petersburg, FL | 1.0 | 1.0 | 1055 | $1,500 | $1.42 | 4d | 1 | 1.14mi |
| 5357 81st St N #14 Saint Petersburg, FL | 2.0 | 2.0 | 1110 | $1,550 | $1.40 | 24d | 1 | 1.14mi |
| 5287 81st St N #26 Saint Petersburg, FL | 2.0 | 2.0 | 1010 | $1,500 | $1.49 | 4d | 1 | 1.15mi |
| 6215 58th Ave N Saint Petersburg, FL | 2.0 | 1.0 | 850 | $1,900 | $2.24 | 4d | 1 | 1.19mi |
| 6366 71st St N Pinellas Park, FL | 2.0 | 2.0 | 970 | $2,200 | $2.27 | 24d | 1 | 1.22mi |
| 5530 80th St N Unit C204 Saint Petersburg, FL | 1.0 | 1.0 | 880 | $1,450 | $1.65 | 24d | 1 | 1.23mi |
| 5323 59th Cir W Kenneth City, FL | 1.0–2.0 | 1.0 | 800 | $1,375 | $1.72 | 3d | 4 | 1.24mi |
| 5725 80th St N #210 Saint Petersburg, FL | 2.0 | 2.0 | 1125 | $1,900 | $1.69 | 24d | 1 | 1.25mi |
| 5257 81st Ln N #6 Saint Petersburg, FL | 1.0 | 1.0 | 745 | $1,375 | $1.85 | 24d | 1 | 1.25mi |
| 5870 38th Ave N #40 Saint Petersburg, FL | 2.0 | 1.0 | 985 | $1,800 | $1.83 | 17d | 1 | 1.31mi |
| 5750 80th St N St Petersburg, FL | 1.0–2.0 | 1.0–1.5 | 987 | $1,800 | $1.82 | 24d | 2 | 1.31mi |
| 5980 80th St N #205 St Petersburg, FL | 2.0 | 2.0 | 1100 | $1,950 | $1.77 | 4d | 1 | 1.32mi |
HOA detail
- Monthly dues
- $300 · $3,600/yr
Listing history 5 events
-
2026-05-11status Pending
-
2026-04-30$110,000 Active
-
2026-01-31historical
-
2026-01-07price $118,000
-
2025-12-01$130,000 Active
ⓘ Source: listings_history table (triggers on properties + properties_extension) + one-shot
backfill from property_details.listing_events for pre-trigger history.
Tax reassessment forecast FL · Resets to sale price
- Current annual tax
- $327 · $27/mo
- Projected year-2 tax
- $913 · $76/mo
- Expected delta
- +$586/yr (+$49/mo · 179.2%)
ⓘ Screening estimate from a state-policy table — verify with the county assessor before closing.
Climate risk First Street
- Flood 4/10 Moderate FEMA zone X (unshaded) · 23% chance over 30 yrs
- Wildfire 1/10 Low
- Heat 10/10 Extreme 7 d/yr ≥107°F today · 23 d/yr by 30 yrs out
- Wind 10/10 Extreme 99% chance of damaging wind over 30 yrs
- Air quality 4/10 Moderate 4 unhealthy d/yr today · 4 by 30 yrs out
Nearby sold comps map
Loading sold comps map…
Walkable amenities ~0.75 mi
Loading nearby amenities…
Taxation est. · year 1
- Rental income
- $21,447
- − Mortgage interest
- −$6,162
- − Property taxes
- −$327
- − Insurance
- −$550
- − Repairs & maintenance
- −$1,716
- − Management
- −$1,716
- − HOA
- −$3,600
- − Depreciation
- −$3,200
- Taxable income
- $4,177
- Est. tax owed @ 24.0%
- −$1,002
- After-tax cash flow
- $4,541/yr
For passive investors: Depreciation is non-cash, so a rental often shows a tax loss while cash-flowing — sheltering income. Rental losses are passive: they offset passive income freely, and up to $25,000/yr can offset ordinary (W-2) income if you actively participate and your MAGI is under $100k (phasing out to $0 by $150k); unused losses carry forward. On sale, claimed depreciation is recaptured at up to 25%, and gains may owe capital-gains tax (a 1031 exchange can defer both). Figures are a year-1 estimate at your 24.0% rate — not tax advice; consult a CPA.
Schools (NCES district)
- District
- Pinellas
- NCES district ID
- 1201560
- Math proficiency
- 51% ▼ -5.00%
- Reading proficiency
- 51% ▼ -3.00%
- Median HH income
- $46,270
- Composite
- 43.27/100
- National rank
- #3046
- State rank
- #31 of 73 in FL
Livability — West Lealman
- Score
- 81/100
- State rank
- #84
- US rank
- #1396
Category grades
Schools grade is shown separately in the Schools card above.
Census & demographics
- Census place
- West Lealman, FL
- County
- Pinellas County · 939,478 people
- Metro
- Tampa-St. Petersburg-Clearwater, FL
- Population (ZIP)
- 25,050
- Household income
- $53,501
- Rent vs Own
- Severe rent burden
- 712.0
Population outlook (Pinellas County) Hauer SSP2
- Today (2025)
- 1,027,532 people
- By 2030
- 1,063,586 · +3.5%
- By 2040
- 1,125,020 · +9.5%
- By 2050
- 1,168,637 · +13.7%
- By 2075
- 1,265,188 · +23.1%
- By 2100
- 1,260,357 · +22.7%
Race, ethnicity, and origin ACS 2023
- Neighborhood character
- Predominantly White (73%)
- Race & ethnicity
- White 73% Hispanic / Latino 11% Two or more races 10% Black 5% Asian 5%
- Hispanic origin (detail)
- Mexican 2% Puerto Rican 3% Cuban 2% Dominican 1%
- Common ancestry
- Lithuanian 3% Romanian 3% Slovak 2%
- Foreign-born
- 14% · Canada, Vietnam, Jamaica
- Languages at home
- 84% English-only · Spanish 9% Other Indo-European 2% Vietnamese 2%
Political lean MEDSL · Pinellas
- 2024 margin
- Lean R (+5.2) · D 46.9% · R 52.1%
- 2008→2024 swing
- -13.5pp toward R · 2008: 8.3pp · 2024: -5.2pp
- All cycles
- 2024: R+5.2 2020: D+0.2 2016: R+1.1 2012: D+5.6 2008: D+8.3
Not yet ingested
- Civics
- —
Market trends
- HPI YoY
- ▼ -416.74%
- Current HPI
- 391.368
- Rent YoY
- ▲ 0.99%
- Metro
- Tampa-St. Petersburg-Clearwater, FL
- State GDP YoY
- ▲ 3.28%
- F500 in state
- 36
Industry mix (Fortune 500 HQ in FL)
| Industry | F500 HQs | Revenue |
|---|---|---|
| Industrial Technology | 2 | $29B |
|
||
| Insurance | 2 | $17B |
|
||
| Retail | 1 | $60B |
|
||
| Technology Distribution | 1 | $58B |
|
||
| Homebuilding | 1 | $35B |
|
||
| Technology Manufacturing | 1 | $35B |
|
||
Price history
-15.4% since first listed5 events — show timeline
- 2026-05-11 Pending — Stellar MLS as Distributed by MLS Grid
- 2026-04-30 Listed $110,000 Stellar MLS as Distributed by MLS Grid
- 2026-01-31 Listing Removed — Stellar MLS as Distributed by MLS Grid
- 2026-01-07 Price Changed $118,000 Stellar MLS as Distributed by MLS Grid
- 2025-12-01 Listed $130,000 Stellar MLS as Distributed by MLS Grid
Property tax history
-6.5%/yrLatest (2025): $327 · +9.7% YoY. Source: county tax records.
Cash-flow waterfall
monthlySold comps — $/sqft
last 12 mo · ≤1 miLoading sold comps…