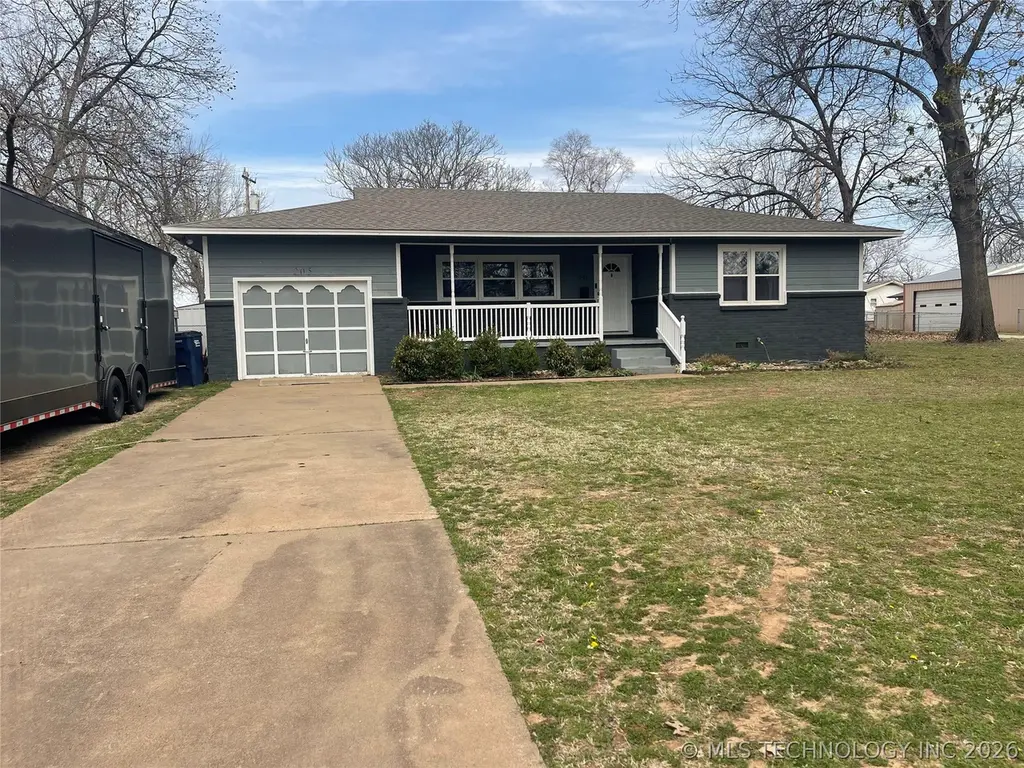
205 W Kaw Ave · Cleveland, OK
Flood risk 1/10 · Minimal
- FEMA flood zone
- —
- Chance of flooding over 30 yrs
- 0.0%
- Est. flood insurance / yr
- —
Fire risk 6/10 · Moderate
- Est. fire insurance / yr
- $2,463 – $4,575
Heat risk 6/10 · Moderate
- Hot days now (above 110°F)
- 7 days/yr
- Hot days in 30 yrs
- 19 days/yr
Wind risk 2/10 · Minimal
- Chance of severe wind over 30 yrs
- 4.0%
Air-quality risk 2/10 · Minimal
- Unhealthy air days now
- 0 days/yr
- Unhealthy air days in 30 yrs
- 1 days/yr
Risk factors via First Street. Map © Google.
Why this score? — see what drove the C grade
The composite is a weighted blend of 9 inputs, each scored 0–100. Each bar is that input's sub-score; the figure is the points it added to the 100-point composite (weight × sub-score).
- Cash flow +19.8/30.0
- Appreciation +10.0/10.0
- ARV discount +6.4/15.0
- DSCR +6.3/10.0
- 1% rule +4.1/10.0
- Livability +3.4/5.0
- Rent growth +2.5/5.0
- Condition / age +2.5/5.0
- Schools +1.8/10.0
$168,000
🖨 Deal sheet 📄 Offer letter ✓ Due diligence
Listing remarks
"Spacious Property with Endless Possibilities! Welcome to this charming 2-bedroom, 1.5-bath home setting on an impressive six lots, offering plenty of room to enjoy both indoors and out. This home features original hard wood floors and a spacious kitchen with all matching, updated appliances, making it move-in ready. One of the standout features is the second living area, which offers incredible flexibility. It can easily serve as a third bedroom, game room, home office, or be converted back into the garage it originally was—giving you the freedom to make the space fit your needs. Step outside and enjoy the large front and back yard, perfect for entertaining, gardening, or simpl
Key facts
- Covered front porch
- Mature pecan trees
- Second living area
Tags
Property features AI
Finance
- HOA & community: Sidewalks
Exterior
- Parking: Carport; 1-car garage
- Security: Smoke detector(s); No safety shelter
- Utilities: Public water; Public sewer; Electricity available; Natural gas available; Fiber optic available
- Home design: Single-story home; Faces south; Crawlspace foundation
- Construction: Brick, Masonite and wood frame construction; Asphalt/fiberglass roof; Built according to public records
- Exterior features: Covered porch; Concrete driveway; Shed(s); Chain link fencing; Fruit trees; Mature trees; Less than 1 mile to Arkansas River
Interior
- Kitchen: Country-style kitchen; Cooktop; Oven; Range; Microwave; Dishwasher; Disposal; Refrigerator; Gas range/oven connections
- Bedrooms: Master bedroom (first floor); Additional bedroom (first floor)
- Flooring: Hardwood; Carpet; Vinyl
- Bathrooms: One full bathroom with bathtub, separate shower and whirlpool (first floor); One half bathroom (first floor)
- Heating & cooling: Central heating (electric); Central air conditioning
- Interior features: High ceilings; Ceiling fan(s); High speed internet available; Laminate counters; Vinyl window frames
- Laundry & utility: Washer hookup; Electric dryer hookup; Utility room (inside, first floor)
Neighborhood map
What this means for you Summary
Snapshot
- This is a 2-bed/2.0-bath single-family listed at $168k.
Deal economics
- At list price, monthly cash flow is $200 ($2k/yr) — positive.
- The deal already cash-flows at list — no discount required.
- To meet the 1% rule (rent ≥ 1% of price), the offer needs to be $153k (9.0% below list).
- Recommended offer: $153k (9.0% below list) — sets the bar for market timing.
- Cap rate 7.7% vs local median 6.4% in Cleveland — meaningfully above typical; check what's discounted (condition, days-on-market, listing class) to confirm the premium yield is real.
Location & tenants
- Location reads 67/100 on livability (#93 in OK) — a middle-class / working-renter tenant base. Strengths: cost of living A+, housing A+; Watch: crime C-, employment C-, schools D-.
- Cleveland (town): math 21% / reading 19% proficiency, ranked #169 of 270 in OK (top 63%) — low school quality limits family demand, transient renter base, plan for 1-2y turnover.
- Market conditions: 86 active listings in the ZIP; 3 units permitted in Pawnee County in 2024 (0 in 5+ unit buildings).
Forward outlook
- In year one you build about $18k of equity ($1k loan paydown + $17k appreciation (10.0% local appreciation)).
- Pawnee County population projected to shrink 4% by 2050 — rents likely to lag national; underwrite the cash flow, not the appreciation.
- At projected returns (10.0% appreciation + 3.0% rent growth), your $47k cash investment doubles in ~3 years — after that, you're playing with house money.
- By year 3, paydown + projected appreciation supports a ~$45k cash-out refi (75% LTV) — recoverable capital for the next deal without selling this one.
Negotiation context
- It's been on market 92 days — a 9% lower offer ($153k) is reasonable based on typical stale-listing flexibility.
- Current owner paid $52k; list at $168k implies a 226% gain — meaningful room to come down on a strong offer.
Risks & watch-outs
- Climate carrying-cost: major wildfire risk; extreme-heat days projected 7→19/yr by 2055 (HVAC capex compounding) — expect insurance premiums to compound above CPI over the hold.
Questions for the listing agent
- It's been on market 92 days. Have you received any prior offers? Is the seller open to a 9% concession, seller financing, or rate buy-down credit?
- Built in 1960 — when were the roof, HVAC, electrical panel, plumbing, and water heater last replaced?
- Why hasn't it sold? Are there any deal-killer items the seller is aware of (foundation, flood, title, zoning, code violations)?
- Is there a deadline driving the sale (1031 exchange, divorce, estate, relocation)? That informs how much negotiation room exists.
- Schools are D-rated, which usually means shorter tenancies and higher turnover. Who's the typical renter profile here, and what's been the actual vacancy rate?
- What's the average days-on-market for RENTAL listings here right now (not sales)? A rising rental-DOM trend means longer vacancies and softer asking-rent achievability than the comps imply.
- What's the recent tenant-quality profile in this submarket — average credit score on applications, eviction rate, late-payment / NSF rate, and stable-employment percentage? A property-management company in the area should have these aggregated.
- How much new for-sale + rental construction is in the pipeline within 1–3 miles? Heavy new supply typically softens prices + rents 12–24 months out; constrained supply supports both.
Investment metrics
- 1% rule
- 0.91% ✗
- Cap rate
- 7.72%
- Cash-on-cash
- 5.09%
- DSCR
- 1.23
- GRM
- 9.2
CMA / ARV
- ARV (on-the-fly)
- $164,060
- Comps found
- 12
Show comp detail 12 sales within ~0.75 mi
| Address | Dist | Beds/Ba | Sqft | Sold | Price | $/sf | Match |
|---|---|---|---|---|---|---|---|
| 606 N B Ave | 0.11mi | 3/1.0 (+1) | 1,360 (+8%) | 1mo | $138,500 | $102 | 72 |
| 202 W Ponca Ave | 0.03mi | 3/2.0 (+1) | 1,398 (+11%) | 6mo | $247,000 | $177 | 71 |
| 703 N D Ave | 0.16mi | 3/1.5 (+1) | 1,360 (+8%) | 2mo | $168,000 | $124 | 70 |
| 311 N Division St | 0.30mi | 3/1.5 (+1) | 1,298 (+3%) | 8mo | $178,000 | $137 | 67 |
| 601 W Wichita Ave W | 0.45mi | 3/1.0 (+1) | 1,227 (-3%) | 6mo | $48,000 | $39 | 60 |
| 321 N Gilbert Ave | 0.59mi | 3/1.5 (+1) | 1,238 (-2%) | 3mo | $170,000 | $137 | 60 |
| 912 N C Ave | 0.22mi | 3/1.5 (+1) | 1,096 (-13%) | 3mo | $180,000 | $164 | 58 |
| 700 Cedar Ct | 0.27mi | 3/1.5 (+1) | 1,104 (-12%) | 6mo | $129,900 | $118 | 54 |
| 201 N Dunlap St | 0.51mi | 2/1.0 | 1,158 (-8%) | 10mo | $150,000 | $130 | 50 |
| 1004 W Pawnee St | 0.71mi | 3/2.0 (+1) | 1,368 (+8%) | 3mo | $165,000 | $121 | 45 |
| 200 S Division St | 0.60mi | 2/1.0 | 1,380 (+9%) | 12mo | $129,900 | $94 | 43 |
| 403 N Vine Ave | 0.45mi | 3/1.0 (+1) | 1,092 (-14%) | 10mo | $170,000 | $156 | 39 |
Match score weights: distance 35% · size 25% · config 20% · recency 20%. Top-matched comps best support the ARV.
Projected returns pro-forma
10.0% appreciation · 3.0% rent growth · sell at horizon
- IRR
- 27.9%
- Equity multiple
- 3.21×
- Total profit
- $104,135
- Equity at exit
- $151,348
- IRR
- 24.4%
- Equity multiple
- 7.30×
- Total profit
- $296,526
- Equity at exit
- $326,387
Cash invested: $47,040 (down + closing). Projections, not guarantees.
Landlord ↔ Tenant lean methodology
- Overall (STATE)
- 83 Strongly Landlord-Friendly
- State Oklahoma
- 83 Strongly Landlord-Friendly · R+20
- County
- — inherits STATE
- City
- — inherits STATE
ZIP-level market 74020
- Home prices YoY
- 6.9%
- Active inventory
- 86
- Price-to-rent
- 9.2×
Monthly cashflow live
- Estimated rent
- $1,529 medium interval (Pro) →
- Mortgage (P&I)
- −$881
- Tax from tax record
- −$58 /mo · $692/yr
- Insurance
- −$70
- HOA
- −$0
- Vacancy / Maint / Mgmt
- −$321
- Net cashflow
- $200
Break-even live
UW: 25.0% down · 7.5% · 30yr · 1.5% tax · 5.0% vac · 8.0% maint · 8.0% mgmt
Financing live
Cash to close
- Down payment
- $42,000
- Closing costs
- $5,040
- Reserves months
- —
- Total cash needed
- —
Loan-product check · same deal, 3 products live
Conventional
25% down · 7.5% · 30yr
- Down + closing
- —
- Monthly P&I
- —
- Monthly cashflow
- —
- DSCR
- —
- Eligible?
- —
Personal DTI + credit; lowest rate.
DSCR
20% down · 8.5% · 30yr
- Down + closing
- —
- Monthly P&I
- —
- Monthly cashflow
- —
- DSCR
- —
- Eligible?
- —
No personal income docs; deal must DSCR.
Hard money
10% down · 12.0% · 12mo
- Down + closing
- —
- Monthly P&I
- —
- Monthly cashflow
- —
- DSCR
- —
- Eligible?
- —
Short-term bridge; refi at stabilization.
Listing history 14 events
-
2026-06-16statusdays on market $168,000 Pending 92 DOM
-
2026-06-15days on market $168,000 Active 91 DOM
-
2026-06-13days on market $168,000 Active 89 DOM
-
2026-06-10days on market $168,000 Active 86 DOM
-
2026-06-09days on market $168,000 Active 85 DOM
-
2026-06-08days on market $168,000 Active 84 DOM
-
2026-06-07days on market $168,000 Active 83 DOM
-
2026-06-03days on market $168,000 Active 79 DOM
-
2026-06-02days on market $168,000 Active 78 DOM
-
2026-06-01days on market $168,000 Active 77 DOM
-
2026-05-31days on market $168,000 Active 76 DOM
-
2026-04-06price $168,000
-
2026-03-16$189,000 Active
-
2021-09-28soldstatus $51,500
ⓘ Source: listings_history table (triggers on properties + properties_extension) + one-shot
backfill from property_details.listing_events for pre-trigger history.
Tax reassessment forecast OK · Resets to sale price
- Current annual tax
- $692 · $58/mo
- Projected year-2 tax
- $1,512 · $126/mo
- Expected delta
- +$820/yr (+$68/mo · 118.5%)
ⓘ Screening estimate from a state-policy table — verify with the county assessor before closing.
Climate risk First Street
- Flood 1/10 Low 0% chance over 30 yrs
- Wildfire 6/10 Major
- Heat 6/10 Major 7 d/yr ≥110°F today · 19 d/yr by 30 yrs out
- Wind 2/10 Low 4% chance of damaging wind over 30 yrs
- Air quality 2/10 Low 0 unhealthy d/yr today · 1 by 30 yrs out
Nearby sold comps map
Loading sold comps map…
Walkable amenities ~0.75 mi
Loading nearby amenities…
Taxation est. · year 1
- Rental income
- $18,352
- − Mortgage interest
- −$9,411
- − Property taxes
- −$692
- − Insurance
- −$840
- − Repairs & maintenance
- −$1,468
- − Management
- −$1,468
- − Depreciation
- −$4,887
- Taxable loss
- −$414
- Est. tax savings @ 24.0%
- +$99
- After-tax cash flow
- $2,494/yr
For passive investors: Depreciation is non-cash, so a rental often shows a tax loss while cash-flowing — sheltering income. Rental losses are passive: they offset passive income freely, and up to $25,000/yr can offset ordinary (W-2) income if you actively participate and your MAGI is under $100k (phasing out to $0 by $150k); unused losses carry forward. On sale, claimed depreciation is recaptured at up to 25%, and gains may owe capital-gains tax (a 1031 exchange can defer both). Figures are a year-1 estimate at your 24.0% rate — not tax advice; consult a CPA.
Schools (NCES district)
- District
- Cleveland
- NCES district ID
- 4008040
- Math proficiency
- 21% ▼ -6.00%
- Reading proficiency
- 19% ▼ -11.00%
- Median HH income
- $45,642
- Composite
- 17.52/100
- National rank
- #9049
- State rank
- #169 of 270 in OK
Livability — Cleveland
- Score
- 67/100
- State rank
- #93
- US rank
- #10844
Category grades
Schools grade is shown separately in the Schools card above.
Census & demographics
- Census place
- Cleveland, OK
- Population (ZIP)
- 7,365
Population outlook (Pawnee County) Hauer SSP2
- Today (2025)
- 16,219 people
- By 2030
- 16,028 · -1.2%
- By 2040
- 15,724 · -3.1%
- By 2050
- 15,563 · -4.0%
- By 2075
- 15,905 · -1.9%
- By 2100
- 16,058 · -1.0%
Race, ethnicity, and origin ACS 2023
- Neighborhood character
- Predominantly White (77%)
- Race & ethnicity
- White 77% Two or more races 12% Native American 6% Hispanic / Latino 4% Black 1%
- Common ancestry
- Slovak 2% Lithuanian 2% Iranian 1%
- Foreign-born
- 1% · Canada
- Languages at home
- 96% English-only · Spanish 2% Other Asian/Pacific 1%
Political lean MEDSL · Pawnee
- 2024 margin
- Solid R (+58.9) · D 19.7% · R 78.6% · Other 1.7%
- 2008→2024 swing
- -21.4pp toward R · 2008: -37.4pp · 2024: -58.9pp
- All cycles
- 2024: R+58.9 2020: R+57.5 2016: R+53.2 2012: R+40.0 2008: R+37.4
Not yet ingested
- Civics
- —
Market trends
- HPI YoY
- ▲ 14.01%
- Current HPI
- 218.04
- Rent YoY
- —
- Metro
- —
- State GDP YoY
- ▲ 1.55%
- F500 in state
- 6
Industry mix (Fortune 500 HQ in OK)
| Industry | F500 HQs | Revenue |
|---|---|---|
| Energy | 3 | $48B |
|
||
Price history
+226.2% since first listed3 events — show timeline
- 2026-04-06 Price Changed $168,000 MLS Technology, Inc.
- 2026-03-16 Listed $189,000 MLS Technology, Inc.
- 2021-09-28 Sold (Public Records) $51,500 Public Records
Property tax history
+0.7%/yrLatest (2025): $692 · +7.6% YoY. Source: county tax records.
Cash-flow waterfall
monthlySold comps — $/sqft
last 12 mo · ≤1 miLoading sold comps…