 Multi-family
933 S Gramercy Pl · Los Angeles, CA
Flood risk 1/10 · Minimal
- FEMA flood zone
- X (unshaded)
- Chance of flooding over 30 yrs
- 0.0%
- Est. flood insurance / yr
- $507 – $1,088
Fire risk 1/10 · Minimal
- Est. fire insurance / yr
- $659 – $1,223
Heat risk 6/10 · Moderate
- Hot days now (above 89°F)
- 7 days/yr
- Hot days in 30 yrs
- 21 days/yr
Wind risk 1/10 · Minimal
- Chance of severe wind over 30 yrs
- —
Air-quality risk 5/10 · Moderate
- Unhealthy air days now
- 8 days/yr
- Unhealthy air days in 30 yrs
- 8 days/yr
Risk factors via First Street. Map © Google.
Why this score? — see what drove the B- grade
The composite is a weighted blend of 9 inputs, each scored 0–100. Each bar is that input's sub-score; the figure is the points it added to the 100-point composite (weight × sub-score).
- Cash flow +30.0/30.0
- 1% rule +10.0/10.0
- DSCR +10.0/10.0
- ARV discount +7.5/15.0
- Schools +3.6/10.0
- Livability +3.4/5.0
- Condition / age +2.5/5.0
- Rent growth +2.4/5.0
- Appreciation +0.0/10.0
$1,199,000
🖨 Deal sheet (PDF) 📄 Offer letter ✓ Due diligence
Multi-family units
County records classify this as Multi-Family (2-4 Unit). Listing-text estimate: 1 unit. estimate disagrees with records
Listing remarks MLS
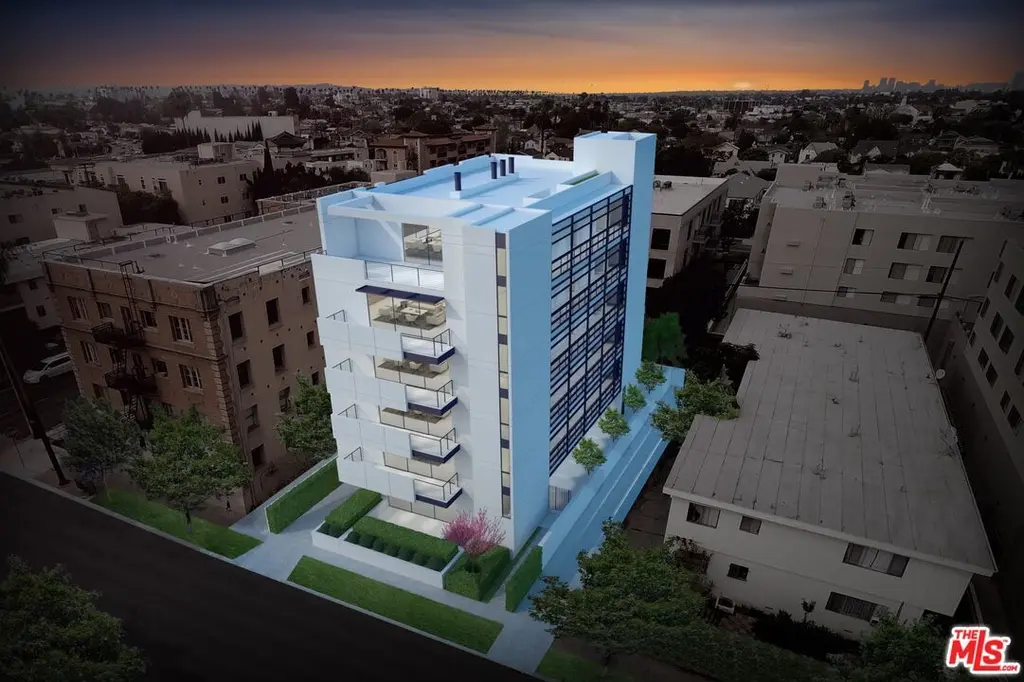
933 South Gramercy Place offers a prime ground-up multifamily development opportunity in Los Angeles' thriving Mid-City/Koreatown corridor. This vacant parcel is zoned LAR3 on a 7,506 square foot lot and benefits from TOC Tier 3 incentives, allowing for a density bonus above the base zoning while reducing parking and setback requirements. Previously approved plans for CONSTRUCTION OF NEW 17-UNIT, 6-STORY 67-FEET IN HEIGHT, 16,373 SF APARTMENT BUILDING. The proposed program capitalizes on transit-oriented incentives, minimizing hard costs tied to subterranean parking and aligning with the city's sustainable urban growth objectives. 933 South Gramercy Place is a strategically positioned, clean land play with a clear entitlement path, strong rental demand drivers, and conceptual plans available for investor review. This is a compelling opportunity for developers and investors seeking to place capital in one of Los Angeles' strongest rental growth markets, with the framework in place to deliver a high-performing multifamily asset and generate substantial long-term returns. BRING ALL OFFERS!
Key facts
- Zoned lar3
- Density bonus
- Clean land play
Tags
Neighborhood map
What this means for you Summary
Snapshot
- This is a 1-bed/1.0-bath multifamily listed at $1.20M.
Deal economics
- At list price, monthly cash flow is $18k ($210k/yr) — positive.
- The deal already cash-flows at list — no discount required.
- Meets the 1% rule at list price ($33k rent vs $1.20M).
- Recommended offer: $1.06M (12.0% below list) — sets the bar for market timing.
- Cap rate 23.8% vs local median 2.1% in Los Angeles — top-decile yield for the area; either an underpriced asset or a hidden risk that comps aren't pricing in. Stress-test before assuming the spread holds.
Location & tenants
- Location reads 68/100 on livability (#273 in CA) — a middle-class / working-renter tenant base. Strengths: amenities A+, commute A+, employment B; Watch: health & safety C-, schools D+, crime F.
- Los Angeles Unified (urban): math 29% / reading 54% proficiency, ranked #223 of 517 in CA (top 43%) — families likely to look elsewhere, expect single-tenant / working-renter base with shorter leases; 67% free/reduced lunch — lower-income household profile, screen leases tightly.
- Market conditions: Rents soft (-0.5%/yr); 206 active listings in the ZIP; 40 comparable units currently listed for rent nearby; rentals at typical pace (median 26d on market — plan ~3-4 weeks tenant-placement turnaround); 40% of comp listings sitting > 30 days — soft ceiling on asking rent; 19,697 units permitted in Los Angeles County in 2024 (9,426 in 5+ unit buildings).
- At $32,819/mo this rent would consume 533% of the median local household income ($74k/yr) (locally 5272% of renters already pay >50% of income on rent) — very limited rent-growth headroom before tenants either downsize or default.
Forward outlook
- Local home prices are declining (-3.0%/yr); year-one equity from $8k of loan paydown is wiped out by about $36k of value loss. Plan a longer hold.
- Los Angeles County population projected at +9% by 2050 — modest demand growth; plan on rents tracking national, not racing it.
- At projected returns (-3.0% appreciation + 0.0% rent growth), your $336k cash investment doubles in ~2 years — after that, you're playing with house money.
Negotiation context
- It's been on market 276 days — a 12% lower offer ($1.06M) is reasonable based on typical stale-listing flexibility.
- 10 sale attempts since 11y ago; this cycle's ask has dropped $196k (14%) from the opening price — seller is motivated, your offer sets the floor, not the list.
Risks & watch-outs
- Watch-outs: built in 1910 — expect roof / HVAC / electrical / plumbing capex.
- Climate carrying-cost: extreme-heat days projected 7→21/yr by 2055 (HVAC capex compounding) — expect insurance premiums to compound above CPI over the hold.
Questions for the listing agent
- It's been on market 276 days. Have you received any prior offers? Is the seller open to a 12% concession, seller financing, or rate buy-down credit?
- Built in 1910 — when were the roof, HVAC, electrical panel, plumbing, and water heater last replaced?
- Why hasn't it sold? Are there any deal-killer items the seller is aware of (foundation, flood, title, zoning, code violations)?
- Is there a deadline driving the sale (1031 exchange, divorce, estate, relocation)? That informs how much negotiation room exists.
- Schools are D-rated, which usually means shorter tenancies and higher turnover. Who's the typical renter profile here, and what's been the actual vacancy rate?
- Crime grade is F in this area — have there been break-ins, vandalism, or insurance claims at this property in the last 3 years? What carrier currently insures it and at what premium?
- What's the average days-on-market for RENTAL listings here right now (not sales)? A rising rental-DOM trend means longer vacancies and softer asking-rent achievability than the comps imply.
- What's the recent tenant-quality profile in this submarket — average credit score on applications, eviction rate, late-payment / NSF rate, and stable-employment percentage? A property-management company in the area should have these aggregated.
- How much new apartment / multifamily construction is in the pipeline within 1–3 miles? Heavy new supply (>2% of stock underway) typically softens rents 12–24 months out; light construction supports rent growth.
Investment metrics
- 1% rule
- 2.74% ✓
- Cap rate
- 23.84%
- Cash-on-cash
- 62.66%
- DSCR
- 3.79
- GRM
- 3.0
CMA / ARV
- ARV (median comp)
- $9,799,347,950
- List price
- $1,199,000
- Delta
- -99.99%
- Verdict
- UNDERPRICED
- Comps
- 2 within 2.0 mi
Projected returns pro-forma
-3.0% appreciation · 0.0% rent growth · sell at horizon
- IRR
- 58.2%
- Equity multiple
- 3.46×
- Total profit
- $826,524
- Equity at exit
- $178,775
- IRR
- 61.9%
- Equity multiple
- 6.33×
- Total profit
- $1,787,898
- Equity at exit
- $103,668
Cash invested: $335,720 (down + closing). Projections, not guarantees.
Landlord ↔ Tenant lean methodology
- Overall (CITY)
- 0 Strongly Tenant-Friendly
- State California
- 18 Strongly Tenant-Friendly · D+13
- County
- — inherits STATE
- City Los Angeles
- 0 Strongly Tenant-Friendly · D+22
ZIP-level market 90019
- Rents YoY
- -0.5%
- Active inventory
- 206
- Price-to-rent
- 51.8×
Monthly cashflow live
- Estimated rent
- $32,819 high interval (Pro) →
- Mortgage (P&I)
- −$6,288
- Tax from tax record
- −$1,611 /mo · $19,329/yr
- Insurance
- −$500
- HOA
- −$0
- Vacancy / Maint / Mgmt
- −$6,892
- Net cashflow
- $17,529
Break-even live
Sensitivity live
| Price | -10% $18,208 | -5% $17,868 | +0% $17,529 | +5% $17,190 | +10% $16,850 |
|---|---|---|---|---|---|
| Rent | -10% $14,936 | -5% $16,233 | +0% $17,529 | +5% $18,825 | +10% $20,122 |
| Rate | -1.0pp $18,133 | -0.5pp $17,834 | base $17,529 | +0.5pp $17,218 | +1.0pp $16,902 |
17-unit breakdown (identical units grouped — click to expand)
| Units | Beds | Baths | Est. rent |
|---|---|---|---|
| 17× units | 1 | 1 | $32,827 |
| #1 | 1 | 1 | $1,931 |
| #2 | 1 | 1 | $1,931 |
| #3 | 1 | 1 | $1,931 |
| #4 | 1 | 1 | $1,931 |
| #5 | 1 | 1 | $1,931 |
| #6 | 1 | 1 | $1,931 |
| #7 | 1 | 1 | $1,931 |
| #8 | 1 | 1 | $1,931 |
| #9 | 1 | 1 | $1,931 |
| #10 | 1 | 1 | $1,931 |
| #11 | 1 | 1 | $1,931 |
| #12 | 1 | 1 | $1,931 |
| #13 | 1 | 1 | $1,931 |
| #14 | 1 | 1 | $1,931 |
| #15 | 1 | 1 | $1,931 |
| #16 | 1 | 1 | $1,931 |
| #17 | 1 | 1 | $1,931 |
| Total (17 units) | $32,819 | ||
UW: 25.0% down · 7.5% · 30yr · 1.5% tax · 5.0% vac · 8.0% maint · 8.0% mgmt
Financing live
Cash to close
- Down payment
- $299,750
- Closing costs
- $35,970
- Reserves months
- —
- Total cash needed
- —
Loan-product check · same deal, 3 products live
Conventional
25% down · 7.5% · 30yr
- Down + closing
- —
- Monthly P&I
- —
- Monthly cashflow
- —
- DSCR
- —
- Eligible?
- —
Personal DTI + credit; lowest rate.
DSCR
20% down · 8.5% · 30yr
- Down + closing
- —
- Monthly P&I
- —
- Monthly cashflow
- —
- DSCR
- —
- Eligible?
- —
No personal income docs; deal must DSCR.
Hard money
10% down · 12.0% · 12mo
- Down + closing
- —
- Monthly P&I
- —
- Monthly cashflow
- —
- DSCR
- —
- Eligible?
- —
Short-term bridge; refi at stabilization.
Rent comps 40 comps
| Address | Beds | Baths | Sqft | Rent | $/sqft | DOM | Units | Dist |
|---|---|---|---|---|---|---|---|---|
| 914 S Wilton Pl Los Angeles, CA | 1.0 | 1.0 | 434 | $1,637 | $3.77 | 3d | 8 | 0.01mi |
| 939 S Gramercy Pl Los Angeles, CA | — | 1.0 | 170 | $1,025 | $6.03 | 3d | 1 | 0.03mi |
| 951 S Wilton Pl Unit 302 Los Angeles, CA | 2.0 | 2.0 | 1045 | $3,150 | $3.01 | 18d | 1 | 0.06mi |
| 951 S Wilton Pl Unit 201 Los Angeles, CA | 2.0 | 2.0 | 890 | $2,600 | $2.92 | 4d | 1 | 0.06mi |
| 3787 1/2 W 9th St Unit 3787 Los Angeles, CA | 1.0 | 1.0 | 625 | $1,875 | $3.00 | 18d | 1 | 0.07mi |
| 959 S Gramercy Pl Los Angeles, CA | 2.0 | 1.0–2.0 | 650 | $2,012 | $3.10 | 25d | 2 | 0.07mi |
| 3748 W 9th St Los Angeles, CA | 1.0 | 1.0 | 790 | $1,945 | $2.46 | 25d | 1 | 0.08mi |
| 901 S Gramercy Dr #204 Los Angeles, CA | 2.0 | 2.0 | 1197 | $3,200 | $2.67 | 45d | 1 | 0.10mi |
| 870 S Gramercy Pl Unit 3 Los Angeles, CA | — | 1.0 | 650 | $1,450 | $2.23 | 45d | 1 | 0.10mi |
| 930 S Gramercy Dr Los Angeles, CA | 1.0–2.0 | 1.0–2.0 | 896 | $2,850 | $3.18 | 25d | 2 | 0.11mi |
| 856 S Gramercy Pl Los Angeles, CA | 2.0 | 2.0 | 1700 | $3,199 | $1.88 | 0d | 1 | 0.11mi |
| 856 S Gramercy Pl Los Angeles, CA | 2.0 | 2.0 | 1700 | $3,495 | $2.06 | 45d | 1 | 0.11mi |
| 957 S Gramercy Dr #105 Los Angeles, CA | 2.0 | 2.0 | 750 | $3,000 | $4.00 | 45d | 1 | 0.12mi |
| 974 S Gramercy Pl Los Angeles, CA | — | 1.0 | 450 | $1,422 | $3.16 | 11d | 2 | 0.13mi |
| 838 S Wilton Pl Unit 844-1 Los Angeles, CA | 1.0 | 1.0 | — | $1,695 | — | 9d | 1 | 0.13mi |
| 831 S Gramercy Pl Los Angeles, CA | 1.0 | 1.0 | 750 | $1,525 | $2.03 | 45d | 1 | 0.14mi |
| 832 S Gramercy Pl Unit 9 Los Angeles, CA | 2.0 | 2.0 | 850 | $2,050 | $2.41 | 25d | 1 | 0.15mi |
| 827 S Wilton Pl Unit 307 Los Angeles, CA | 1.0 | 1.0 | 500 | $1,750 | $3.50 | 45d | 1 | 0.15mi |
| 856 Gramercy Dr Los Angeles, CA | 1.0–4.0 | 1.0–2.0 | 1078 | $2,595 | $2.41 | 0d | 6 | 0.15mi |
| 821 S Wilton Pl Los Angeles, CA | — | 1.0 | 450 | $1,615 | $3.59 | 45d | 1 | 0.17mi |
| 827 Gramercy Dr Los Angeles, CA | 1.0 | 1.0 | — | $1,895 | — | 2d | 1 | 0.18mi |
| 827 Gramercy Dr Los Angeles, CA | 1.0 | 1.0 | — | $1,900 | — | 45d | 1 | 0.18mi |
| 934 S St Andrews Pl Los Angeles, CA | 1.0 | 1.0 | 699 | $2,400 | $3.43 | 45d | 1 | 0.18mi |
| 821 S Gramercy Dr Apt 103 Los Angeles, CA | 2.0 | 1.0 | 815 | $2,395 | $2.94 | 19d | 1 | 0.18mi |
| 820 S Gramercy Pl Los Angeles, CA | 1.0 | 1.0 | — | $1,661 | — | 45d | 1 | 0.19mi |
| 820 S Gramercy Pl Los Angeles, CA | 1.0 | 1.0 | — | $1,795 | — | 3d | 1 | 0.19mi |
| 3418 W Olympic Blvd Los Angeles, CA | — | 1.0 | 450 | $1,125 | $2.50 | 45d | 1 | 0.19mi |
| 845 S St Andrews Pl Los Angeles, CA | 1.0 | 1.0 | 750 | $3,000 | $4.00 | 45d | 5 | 0.19mi |
| 933 S Manhattan Pl Los Angeles, CA | 1.0 | 1.0 | 850 | $2,100 | $2.47 | 25d | 1 | 0.20mi |
| 850 S St Andrews Pl Los Angeles, CA | 1.0 | 1.0 | — | $1,895 | — | 3d | 1 | 0.21mi |
| 3556 San Marino St Apt 17 Los Angeles, CA | 1.0 | 1.0 | — | $1,795 | — | 25d | 1 | 0.21mi |
| 817 S St Andrews Pl Los Angeles, CA | 1.0 | 1.0 | — | $1,750 | — | 45d | 2 | 0.23mi |
| 3945 W 8th St Unit 2 Los Angeles, CA | 1.0 | 1.0 | — | $2,200 | — | 45d | 1 | 0.24mi |
| 845 S Manhattan Pl Los Angeles, CA | — | 1.0 | — | $1,675 | — | 22d | 1 | 0.24mi |
| 820 S Saint Andrews Pl Unit 303 Los Angeles, CA | 1.0 | 1.0 | 670 | $1,800 | $2.69 | 21d | 1 | 0.24mi |
| 820 S Saint Andrews Pl Unit 301 Los Angeles, CA | 2.0 | 2.0 | 900 | $2,450 | $2.72 | 25d | 1 | 0.24mi |
| 827 S Manhattan Pl Los Angeles, CA | — | 1.0 | 335 | $1,700 | $5.07 | 45d | 1 | 0.25mi |
| 734 S Gramercy Pl Los Angeles, CA | 2.0 | 1.5 | 1118 | $3,200 | $2.86 | 25d | 1 | 0.26mi |
| 734 S Gramercy Pl Los Angeles, CA | 2.0 | 2.0 | 1118 | $3,200 | $2.86 | 45d | 1 | 0.26mi |
| 988 S Manhattan Pl Los Angeles, CA | 2.0 | 2.0–3.0 | 1049 | $3,396 | $3.24 | 4d | 12 | 0.27mi |
Listing history 39 events
-
2026-06-21days on market $1,199,000 Active 276 DOM
-
2026-06-18days on market $1,199,000 Active 273 DOM
-
2026-06-17days on market $1,199,000 Active 272 DOM
-
2026-06-16days on market $1,199,000 Active 271 DOM
-
2026-06-15days on market $1,199,000 Active 270 DOM
-
2026-06-13days on market $1,199,000 Active 268 DOM
-
2026-06-09days on market $1,199,000 Active 264 DOM
-
2026-06-08days on market $1,199,000 Active 263 DOM
-
2026-06-07days on market $1,199,000 Active 262 DOM
-
2026-06-04days on market $1,199,000 Active 259 DOM
-
2026-06-03days on market $1,199,000 Active 258 DOM
-
2026-06-02days on market $1,199,000 Active 257 DOM
-
2026-06-01days on market $1,199,000 Active 256 DOM
-
2026-05-31days on market $1,199,000 Active 255 DOM
-
2026-03-16status Active 1103-char remark
Show marketing remark (1103 chars)
933 South Gramercy Place offers a prime ground-up multifamily development opportunity in Los Angeles' thriving Mid-City/Koreatown corridor. This vacant parcel is zoned LAR3 on a 7,506 square foot lot and benefits from TOC Tier 3 incentives, allowing for a density bonus above the base zoning while reducing parking and setback requirements. Previously approved plans for CONSTRUCTION OF NEW 17-UNIT, 6-STORY 67-FEET IN HEIGHT, 16,373 SF APARTMENT BUILDING. The proposed program capitalizes on transit-oriented incentives, minimizing hard costs tied to subterranean parking and aligning with the city's sustainable urban growth objectives. 933 South Gramercy Place is a strategically positioned, clean land play with a clear entitlement path, strong rental demand drivers, and conceptual plans available for investor review. This is a compelling opportunity for developers and investors seeking to place capital in one of Los Angeles' strongest rental growth markets, with the framework in place to deliver a high-performing multifamily asset and generate substantial long-term returns. BRING ALL OFFERS!
-
2025-11-04price $1,295,000 1103-char remark
Show marketing remark (1103 chars)
933 South Gramercy Place offers a prime ground-up multifamily development opportunity in Los Angeles' thriving Mid-City/Koreatown corridor. This vacant parcel is zoned LAR3 on a 7,506 square foot lot and benefits from TOC Tier 3 incentives, allowing for a density bonus above the base zoning while reducing parking and setback requirements. Previously approved plans for CONSTRUCTION OF NEW 17-UNIT, 6-STORY 67-FEET IN HEIGHT, 16,373 SF APARTMENT BUILDING. The proposed program capitalizes on transit-oriented incentives, minimizing hard costs tied to subterranean parking and aligning with the city's sustainable urban growth objectives. 933 South Gramercy Place is a strategically positioned, clean land play with a clear entitlement path, strong rental demand drivers, and conceptual plans available for investor review. This is a compelling opportunity for developers and investors seeking to place capital in one of Los Angeles' strongest rental growth markets, with the framework in place to deliver a high-performing multifamily asset and generate substantial long-term returns. BRING ALL OFFERS!
-
2025-09-08$1,395,000 Active 1103-char remark
Show marketing remark (1103 chars)
933 South Gramercy Place offers a prime ground-up multifamily development opportunity in Los Angeles' thriving Mid-City/Koreatown corridor. This vacant parcel is zoned LAR3 on a 7,506 square foot lot and benefits from TOC Tier 3 incentives, allowing for a density bonus above the base zoning while reducing parking and setback requirements. Previously approved plans for CONSTRUCTION OF NEW 17-UNIT, 6-STORY 67-FEET IN HEIGHT, 16,373 SF APARTMENT BUILDING. The proposed program capitalizes on transit-oriented incentives, minimizing hard costs tied to subterranean parking and aligning with the city's sustainable urban growth objectives. 933 South Gramercy Place is a strategically positioned, clean land play with a clear entitlement path, strong rental demand drivers, and conceptual plans available for investor review. This is a compelling opportunity for developers and investors seeking to place capital in one of Los Angeles' strongest rental growth markets, with the framework in place to deliver a high-performing multifamily asset and generate substantial long-term returns. BRING ALL OFFERS!
-
2024-03-15status Active
-
2024-01-08Active
-
2023-10-30price
-
2023-09-28Active
-
2017-11-29soldstatus $1,390,000 Closed
-
2017-11-29soldstatus $1,390,000
-
2017-11-29soldstatus $1,390,000
-
2017-10-11status Backup Offers Accepted
-
2017-09-08price $1,500,000
-
2017-07-28price $1,699,000
-
2017-07-07$1,899,000 Active
-
2017-07-07$1,500,000
-
2017-02-28historical Expired
-
2017-02-28historical
-
2016-09-13price
-
2016-08-30price
-
2016-04-06price
-
2016-01-20price
-
2015-11-06Active
-
2015-11-03$1,599,000
-
2015-09-11historical
-
2015-02-11$1,899,000 Active
ⓘ Source: listings_history table (triggers on properties + properties_extension) + one-shot
backfill from property_details.listing_events for pre-trigger history.
Tax reassessment forecast CA · Resets to sale price
- Current annual tax
- $19,329 · $1,611/mo
- Projected year-2 tax
- $19,329 · $1,611/mo
- Expected delta
- $0/yr ($0/mo · 0.0%)
ⓘ Screening estimate from a state-policy table — verify with the county assessor before closing.
Climate risk First Street
- Flood 1/10 Low FEMA zone X (unshaded) · 0% chance over 30 yrs
- Wildfire 1/10 Low
- Heat 6/10 Major 7 d/yr ≥89°F today · 21 d/yr by 30 yrs out
- Wind 1/10 Low
- Air quality 5/10 Major 8 unhealthy d/yr today · 8 by 30 yrs out
Nearby sold comps map
Loading sold comps map…
Walkable amenities ~0.75 mi
Loading nearby amenities…
Taxation est. · year 1
- Rental income
- $393,828
- − Mortgage interest
- −$67,163
- − Property taxes
- −$19,329
- − Insurance
- −$5,995
- − Repairs & maintenance
- −$31,506
- − Management
- −$31,506
- − Depreciation
- −$34,880
- Taxable income
- $203,449
- Est. tax owed @ 24.0%
- −$48,828
- After-tax cash flow
- $161,520/yr
For passive investors: Depreciation is non-cash, so a rental often shows a tax loss while cash-flowing — sheltering income. Rental losses are passive: they offset passive income freely, and up to $25,000/yr can offset ordinary (W-2) income if you actively participate and your MAGI is under $100k (phasing out to $0 by $150k); unused losses carry forward. On sale, claimed depreciation is recaptured at up to 25%, and gains may owe capital-gains tax (a 1031 exchange can defer both). Figures are a year-1 estimate at your 24.0% rate — not tax advice; consult a CPA.
Schools (NCES district)
- District
- Los Angeles Unified
- NCES district ID
- 0622710
- Math proficiency
- 29% ▼ -4.00%
- Reading proficiency
- 54% ▲ 10.00%
- Median HH income
- $50,403
- Composite
- 35.67/100
- National rank
- #4875
- State rank
- #223 of 517 in CA
Livability — Los Angeles
- Score
- 68/100
- State rank
- #273
- US rank
- #9237
Category grades
Schools grade is shown separately in the Schools card above.
Census & demographics
- Census place
- Los Angeles, CA
- County
- Los Angeles County · 9,444,647 people
- City population
- 3,838,149
- Metro
- Los Angeles-Long Beach-Anaheim, CA
- Population (ZIP)
- 59,548
- Household income
- $73,934
- Rent vs Own
- Severe rent burden
- 5272.0
Population outlook (Los Angeles County) Hauer SSP2
- Today (2025)
- 10,940,515 people
- By 2030
- 11,256,481 · +2.9%
- By 2040
- 11,729,929 · +7.2%
- By 2050
- 11,948,407 · +9.2%
- By 2075
- 11,818,114 · +8.0%
- By 2100
- 10,842,928 · -0.9%
Race, ethnicity, and origin ACS 2023
- Neighborhood character
- Highly diverse neighborhood (Simpson 0.73)
- Race & ethnicity
- Hispanic / Latino 43% White 18% Black 17% Asian 17% Two or more races 13%
- Hispanic origin (detail)
- Mexican 26%
- Common ancestry
- Lithuanian 1% Romanian 1% Italian 1%
- Foreign-born
- 37% · Canada, South Korea, China
- Languages at home
- 45% English-only · Spanish 38% Korean 10% Tagalog/Filipino 1%
Political lean MEDSL · Los Angeles
- 2024 margin
- Solid D (+32.9) · D 64.8% · R 31.9% · Other 3.3%
- 2008→2024 swing
- -7.4pp toward R · 2008: 40.4pp · 2024: 32.9pp
- All cycles
- 2024: D+32.9 2020: D+44.2 2016: D+48.0 2012: D+40.0 2008: D+40.4
Not yet ingested
- Civics
- —
Market trends
- HPI YoY
- ▼ -1477.82%
- Current HPI
- 425.5427
- Rent YoY
- ▼ -0.50%
- Metro
- Los Angeles-Long Beach-Anaheim, CA
- State GDP YoY
- ▲ 3.21%
- F500 in state
- 116
Industry mix (Fortune 500 HQ in CA)
| Industry | F500 HQs | Revenue |
|---|---|---|
| Technology | 27 | $1,492B |
|
||
| Financial Services | 3 | $174B |
|
||
| Retail | 3 | $44B |
|
||
| Insurance | 3 | $26B |
|
||
| Media / Entertainment | 2 | $115B |
|
||
| Pharmaceuticals / Biotech | 2 | $62B |
|
||
Price history
-31.8% since first listed25 events — show timeline
- 2026-03-16 Relisted — TheMLS
- 2025-11-04 Price Changed $1,295,000 TheMLS
- 2025-09-08 Listed $1,395,000 TheMLS
- 2024-03-15 Relisted — TheMLS
- 2024-01-08 Listed — TheMLS
- 2023-10-30 Price Changed — TheMLS
- 2023-09-28 Listed — TheMLS
- 2017-11-29 Sold (Public Records) $1,390,000 Public Records
- 2017-11-29 Sold (MLS) $1,390,000 SDMLS
- 2017-11-29 Sold (MLS) $1,390,000 TheMLS
- 2017-10-11 Pending — TheMLS
- 2017-09-08 Price Changed $1,500,000 TheMLS
- 2017-07-28 Price Changed $1,699,000 TheMLS
- 2017-07-07 Listed $1,899,000 TheMLS
- 2017-07-07 Listed $1,500,000 SDMLS
- 2017-02-28 Listing Removed — SDMLS
- 2017-02-28 Delisted — TheMLS
- 2016-09-13 Price Changed — TheMLS
- 2016-08-30 Price Changed — TheMLS
- 2016-04-06 Price Changed — TheMLS
- 2016-01-20 Price Changed — TheMLS
- 2015-11-06 Listed — TheMLS
- 2015-11-03 Listed $1,599,000 SDMLS
- 2015-09-11 Listing Removed — CRMLS
- 2015-02-11 Listed $1,899,000 CRMLS
Property tax history
+20.4%/yrLatest (2025): $19,329 · +1.2% YoY. Source: county tax records.
Cash-flow waterfall
monthlySold comps — $/sqft
last 12 mo · ≤1 miLoading sold comps…