5201 NE 14th Ter #3 · Fort Lauderdale, FL
Flood risk 3/10 · Minor
- FEMA flood zone
- X (shaded)
- Chance of flooding over 30 yrs
- 0.13%
- Est. flood insurance / yr
- $507 – $1,088
Fire risk 1/10 · Minimal
- Est. fire insurance / yr
- $947 – $1,759
Heat risk 10/10 · Severe
- Hot days now (above 105°F)
- 7 days/yr
- Hot days in 30 yrs
- 27 days/yr
Wind risk 10/10 · Severe
- Chance of severe wind over 30 yrs
- 99.0%
Air-quality risk 2/10 · Minimal
- Unhealthy air days now
- 1 days/yr
- Unhealthy air days in 30 yrs
- 2 days/yr
Risk factors via First Street. Map © Google.
Why this score? — see what drove the C grade
The composite is a weighted blend of 9 inputs, each scored 0–100. Each bar is that input's sub-score; the figure is the points it added to the 100-point composite (weight × sub-score).
- Cash flow +18.5/30.0
- 1% rule +10.0/10.0
- ARV discount +7.5/15.0
- DSCR +5.8/10.0
- Schools +4.1/10.0
- Livability +4.1/5.0
- Rent growth +3.0/5.0
- Condition / age +2.5/5.0
- Appreciation +0.0/10.0
$289,900
🖨 Deal sheet 📄 Offer letter ✓ Due diligence
Listing remarks
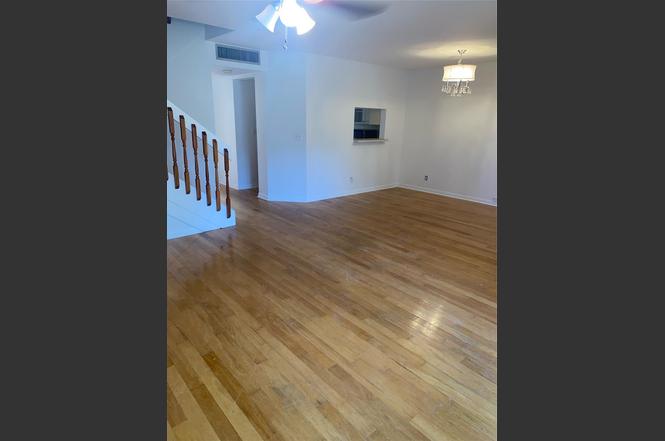
Great NE Fort Lauderdale location and can be rented right away! This 3-bedroom, 2.5-bathroom spacious townhome is freshly painted and offers ample space and the ambiance of a single-family home, in A rated Floranada Elementary school district and only 1.5 mile from the beach. The unit has wood floors on the bottom level and tiled floors upstairs. Every room is equipped with ceiling fans for comfort, and the master suite features a bonus room perfect for an office area, along with a Roman tub and a spacious walk-in closet. Screened backyard patio overlooking lush yard and landscaping. Full washer/dryer in unit. Roof approx. 5 years old, complex freshly painted with new outdoor lighting. Pets
Key facts
- Wood floors
- Tiled floors
- Ceiling fans
Tags
Property features AI
Finance
- Other: Pets allowed (size limit); Senior community
- Financial info: Not a land lease property
- HOA & community: Association with monthly fee; HOA amenities include pool and maintenance; Monthly association fee (amount provided in listing)
Exterior
- Parking: Carport (1 space); 1 covered space; 1 open parking space; Assigned parking; Guest parking
- Security: Smoke detector(s)
- Utilities: Cable available
- Home design: Townhouse; Single-story; Faces west; Resale property
- Construction: Block construction
- Exterior features: Patio; Not waterfront; First-floor entry
Interior
- Kitchen: Dishwasher; Disposal; Electric range; Refrigerator
- Bedrooms: 2 bedrooms on the main level
- Flooring: Tile; Wood
- Bathrooms: 2 full bathrooms; 1 half bathroom
- Heating & cooling: Electric heating; Central air conditioning; Ceiling fan(s)
- Interior features: Walk-in closets; Roman tub; Blinds; Sliding windows; Skylight(s)
- Laundry & utility: Electric water heater
Neighborhood map
What this means for you Summary
Snapshot
- This is a 3-bed/3.0-bath condo listed at $290k.
Deal economics
- At list price, monthly cash flow is $278 ($3k/yr) — positive.
- The deal already cash-flows at list — no discount required.
- Meets the 1% rule at list price ($4k rent vs $290k).
- Recommended offer: $264k (9.0% below list) — sets the bar for market timing.
- Cap rate 7.4% vs local median 2.2% in Fort Lauderdale — top-decile yield for the area; either an underpriced asset or a hidden risk that comps aren't pricing in. Stress-test before assuming the spread holds.
Location & tenants
- Location reads 82/100 on livability (#78 in FL, #1,293 nationally) — a professional / high-income tenant draw. Strengths: crime A+, amenities A+, health & safety A+; Watch: cost of living D-.
- Broward (suburban): math 42% / reading 53% proficiency, ranked #46 of 73 in FL (top 63%) — families likely to look elsewhere, expect single-tenant / working-renter base with shorter leases.
- Zoned schools: Floranada Elementary School (math 65% / reading 69%, grade B+, #450 of 2,144 statewide, top 22%, 748 students, 54% FRL); James S. Rickards Middle School (math 18% / reading 31%, grade F, #522 of 571 statewide, top 93%, 755 students, 75% FRL); Northeast High School (math 12% / reading 37%, grade F, #505 of 667 statewide, top 79%, 1,552 students, 69% FRL).
- Market conditions: Rents rising (+2.0%/yr); 355 active listings in the ZIP; 40 comparable units currently listed for rent nearby; rentals at typical pace (median 24d on market — plan ~3-4 weeks tenant-placement turnaround); solid renter incomes; 2,111 units permitted in Broward County in 2024 (1,265 in 5+ unit buildings).
- At $4,471/mo this rent would consume 71% of the median local household income ($75k/yr) (locally 1755% of renters already pay >50% of income on rent) — very limited rent-growth headroom before tenants either downsize or default.
Forward outlook
- Local home prices are declining (-3.0%/yr); year-one equity from $2k of loan paydown is wiped out by about $9k of value loss. Plan a longer hold.
- Broward County population projected at +34% by 2050 — long-run rental-demand tailwind backs the buy-and-hold thesis.
Negotiation context
- It's been on market 99 days — a 9% lower offer ($264k) is reasonable based on typical stale-listing flexibility.
- 4 sale attempts since 2y ago; this cycle's ask is 10072% above the opening price — seller raised mid-cycle; expect resistance to lowballs.
- Current owner paid $124k; list at $290k implies a 134% gain — meaningful room to come down on a strong offer.
Risks & watch-outs
- Watch-outs: HOA is 24% of rent.
- Climate carrying-cost: severe wind risk, 99% chance of damaging wind over 30y; extreme-heat days projected 7→27/yr by 2055 (HVAC capex compounding) — expect insurance premiums to compound above CPI over the hold.
Questions for the listing agent
- It's been on market 99 days. Have you received any prior offers? Is the seller open to a 9% concession, seller financing, or rate buy-down credit?
- What does the HOA fee cover, when was the last increase, and are there any pending special assessments or reserve-fund shortfalls?
- Any open or pending special assessments — roof, HVAC, plumbing, elevator, façade? What's the per-unit balance and payoff schedule, and is the seller paying it off at close or rolling it to the buyer?
- Why hasn't it sold? Are there any deal-killer items the seller is aware of (foundation, flood, title, zoning, code violations)?
- Is there a deadline driving the sale (1031 exchange, divorce, estate, relocation)? That informs how much negotiation room exists.
- Schools are B-rated — typically a magnet for longer-tenancy family renters. What's the average tenant stay here, and is there a school-zone premium baked into asking?
- What's the average days-on-market for RENTAL listings here right now (not sales)? A rising rental-DOM trend means longer vacancies and softer asking-rent achievability than the comps imply.
- What's the recent tenant-quality profile in this submarket — average credit score on applications, eviction rate, late-payment / NSF rate, and stable-employment percentage? A property-management company in the area should have these aggregated.
- How much new apartment / multifamily construction is in the pipeline within 1–3 miles? Heavy new supply (>2% of stock underway) typically softens rents 12–24 months out; light construction supports rent growth.
Investment metrics
- 1% rule
- 1.54% ✓
- Cap rate
- 7.44%
- Cash-on-cash
- 4.11%
- DSCR
- 1.18
- GRM
- 5.4
CMA / ARV
No comps found within radius.
Projected returns pro-forma
-3.0% appreciation · 2.01% rent growth · sell at horizon
- IRR
- -11.3%
- Equity multiple
- 0.60×
- Total profit
- $-32,829
- Equity at exit
- $43,225
- IRR
- -4.0%
- Equity multiple
- 0.75×
- Total profit
- $-20,111
- Equity at exit
- $25,065
Cash invested: $81,172 (down + closing). Projections, not guarantees.
Landlord ↔ Tenant lean methodology
- Overall (STATE)
- 87 Strongly Landlord-Friendly
- State Florida
- 87 Strongly Landlord-Friendly · R+3
- County
- — inherits STATE
- City
- — inherits STATE
ZIP-level market 33334
- Home prices YoY
- -34.6%
- Rents YoY
- 2.0%
- Active inventory
- 355
- Price-to-rent
- 5.4×
Monthly cashflow live
- Estimated rent
- $4,471 high interval (Pro) →
- Mortgage (P&I)
- −$1,520
- Tax from tax record
- −$542 /mo · $6,500/yr
- Insurance
- −$121
- HOA
- −$1,071
- Vacancy / Maint / Mgmt
- −$939
- Net cashflow
- $278
Break-even live
UW: 25.0% down · 7.5% · 30yr · 1.5% tax · 5.0% vac · 8.0% maint · 8.0% mgmt
Financing live
Cash to close
- Down payment
- $72,475
- Closing costs
- $8,697
- Reserves months
- —
- Total cash needed
- —
Loan-product check · same deal, 3 products live
Conventional
25% down · 7.5% · 30yr
- Down + closing
- —
- Monthly P&I
- —
- Monthly cashflow
- —
- DSCR
- —
- Eligible?
- —
Personal DTI + credit; lowest rate.
DSCR
20% down · 8.5% · 30yr
- Down + closing
- —
- Monthly P&I
- —
- Monthly cashflow
- —
- DSCR
- —
- Eligible?
- —
No personal income docs; deal must DSCR.
Hard money
10% down · 12.0% · 12mo
- Down + closing
- —
- Monthly P&I
- —
- Monthly cashflow
- —
- DSCR
- —
- Eligible?
- —
Short-term bridge; refi at stabilization.
Rent comps 40 comps
| Address | Beds | Baths | Sqft | Rent | $/sqft | DOM | Units | Dist |
|---|---|---|---|---|---|---|---|---|
| 5200 NE 15th Ave Fort Lauderdale, FL | 3.0 | 2.0 | 1585 | $4,600 | $2.90 | 24d | 1 | 0.11mi |
| 1424 NE 53rd Ct Fort Lauderdale, FL | 3.0 | 2.0 | 1584 | $7,500 | $4.73 | 24d | 1 | 0.16mi |
| 1740 NE 49th St Oakland Park, FL | 4.0 | 3.0 | 1832 | $5,800 | $3.17 | 24d | 1 | 0.39mi |
| 1478 NE 57th St Fort Lauderdale, FL | 3.0 | 2.0 | 1590 | $5,400 | $3.40 | 24d | 1 | 0.40mi |
| 4764 NE 15th Way Oakland Park, FL | 3.0 | 2.0 | 1218 | $3,500 | $2.87 | 24d | 1 | 0.44mi |
| 1575 NE 47th St Oakland Park, FL | 3.0 | 2.0 | 1358 | $3,700 | $2.72 | 24d | 1 | 0.48mi |
| 2120 NE 53rd St Unit 1541805P Fort Lauderdale, FL | 4.0 | 2.0 | 1603 | $9,399 | $5.86 | 21d | 1 | 0.58mi |
| 4511 NE 13th Ave Oakland Park, FL | 3.0 | 3.0 | 1416 | $4,300 | $3.04 | 3d | 1 | 0.59mi |
| 4511 NE 13th Ave Oakland Park, FL | 3.0 | 3.0 | 1416 | $4,300 | $3.04 | 24d | 1 | 0.59mi |
| 4511 NE 13th Ave Oakland Park, FL | 2.0 | 2.0 | 1400 | $3,200 | $2.29 | 7d | 1 | 0.59mi |
| 1001 NE 58th St Fort Lauderdale, FL | 3.0 | 2.5 | 1585 | $3,436 | $2.17 | 1d | 2 | 0.61mi |
| 5770 NE 18th Ave Fort Lauderdale, FL | 4.0 | 2.0 | 1459 | $7,500 | $5.14 | 13d | 1 | 0.62mi |
| 4780 NE 8th Ter Oakland Park, FL | 3.0 | 2.0 | 1130 | $4,200 | $3.72 | 24d | 1 | 0.63mi |
| 2010 NE 57th St Fort Lauderdale, FL | 3.0 | 2.0 | 1730 | $6,000 | $3.47 | 21d | 1 | 0.67mi |
| 5157 NE 5th Ave Unit 1 Fort Lauderdale, FL | 3.0 | 2.0 | 1250 | $3,500 | $2.80 | 2d | 1 | 0.76mi |
| 4360 NE 13th Ave Oakland Park, FL | 3.0 | 2.0 | 1269 | $3,700 | $2.92 | 24d | 1 | 0.76mi |
| 4360 NE 13th Ave Oakland Park, FL | 3.0 | 2.0 | 1459 | $3,700 | $2.54 | 5d | 1 | 0.76mi |
| 4360 NE 13th Ave Unit Main Oakland Park, FL | 3.0 | 2.0 | 1269 | $4,500 | $3.55 | 21d | 1 | 0.76mi |
| 5790 NE 20th Ter Fort Lauderdale, FL | 3.0 | 2.0 | 1874 | $6,000 | $3.20 | 24d | 1 | 0.79mi |
| 2155 NE 56th Ct Fort Lauderdale, FL | 3.0 | 2.0 | 1500 | $3,500 | $2.33 | 24d | 1 | 0.84mi |
| 5225 NE 4th Ave Fort Lauderdale, FL | 3.0 | 2.0 | 1650 | $3,300 | $2.00 | 11d | 1 | 0.85mi |
| 5655 NE 5th Ter Fort Lauderdale, FL | 3.0 | 2.0 | 1178 | $3,250 | $2.76 | 15d | 1 | 0.86mi |
| 5655 NE 5th Ter Fort Lauderdale, FL | 3.0 | 2.0 | 1178 | $3,250 | $2.76 | 24d | 1 | 0.86mi |
| 5409 NE 4th Ave Fort Lauderdale, FL | 3.0 | 2.0 | 1178 | $3,200 | $2.72 | 24d | 1 | 0.87mi |
| 4804 NE 21st Ave #4804 Fort Lauderdale, FL | 2.0 | 2.0 | 1400 | $4,500 | $3.21 | 24d | 1 | 0.88mi |
| 2100 NE 45th St #1 Fort Lauderdale, FL | 3.0 | 3.5 | 1340 | $9,500 | $7.09 | 24d | 1 | 0.89mi |
| 4680 NE 5th Ave Fort Lauderdale, FL | 3.0 | 2.0 | 1300 | $3,800 | $2.92 | 7d | 1 | 0.90mi |
| 1421 NE 41st St Oakland Park, FL | 2.0 | 2.0 | 1366 | $4,000 | $2.93 | 24d | 1 | 0.92mi |
| 5910 NE 21st Way Fort Lauderdale, FL | 3.0 | 2.0 | 1823 | $4,950 | $2.72 | 21d | 1 | 0.95mi |
| 540 NE 59th Ct Fort Lauderdale, FL | 3.0 | 2.0 | 964 | $3,400 | $3.53 | 24d | 1 | 0.95mi |
| 1601 NE 63rd St Fort Lauderdale, FL | 3.0 | 2.0 | 1875 | $6,125 | $3.27 | 24d | 1 | 0.96mi |
| 6241 NE 19th Ter Fort Lauderdale, FL | 4.0 | 3.0 | 1828 | $7,500 | $4.10 | 7d | 1 | 0.98mi |
| 1961 NE 62nd Ct Fort Lauderdale, FL | 3.0 | 2.0 | 1630 | $7,000 | $4.29 | 24d | 1 | 0.99mi |
| 4601 NE 4th Ave Unit 1261561P Fort Lauderdale, FL | 3.0 | 2.0 | 1097 | $4,430 | $4.04 | 24d | 1 | 1.01mi |
| 682 NE 43rd St Oakland Park, FL | 3.0 | 2.5 | 1694 | $4,200 | $2.48 | 24d | 1 | 1.03mi |
| 540 NE 61st Ct Fort Lauderdale, FL | 3.0 | 2.0 | 1272 | $3,395 | $2.67 | 2d | 1 | 1.07mi |
| 4580 NE 3rd Ave Fort Lauderdale, FL | 3.0 | 2.0 | 1192 | $3,300 | $2.77 | 20d | 1 | 1.07mi |
| 1740 NE 64th St Fort Lauderdale, FL | 3.0 | 2.0 | 1364 | $4,800 | $3.52 | 10d | 1 | 1.08mi |
| 1740 NE 64th St Fort Lauderdale, FL | 3.0 | 2.0 | 1364 | $4,800 | $3.52 | 3d | 1 | 1.08mi |
| 4800 NE 25th Ave Apt N Fort Lauderdale, FL | 2.0 | 2.0 | 1800 | $3,200 | $1.78 | 21d | 1 | 1.09mi |
HOA detail condo
- Monthly dues
- $1,071 · $12,852/yr
- Likely covers
- landscaping
- Assessments
- None detected in remarks — confirm with the listing agent.
Listing history 26 events
-
2026-06-18days on market $289,900 Active 99 DOM
-
2026-06-17days on market $289,900 Active 98 DOM
-
2026-06-16days on market $289,900 Active 97 DOM
-
2026-06-15days on market $289,900 Active 96 DOM
-
2026-06-13days on market $289,900 Active 94 DOM
-
2026-06-09days on market $289,900 Active 90 DOM
-
2026-06-07days on market $289,900 Active 88 DOM
-
2026-06-04days on market $289,900 Active 85 DOM
-
2026-06-03days on market $289,900 Active 84 DOM
-
2026-06-02days on market $289,900 Active 83 DOM
-
2026-06-01days on market $289,900 Active 82 DOM
-
2026-05-31days on market $289,900 Active 81 DOM
-
2026-01-14historical $2,500
-
2025-11-26price $2,500
-
2025-10-15price $2,700
-
2025-10-01$2,850
-
2025-07-13historical $2,700
-
2025-03-22price $2,700
-
2025-02-01$2,900
-
2024-06-06historical $3,200
-
2024-06-05$289,900 Active
-
2024-04-10price $3,200
-
2024-03-19$3,400
-
1998-07-20soldstatus $124,000
-
1994-03-23soldstatus $92,000
-
1989-09-06soldstatus $90,000
ⓘ Source: listings_history table (triggers on properties + properties_extension) + one-shot
backfill from property_details.listing_events for pre-trigger history.
Tax reassessment forecast FL · Resets to sale price
- Current annual tax
- $6,500 · $542/mo
- Projected year-2 tax
- $6,500 · $542/mo
- Expected delta
- $0/yr ($0/mo · 0.0%)
ⓘ Screening estimate from a state-policy table — verify with the county assessor before closing.
Climate risk First Street
- Flood 3/10 Moderate FEMA zone X (shaded) · 13% chance over 30 yrs
- Wildfire 1/10 Low
- Heat 10/10 Extreme 7 d/yr ≥105°F today · 27 d/yr by 30 yrs out
- Wind 10/10 Extreme 99% chance of damaging wind over 30 yrs
- Air quality 2/10 Low 1 unhealthy d/yr today · 2 by 30 yrs out
Nearby sold comps map
Loading sold comps map…
Walkable amenities ~0.75 mi
Loading nearby amenities…
Taxation est. · year 1
- Rental income
- $53,651
- − Mortgage interest
- −$16,239
- − Property taxes
- −$6,500
- − Insurance
- −$1,450
- − Repairs & maintenance
- −$4,292
- − Management
- −$4,292
- − HOA
- −$12,852
- − Depreciation
- −$8,433
- Taxable loss
- −$408
- Est. tax savings @ 24.0%
- +$98
- After-tax cash flow
- $3,437/yr
For passive investors: Depreciation is non-cash, so a rental often shows a tax loss while cash-flowing — sheltering income. Rental losses are passive: they offset passive income freely, and up to $25,000/yr can offset ordinary (W-2) income if you actively participate and your MAGI is under $100k (phasing out to $0 by $150k); unused losses carry forward. On sale, claimed depreciation is recaptured at up to 25%, and gains may owe capital-gains tax (a 1031 exchange can defer both). Figures are a year-1 estimate at your 24.0% rate — not tax advice; consult a CPA.
Schools (NCES district)
- District
- Broward
- NCES district ID
- 1200180
- Math proficiency
- 42% ▼ -18.00%
- Reading proficiency
- 53% ▼ -5.00%
- Median HH income
- $52,139
- Composite
- 40.88/100
- National rank
- #3621
- State rank
- #46 of 73 in FL
Livability — Fort Lauderdale
- Score
- 82/100
- State rank
- #78
- US rank
- #1293
Category grades
Schools grade is shown separately in the Schools card above.
Census & demographics
- Census place
- Fort Lauderdale, FL
- County
- Broward County · 1,963,430 people
- City population
- 235,769
- Metro
- Miami-Fort Lauderdale-Pompano Beach, FL
- Population (ZIP)
- 30,935
- Household income
- $75,361
- Rent vs Own
- Severe rent burden
- 1755.0
Population outlook (Broward County) Hauer SSP2
- Today (2025)
- 2,207,033 people
- By 2030
- 2,360,704 · +7.0%
- By 2040
- 2,661,208 · +20.6%
- By 2050
- 2,946,698 · +33.5%
- By 2075
- 3,602,273 · +63.2%
- By 2100
- 3,970,984 · +79.9%
Race, ethnicity, and origin ACS 2023
- Neighborhood character
- Diverse neighborhood (Simpson 0.68)
- Race & ethnicity
- White 43% Hispanic / Latino 32% Two or more races 25% Black 17% Asian 2%
- Hispanic origin (detail)
- Mexican 2% Puerto Rican 4% Cuban 4%
- Common ancestry
- Hispanic 5% Lithuanian 3% Romanian 2%
- Foreign-born
- 31% · Canada, Jamaica, Vietnam
- Languages at home
- 59% English-only · Spanish 28% Other Indo-European 5% French/Haitian/Cajun 5%
Political lean MEDSL · Broward
- 2024 margin
- D (+17.0) · D 58.0% · R 41.0%
- 2008→2024 swing
- -17.8pp toward R · 2008: 34.7pp · 2024: 17.0pp
- All cycles
- 2024: D+17.0 2020: D+29.8 2016: D+35.0 2012: D+34.9 2008: D+34.7
Not yet ingested
- Civics
- —
Market trends
- HPI YoY
- ▼ -208.58%
- Current HPI
- 394.9526
- Rent YoY
- ▲ 2.01%
- Metro
- Miami-Fort Lauderdale-Pompano Beach, FL
- State GDP YoY
- ▲ 3.28%
- F500 in state
- 36
Industry mix (Fortune 500 HQ in FL)
| Industry | F500 HQs | Revenue |
|---|---|---|
| Industrial Technology | 2 | $29B |
|
||
| Insurance | 2 | $17B |
|
||
| Retail | 1 | $60B |
|
||
| Technology Distribution | 1 | $58B |
|
||
| Homebuilding | 1 | $35B |
|
||
| Technology Manufacturing | 1 | $35B |
|
||
Price history
-97.2% since first listed14 events — show timeline
- 2026-01-14 Rental Removed $2,500 GFLMLS
- 2025-11-26 Price Changed $2,500 GFLMLS
- 2025-10-15 Price Changed $2,700 GFLMLS
- 2025-10-01 Listed for Rent $2,850 GFLMLS
- 2025-07-13 Rental Removed $2,700 GFLMLS
- 2025-03-22 Price Changed $2,700 GFLMLS
- 2025-02-01 Listed for Rent $2,900 GFLMLS
- 2024-06-06 Rental Removed $3,200 GFLMLS
- 2024-06-05 Listed $289,900 Beaches MLS
- 2024-04-10 Price Changed $3,200 GFLMLS
- 2024-03-19 Listed for Rent $3,400 GFLMLS
- 1998-07-20 Sold (Public Records) $124,000 Public Records
- 1994-03-23 Sold (Public Records) $92,000 Public Records
- 1989-09-06 Sold (Public Records) $90,000 Public Records
Property tax history
+8.9%/yrLatest (2025): $6,500 · +0.2% YoY. Source: county tax records.
Cash-flow waterfall
monthlySold comps — $/sqft
last 12 mo · ≤1 miLoading sold comps…