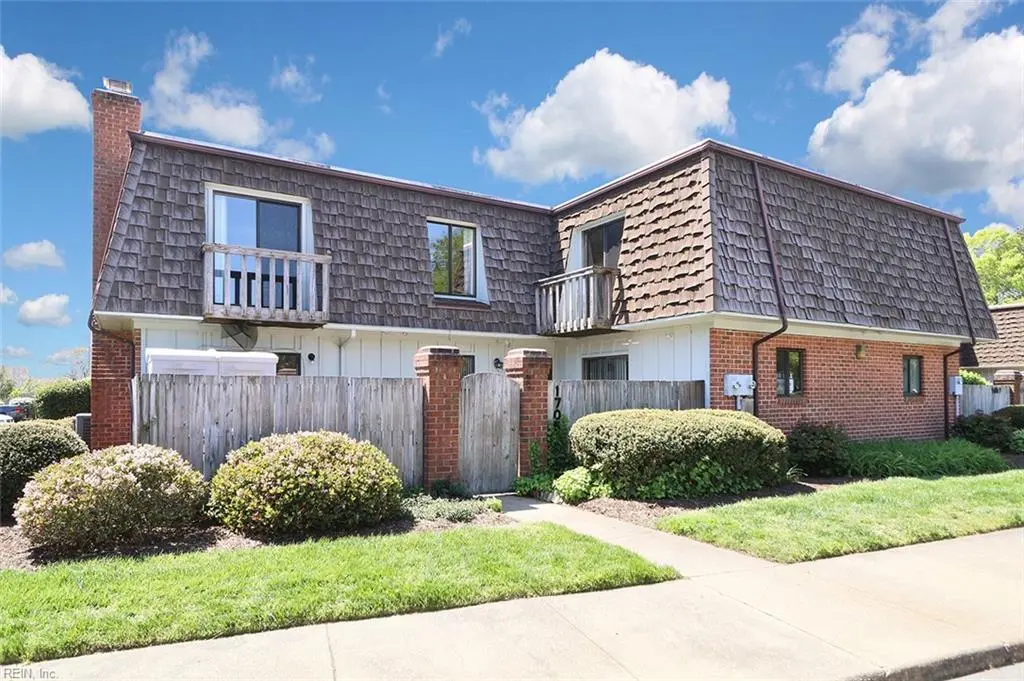
1705 Ocean Bay Dr · Virginia Beach, VA
Flood risk 4/10 · Minor
- FEMA flood zone
- X (unshaded)
- Chance of flooding over 30 yrs
- 0.13%
- Est. flood insurance / yr
- $507 – $1,088
Fire risk 4/10 · Minor
- Est. fire insurance / yr
- $666 – $1,236
Heat risk 9/10 · Severe
- Hot days now (above 102°F)
- 7 days/yr
- Hot days in 30 yrs
- 18 days/yr
Wind risk 8/10 · Major
- Chance of severe wind over 30 yrs
- 99.0%
Air-quality risk 2/10 · Minimal
- Unhealthy air days now
- 1 days/yr
- Unhealthy air days in 30 yrs
- 2 days/yr
Risk factors via First Street. Map © Google.
Why this score? — see what drove the D+ grade
The composite is a weighted blend of 9 inputs, each scored 0–100. Each bar is that input's sub-score; the figure is the points it added to the 100-point composite (weight × sub-score).
- Cash flow +12.6/30.0
- ARV discount +7.5/15.0
- Schools +6.4/10.0
- 1% rule +4.9/10.0
- Rent growth +4.2/5.0
- Livability +4.2/5.0
- DSCR +3.8/10.0
- Condition / age +2.5/5.0
- Appreciation +0.0/10.0
$244,900
🖨 Deal sheet 📄 Offer letter ✓ Due diligence
Listing remarks
Well-maintained 2-level condo offering 3 bedrooms, 2.5 baths, and approximately 1,560 sq ft of comfortable living space. Enjoy a private patio and cozy fireplace, with community amenities including a pool, clubhouse, playgrounds, and tennis courts. Conveniently located near Oceana, Dam Neck, shopping, and more. Sold as-is.
Key facts
- $350 HOA
- Built 1987
- Listed 43 days
Property features AI
Finance
- Other: Neighborhood: SADDLEWOOD CONDOS
- HOA & community: Community amenities: playgrounds, pool, tennis courts; Monthly condo fee: $350; Association management: Ocean Lakes Community Assoc.
Exterior
- Parking: Assigned/reserved parking
- Utilities: City/County water; City/County sewer; Electric water heater; Electric power
- Home design: Attached property; 2-unit condo; Condo on level 1; Two living levels; 2 stories
- Construction: Wood siding; Asphalt shingle roof; Slab foundation; Condo ownership
- Exterior features: Patio; Front privacy wood fence
Interior
- Kitchen: Dishwasher; Electric range; Refrigerator; Disposal; Pantry
- Bedrooms: No bedroom and full bathroom on first floor; Total rooms: 6; Includes foyer and pantry
- Flooring: Carpet; Vinyl
- Bathrooms: 2 full bathrooms; 1 half bathroom
- Heating & cooling: Heat pump; Central air
- Interior features: Cable hookup; Ceiling fan; Decorative wood fireplace (1)
- Laundry & utility: Washer; Dryer
Neighborhood map
What this means for you Summary
Snapshot
- This is a 2-bed/2.5-bath condo listed at $245k.
Deal economics
- At list price, monthly cash flow is $-31 ($-374/yr) — negative.
- To cash-flow at today's rent, offer at most $239k (2.3% below list).
- To meet the 1% rule (rent ≥ 1% of price), the offer needs to be $241k (1.4% below list).
- Recommended offer: $238k (3.0% below list) — sets the bar for market timing.
- Cap rate 6.1% vs local median 3.5% in Virginia Beach — top-decile yield for the area; either an underpriced asset or a hidden risk that comps aren't pricing in. Stress-test before assuming the spread holds.
Location & tenants
- Location reads 83/100 on livability (#38 in VA, #880 nationally) — a professional / high-income tenant draw. Strengths: amenities A+, employment A+, housing A+; Watch: cost of living C-, commute F.
- Va Beach City Public School District (urban): math 69% / reading 78% proficiency, ranked #10 of 131 in VA (top 8%) — strong family-tenant draw, lease renewals of 3-5y typical.
- Zoned schools: Corporate Landing Elementary (math 62% / reading 72%, grade B+, #381 of 1,108 statewide, top 36%, 380 students, 57% FRL); Ocean Lakes High (math 73% / reading 89%, grade A, #52 of 319 statewide, top 17%, 1,855 students, 29% FRL).
- Market conditions: Rents rising fast (+6.6%/yr); 203 active listings in the ZIP; 16 comparable units currently listed for rent nearby; rentals at typical pace (median 21d on market — plan ~3-4 weeks tenant-placement turnaround); solid renter incomes; 666 units permitted in Virginia Beach city in 2024 (347 in 5+ unit buildings).
Forward outlook
- Local home prices are declining (-3.0%/yr); year-one equity from $2k of loan paydown is wiped out by about $7k of value loss. Plan a longer hold.
- Virginia Beach County population projected at +6% by 2050 — modest demand growth; plan on rents tracking national, not racing it.
Negotiation context
- It's been on market 43 days — a 3% lower offer ($238k) is reasonable based on typical stale-listing flexibility.
- 2 sale attempts; this cycle's ask has dropped $25k (9%) from the opening price — seller is motivated, your offer sets the floor, not the list.
- Current owner paid $186k; 32% above their basis — modest negotiation headroom, anchor on the comps not their cost.
Risks & watch-outs
- Climate carrying-cost: severe wind risk, 99% chance of damaging wind over 30y; extreme-heat days projected 7→18/yr by 2055 (HVAC capex compounding) — expect insurance premiums to compound above CPI over the hold.
Questions for the listing agent
- What do current leases actually rent for vs. the listed asking? Can we see a recent rent roll and the last 12 months of T-12 income?
- It's been on market 43 days. Have you received any prior offers? Is the seller open to a 3% concession, seller financing, or rate buy-down credit?
- What does the HOA fee cover, when was the last increase, and are there any pending special assessments or reserve-fund shortfalls?
- Any open or pending special assessments — roof, HVAC, plumbing, elevator, façade? What's the per-unit balance and payoff schedule, and is the seller paying it off at close or rolling it to the buyer?
- Is there a deadline driving the sale (1031 exchange, divorce, estate, relocation)? That informs how much negotiation room exists.
- Schools are A-rated — typically a magnet for longer-tenancy family renters. What's the average tenant stay here, and is there a school-zone premium baked into asking?
- The area grade is low — what's the realistic commute time and amenity access for the typical tenant pool here? Any planned neighborhood developments (good or bad) we should know about?
- What's the average days-on-market for RENTAL listings here right now (not sales)? A rising rental-DOM trend means longer vacancies and softer asking-rent achievability than the comps imply.
- What's the recent tenant-quality profile in this submarket — average credit score on applications, eviction rate, late-payment / NSF rate, and stable-employment percentage? A property-management company in the area should have these aggregated.
- How much new apartment / multifamily construction is in the pipeline within 1–3 miles? Heavy new supply (>2% of stock underway) typically softens rents 12–24 months out; light construction supports rent growth.
Investment metrics
- 1% rule
- 0.99% ✗
- Cap rate
- 6.14%
- Cash-on-cash
- -0.55%
- DSCR
- 0.98
- GRM
- 8.5
CMA / ARV
No comps found within radius.
Projected returns pro-forma
-3.0% appreciation · 6.62% rent growth · sell at horizon
- IRR
- -12.6%
- Equity multiple
- 0.53×
- Total profit
- $-32,372
- Equity at exit
- $36,515
- IRR
- 1.8%
- Equity multiple
- 1.15×
- Total profit
- $10,304
- Equity at exit
- $21,174
Cash invested: $68,572 (down + closing). Projections, not guarantees.
Landlord ↔ Tenant lean methodology
- Overall (STATE)
- 55 Moderately Landlord-Leaning
- State Virginia
- 55 Moderately Landlord-Leaning · D+2
- County
- — inherits STATE
- City
- — inherits STATE
ZIP-level market 23454
- Rents YoY
- 6.6%
- Active inventory
- 203
- Price-to-rent
- 8.5×
Monthly cashflow live
- Estimated rent
- $2,414 high interval (Pro) →
- Mortgage (P&I)
- −$1,284
- Tax from tax record
- −$202 /mo · $2,426/yr
- Insurance
- −$102
- HOA
- −$350
- Vacancy / Maint / Mgmt
- −$507
- Net cashflow
- $-31
Break-even live
UW: 25.0% down · 7.5% · 30yr · 1.5% tax · 5.0% vac · 8.0% maint · 8.0% mgmt
Financing live
Cash to close
- Down payment
- $61,225
- Closing costs
- $7,347
- Reserves months
- —
- Total cash needed
- —
Loan-product check · same deal, 3 products live
Conventional
25% down · 7.5% · 30yr
- Down + closing
- —
- Monthly P&I
- —
- Monthly cashflow
- —
- DSCR
- —
- Eligible?
- —
Personal DTI + credit; lowest rate.
DSCR
20% down · 8.5% · 30yr
- Down + closing
- —
- Monthly P&I
- —
- Monthly cashflow
- —
- DSCR
- —
- Eligible?
- —
No personal income docs; deal must DSCR.
Hard money
10% down · 12.0% · 12mo
- Down + closing
- —
- Monthly P&I
- —
- Monthly cashflow
- —
- DSCR
- —
- Eligible?
- —
Short-term bridge; refi at stabilization.
Rent comps 16 comps
| Address | Beds | Baths | Sqft | Rent | $/sqft | DOM | Units | Dist |
|---|---|---|---|---|---|---|---|---|
| 1671 Ocean Bay Dr Virginia Beach, VA | 2.0 | 2.5 | 1354 | $2,100 | $1.55 | 23d | 1 | 0.05mi |
| 762 Quesnel Dr Virginia Beach, VA | 3.0 | 2.5 | 1541 | $3,600 | $2.34 | 23d | 1 | 0.18mi |
| 792 Quesnel Dr Unit 1 Virginia Beach, VA | 3.0 | 2.5 | 1616 | $2,295 | $1.42 | 7d | 1 | 0.18mi |
| 501 Hillshire Way Virginia Beach, VA | 3.0 | 2.5 | 1459 | $2,745 | $1.88 | 23d | 1 | 0.34mi |
| 1631 Sword Dancer Dr Virginia Beach, VA | 3.0 | 2.0 | 1180 | $2,500 | $2.12 | 12d | 1 | 0.39mi |
| 1631 Sword Dancer Dr Virginia Beach, VA | 3.0 | 2.0 | 1180 | $2,500 | $2.12 | 23d | 1 | 0.39mi |
| 512 Fieldstone Glen Way Virginia Beach, VA | 3.0 | 2.5 | 2100 | $2,550 | $1.21 | 23d | 1 | 0.48mi |
| 1473 Levy Ct Virginia Beach, VA | 3.0 | 2.5 | 1831 | $2,795 | $1.53 | 3d | 1 | 0.50mi |
| 1676 Da Vinci Dr Virginia Beach, VA | 2.0 | 1.0 | 1512 | $1,595 | $1.05 | 4d | 1 | 0.66mi |
| 1676 Da Vinci Dr Virginia Beach, VA | 2.0 | 1.0 | 1512 | $1,595 | $1.05 | 12d | 1 | 0.66mi |
| 1828 Blairmore Arch Virginia Beach, VA | 3.0 | 2.0 | 1300 | $3,000 | $2.31 | 23d | 1 | 1.20mi |
| 1221 Garth Ct Virginia Beach, VA | 3.0 | 2.5 | 1614 | $2,600 | $1.61 | 14d | 1 | 1.37mi |
| 1584 Boles Pl Virginia Beach, VA | 3.0 | 2.5 | 1902 | $2,450 | $1.29 | 4d | 1 | 1.39mi |
| 1149 Balch Pl Virginia Beach, VA | 3.0 | 2.5 | 1450 | $2,495 | $1.72 | 4d | 1 | 1.43mi |
| 1149 Balch Pl Virginia Beach, VA | 3.0 | 2.5 | 1450 | $2,495 | $1.72 | 20d | 1 | 1.43mi |
| 1230 Gunn Hall Dr Virginia Beach, VA | 3.0 | 2.5 | 1764 | $2,650 | $1.50 | 23d | 1 | 1.47mi |
HOA detail condo
- Monthly dues
- $350 · $4,200/yr
- Likely covers
- landscapingpool
- Assessments
- None detected in remarks — confirm with the listing agent.
Listing history 9 events
-
2026-05-08historical Active Under Contract
-
2026-05-04price $244,900
-
2026-04-14$269,900 Active
-
2026-04-01historical
-
2025-12-12price $280,000
-
2025-07-11price $299,000
-
2025-05-13$315,000 Active
-
2006-09-19soldstatus $185,500
-
2004-10-13soldstatus $125,500
ⓘ Source: listings_history table (triggers on properties + properties_extension) + one-shot
backfill from property_details.listing_events for pre-trigger history.
Tax reassessment forecast VA · Resets to sale price
- Current annual tax
- $2,426 · $202/mo
- Projected year-2 tax
- $2,426 · $202/mo
- Expected delta
- $0/yr ($0/mo · 0.0%)
ⓘ Screening estimate from a state-policy table — verify with the county assessor before closing.
Climate risk First Street
- Flood 4/10 Moderate FEMA zone X (unshaded) · 13% chance over 30 yrs
- Wildfire 4/10 Moderate
- Heat 9/10 Extreme 7 d/yr ≥102°F today · 18 d/yr by 30 yrs out
- Wind 8/10 Severe 99% chance of damaging wind over 30 yrs
- Air quality 2/10 Low 1 unhealthy d/yr today · 2 by 30 yrs out
Nearby sold comps map
Loading sold comps map…
Walkable amenities ~0.75 mi
Loading nearby amenities…
Taxation est. · year 1
- Rental income
- $28,971
- − Mortgage interest
- −$13,718
- − Property taxes
- −$2,426
- − Insurance
- −$1,224
- − Repairs & maintenance
- −$2,318
- − Management
- −$2,318
- − HOA
- −$4,200
- − Depreciation
- −$7,124
- Taxable loss
- −$4,357
- Est. tax savings @ 24.0%
- +$1,046
- After-tax cash flow
- $671/yr
For passive investors: Depreciation is non-cash, so a rental often shows a tax loss while cash-flowing — sheltering income. Rental losses are passive: they offset passive income freely, and up to $25,000/yr can offset ordinary (W-2) income if you actively participate and your MAGI is under $100k (phasing out to $0 by $150k); unused losses carry forward. On sale, claimed depreciation is recaptured at up to 25%, and gains may owe capital-gains tax (a 1031 exchange can defer both). Figures are a year-1 estimate at your 24.0% rate — not tax advice; consult a CPA.
Schools (NCES district)
- District
- Va Beach City Public School District
- NCES district ID
- 5103840
- Math proficiency
- 69% ▼ -19.00%
- Reading proficiency
- 78% ▼ -7.00%
- Median HH income
- $66,452
- Composite
- 63.81/100
- National rank
- #594
- State rank
- #10 of 131 in VA
Livability — Virginia Beach
- Score
- 83/100
- State rank
- #38
- US rank
- #880
Category grades
Schools grade is shown separately in the Schools card above.
Census & demographics
- Census place
- Virginia Beach, VA
- County
- Virginia Beach City · 448,227 people
- City population
- 448,227
- Metro
- Virginia Beach-Norfolk-Newport News, VA-NC
- Population (ZIP)
- 58,178
- Household income
- $102,796
- Rent vs Own
- Severe rent burden
- 1696.0
Population outlook (Virginia Beach County) Hauer SSP2
- Today (2025)
- 480,401 people
- By 2030
- 491,221 · +2.3%
- By 2040
- 504,882 · +5.1%
- By 2050
- 508,847 · +5.9%
- By 2075
- 504,831 · +5.1%
- By 2100
- 465,867 · -3.0%
Race, ethnicity, and origin ACS 2023
- Neighborhood character
- Predominantly White (69%)
- Race & ethnicity
- White 69% Black 13% Two or more races 9% Hispanic / Latino 7% Asian 4%
- Hispanic origin (detail)
- Mexican 2% Puerto Rican 2%
- Common ancestry
- Romanian 3% Lithuanian 3% Slovak 3%
- Foreign-born
- 7% · Canada, China
- Languages at home
- 90% English-only · Spanish 4% Tagalog/Filipino 1% Chinese 1%
Political lean MEDSL · Virginia Beach
- 2024 margin
- Toss-up / Even · D 50.7% · R 48.0% · Other 1.3%
- 2008→2024 swing
- +3.4pp toward D · 2008: -0.7pp · 2024: 2.6pp
- All cycles
- 2024: D+2.6 2020: D+5.4 2016: R+4.5 2012: R+2.5 2008: R+0.7
Not yet ingested
- Civics
- —
Market trends
- HPI YoY
- ▼ -385.89%
- Current HPI
- 328.85
- Rent YoY
- ▲ 6.62%
- Metro
- Virginia Beach-Norfolk-Newport News, VA-NC
- State GDP YoY
- ▲ 2.40%
- F500 in state
- 50
Industry mix (Fortune 500 HQ in VA)
| Industry | F500 HQs | Revenue |
|---|---|---|
| Aerospace / Defense | 4 | $236B |
|
||
| Technology / Defense | 3 | $32B |
|
||
| Financial Services | 2 | $176B |
|
||
| Utilities | 2 | $27B |
|
||
| Insurance | 2 | $25B |
|
||
| Technology | 2 | $15B |
|
||
Price history
+95.1% since first listed9 events — show timeline
- 2026-05-08 Contingent — REINMLS
- 2026-05-04 Price Changed $244,900 REINMLS
- 2026-04-14 Listed $269,900 REINMLS
- 2026-04-01 Listing Removed — REINMLS
- 2025-12-12 Price Changed $280,000 REINMLS
- 2025-07-11 Price Changed $299,000 REINMLS
- 2025-05-13 Listed $315,000 REINMLS
- 2006-09-19 Sold (Public Records) $185,500 Public Records
- 2004-10-13 Sold (Public Records) $125,500 Public Records
Property tax history
+6.1%/yrLatest (2025): $2,426 · +7.0% YoY. Source: county tax records.
Cash-flow waterfall
monthlySold comps — $/sqft
last 12 mo · ≤1 miLoading sold comps…