365 Stella Maris Dr N #2905 · Goodland, FL
Flood risk 9/10 · Severe
- FEMA flood zone
- AE
- Chance of flooding over 30 yrs
- 0.99%
- Est. flood insurance / yr
- $1,737 – $8,500
Fire risk 8/10 · Major
- Est. fire insurance / yr
- $947 – $1,759
Heat risk 10/10 · Severe
- Hot days now (above 109°F)
- 7 days/yr
- Hot days in 30 yrs
- 30 days/yr
Wind risk 10/10 · Severe
- Chance of severe wind over 30 yrs
- 99.0%
Air-quality risk 3/10 · Minor
- Unhealthy air days now
- 2 days/yr
- Unhealthy air days in 30 yrs
- 2 days/yr
Risk factors via First Street. Map © Google.
Why this score? — see what drove the B- grade
The composite is a weighted blend of 9 inputs, each scored 0–100. Each bar is that input's sub-score; the figure is the points it added to the 100-point composite (weight × sub-score).
- Cash flow +24.8/30.0
- 1% rule +9.4/10.0
- DSCR +8.0/10.0
- ARV discount +7.5/15.0
- Schools +5.0/10.0
- Appreciation +4.3/10.0
- Rent growth +3.3/5.0
- Condition / age +2.5/5.0
- Livability +2.4/5.0
$230,000
🖨 Deal sheet (PDF) 📄 Offer letter ✓ Due diligence
Listing remarks
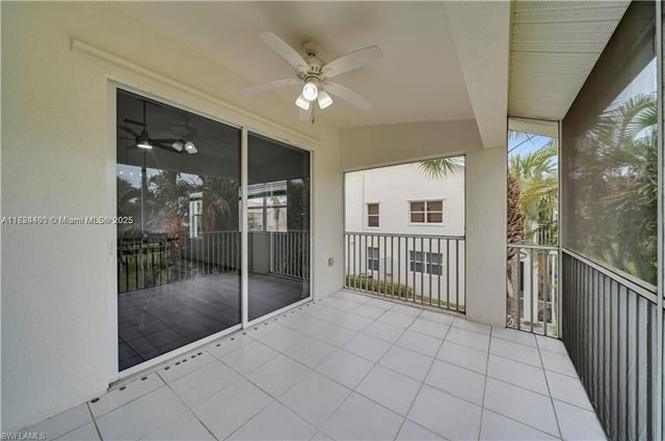
This beautiful apartment has 3-bedroom, 2-bathroom, the condo is perfect for those who crave a serene waterfront lifestyle with easy access to adventure. Inside, you’ll find a well-appointed split floor plan featuring recently added vinyl plank flooring throughout, granite countertops and stainless-steel appliances. This Community is a perfect Paradise! Welcome to coastal living at its finest in the highly sought-after Stella Maris – Port of the Islands community! Do not miss this opportunity!
Key facts
- Split floor plan
- Granite countertops
- Vinyl plank flooring
Tags
Property features AI
Finance
- Other: Unit is one of 2 units per building and 4 units in the complex; 2 floors in the building; Lot described as 4 lots (lot unit 2905)
- HOA & community: Mandatory HOA; Quarterly HOA fee of $1,462 (total annual recurring fees $5,848); Condo-managed community; Community amenities include basketball and a community pool
Exterior
- Parking: Attached 1-car garage
- Utilities: Well water; Central sewer; Cable available
- Home design: Residential property in Port of the Islands (Stella Maris); Low-rise building (1-3), 2-story design; Rear exposure facing north
- Construction: Concrete block construction; Built in 2007
- Exterior features: Stone exterior finish; Shingle roof; Storm protection details in remarks; Windows details in remarks; Pool/Club view
Interior
- Bedrooms: 3 bedrooms
- Flooring: Tile flooring
- Bathrooms: 2 full bathrooms; No master bath
- Heating & cooling: Central electric heat; Central electric cooling
- Interior features: See remarks for additional interior details; Unfurnished
Neighborhood map
What this means for you Summary
Snapshot
- This is a 3-bed/2.0-bath condo listed at $230k.
Deal economics
- At list price, monthly cash flow is $61 ($728/yr) — positive.
- The deal already cash-flows at list — no discount required.
- Meets the 1% rule at list price ($3k rent vs $230k).
- Recommended offer: $202k (12.0% below list) — sets the bar for market timing.
Location & tenants
- Location reads 47/100 on livability (#893 in FL) — a working-class tenant base; expect higher turnover. Strengths: cost of living A+, crime A; Watch: health & safety D, amenities F, commute F.
- Collier (suburban): math 60% / reading 56% proficiency, ranked #16 of 73 in FL (top 22%) — acceptable for families but not a draw, mixed tenant base, ~2y average lease.
- Market conditions: Rents rising (+3.2%/yr); 900 active listings in the ZIP; solid renter incomes; 3,520 units permitted in Collier County in 2024 (959 in 5+ unit buildings).
- This rent runs 45% of the median local income ($89k/yr) — at the standard rent-burdened threshold; future hikes will face affordability resistance.
Forward outlook
- Local home prices are declining (-1.5%/yr); year-one equity from $2k of loan paydown is wiped out by about $3k of value loss. Plan a longer hold.
- Collier County population projected at +30% by 2050 — long-run rental-demand tailwind backs the buy-and-hold thesis.
Negotiation context
- It's been on market 128 days — a 12% lower offer ($202k) is reasonable based on typical stale-listing flexibility.
- 21 sale attempts since 4y ago; this cycle's ask has dropped $20k (8%) from the opening price — seller is motivated, your offer sets the floor, not the list.
Risks & watch-outs
- Watch-outs: flood insurance adds $427/mo.
- Climate carrying-cost: in FEMA flood zone AE (mandatory federal flood insurance); severe wind risk, 99% chance of damaging wind over 30y; severe wildfire risk; extreme-heat days projected 7→30/yr by 2055 (HVAC capex compounding) — expect insurance premiums to compound above CPI over the hold.
Questions for the listing agent
- It's been on market 128 days. Have you received any prior offers? Is the seller open to a 12% concession, seller financing, or rate buy-down credit?
- What's the actual annual flood-insurance premium (NFIP or private), and is the property in a SFHA with mandatory coverage?
- What does the HOA fee cover, when was the last increase, and are there any pending special assessments or reserve-fund shortfalls?
- Any open or pending special assessments — roof, HVAC, plumbing, elevator, façade? What's the per-unit balance and payoff schedule, and is the seller paying it off at close or rolling it to the buyer?
- Why hasn't it sold? Are there any deal-killer items the seller is aware of (foundation, flood, title, zoning, code violations)?
- Is there a deadline driving the sale (1031 exchange, divorce, estate, relocation)? That informs how much negotiation room exists.
- What's the average days-on-market for RENTAL listings here right now (not sales)? A rising rental-DOM trend means longer vacancies and softer asking-rent achievability than the comps imply.
- What's the recent tenant-quality profile in this submarket — average credit score on applications, eviction rate, late-payment / NSF rate, and stable-employment percentage? A property-management company in the area should have these aggregated.
- How much new apartment / multifamily construction is in the pipeline within 1–3 miles? Heavy new supply (>2% of stock underway) typically softens rents 12–24 months out; light construction supports rent growth.
Investment metrics
- 1% rule
- 1.44% ✓
- Cap rate
- 8.83%
- Cash-on-cash
- 9.08%
- DSCR
- 1.40
- GRM
- 5.8
CMA / ARV
No comps found within radius.
Projected returns pro-forma
-1.48% appreciation · 3.21% rent growth · sell at horizon
- IRR
- -6.3%
- Equity multiple
- 0.74×
- Total profit
- $-17,055
- Equity at exit
- $50,258
- IRR
- 1.6%
- Equity multiple
- 1.15×
- Total profit
- $9,381
- Equity at exit
- $48,412
Cash invested: $64,400 (down + closing). Projections, not guarantees.
Landlord ↔ Tenant lean methodology
- Overall (STATE)
- 87 Strongly Landlord-Friendly
- State Florida
- 87 Strongly Landlord-Friendly · R+3
- County
- — inherits STATE
- City
- — inherits STATE
ZIP-level market 34114
- Home prices YoY
- -0.6%
- Rents YoY
- 3.2%
- Active inventory
- 900
- Price-to-rent
- 5.8×
Monthly cashflow live
- Estimated rent
- $3,314 medium interval (Pro) →
- Mortgage (P&I)
- −$1,206
- Tax from tax record
- −$342 /mo · $4,105/yr
- Insurance
- −$96
- Flood insurance flood zone
- −$427 /mo · $5,118/yr
- HOA
- −$487
- Vacancy / Maint / Mgmt
- −$696
- Net cashflow
- $61
Break-even live
Sensitivity live
| Price | -10% $191 | -5% $126 | +0% $61 | +5% $-4 | +10% $-70 |
|---|---|---|---|---|---|
| Rent | -10% $-201 | -5% $-70 | +0% $61 | +5% $192 | +10% $322 |
| Rate | -1.0pp $176 | -0.5pp $119 | base $61 | +0.5pp $1 | +1.0pp $-60 |
UW: 25.0% down · 7.5% · 30yr · 1.5% tax · 5.0% vac · 8.0% maint · 8.0% mgmt
Financing live
Cash to close
- Down payment
- $57,500
- Closing costs
- $6,900
- Reserves months
- —
- Total cash needed
- —
Loan-product check · same deal, 3 products live
Conventional
25% down · 7.5% · 30yr
- Down + closing
- —
- Monthly P&I
- —
- Monthly cashflow
- —
- DSCR
- —
- Eligible?
- —
Personal DTI + credit; lowest rate.
DSCR
20% down · 8.5% · 30yr
- Down + closing
- —
- Monthly P&I
- —
- Monthly cashflow
- —
- DSCR
- —
- Eligible?
- —
No personal income docs; deal must DSCR.
Hard money
10% down · 12.0% · 12mo
- Down + closing
- —
- Monthly P&I
- —
- Monthly cashflow
- —
- DSCR
- —
- Eligible?
- —
Short-term bridge; refi at stabilization.
HOA detail condo
- Monthly dues
- $487 · $5,844/yr
- Likely covers
- water
- Assessments
- None detected in remarks — confirm with the listing agent.
Listing history 50 events
-
2026-06-18days on market $230,000 Active 128 DOM
-
2026-06-17days on market $230,000 Active 127 DOM
-
2026-06-16days on market $230,000 Active 126 DOM
-
2026-06-15days on market $230,000 Active 125 DOM
-
2026-06-14days on market $230,000 Active 123 DOM
-
2026-06-10days on market $230,000 Active 120 DOM
-
2026-06-09days on market $230,000 Active 119 DOM
-
2026-06-08days on market $230,000 Active 118 DOM
-
2026-06-07days on market $230,000 Active 117 DOM
-
2026-06-03days on market $230,000 Active 113 DOM
-
2026-06-02days on market $230,000 Active 112 DOM
-
2026-06-01days on market $230,000 Active 111 DOM
-
2026-05-31days on market $230,000 Active 110 DOM
-
2026-05-30days on market $230,000 Active 109 DOM
-
2026-02-10price $230,000
-
2026-02-10$250,000 Active
-
2025-12-17historical
-
2025-08-28price $250,000
-
2025-08-07price $290,000
-
2025-06-18$310,000 Active
-
2025-06-11historical $2,000
-
2025-06-11price $2,000
-
2025-06-11historical
-
2025-06-11historical
-
2025-06-11historical
-
2025-06-10price $300,000
-
2025-06-10price $300,000
-
2025-05-14price $300,000
-
2025-05-09status Active
-
2025-05-06historical
-
2025-04-22$309,900 Active
-
2025-04-10$2,400
-
2025-04-10historical $2,400
-
2025-04-09$309,900 Active
-
2025-04-09$2,400
-
2025-04-08$309,900 Active
-
2025-03-12historical $2,500
-
2025-03-11historical
-
2025-03-11historical
-
2025-03-11historical
-
2025-02-19$319,900 Active
-
2025-02-06price $319,900
-
2025-02-06price $319,900
-
2024-12-31historical
-
2024-12-16status Active
-
2024-12-03status Active
-
2024-12-03status Active
-
2024-10-31price $319,900
-
2024-10-31price $319,900
-
2024-10-31historical
ⓘ Source: listings_history table (triggers on properties + properties_extension) + one-shot
backfill from property_details.listing_events for pre-trigger history.
Tax reassessment forecast FL · Resets to sale price
- Current annual tax
- $4,105 · $342/mo
- Projected year-2 tax
- $4,105 · $342/mo
- Expected delta
- $0/yr ($0/mo · 0.0%)
ⓘ Screening estimate from a state-policy table — verify with the county assessor before closing.
Climate risk First Street
- Flood 9/10 Extreme FEMA zone AE · 99% chance over 30 yrs
- Wildfire 8/10 Severe
- Heat 10/10 Extreme 7 d/yr ≥109°F today · 30 d/yr by 30 yrs out
- Wind 10/10 Extreme 99% chance of damaging wind over 30 yrs
- Air quality 3/10 Moderate 2 unhealthy d/yr today · 2 by 30 yrs out
Nearby sold comps map
Loading sold comps map…
Walkable amenities ~0.75 mi
Loading nearby amenities…
Taxation est. · year 1
- Rental income
- $39,770
- − Mortgage interest
- −$12,884
- − Property taxes
- −$4,105
- − Insurance
- −$6,268
- − Repairs & maintenance
- −$3,182
- − Management
- −$3,182
- − HOA
- −$5,844
- − Depreciation
- −$6,691
- Taxable loss
- −$2,385
- Est. tax savings @ 24.0%
- +$572
- After-tax cash flow
- $1,300/yr
For passive investors: Depreciation is non-cash, so a rental often shows a tax loss while cash-flowing — sheltering income. Rental losses are passive: they offset passive income freely, and up to $25,000/yr can offset ordinary (W-2) income if you actively participate and your MAGI is under $100k (phasing out to $0 by $150k); unused losses carry forward. On sale, claimed depreciation is recaptured at up to 25%, and gains may owe capital-gains tax (a 1031 exchange can defer both). Figures are a year-1 estimate at your 24.0% rate — not tax advice; consult a CPA.
Schools (NCES district)
- District
- Collier
- NCES district ID
- 1200330
- Math proficiency
- 60% ▼ -4.00%
- Reading proficiency
- 56% ▼ -2.00%
- Median HH income
- $58,275
- Composite
- 50.23/100
- National rank
- #1892
- State rank
- #16 of 73 in FL
Livability — Goodland
- Score
- 47/100
- State rank
- #893
- US rank
- #26197
Category grades
Schools grade is shown separately in the Schools card above.
Census & demographics
- County
- Collier County · 396,295 people
- Metro
- Naples-Marco Island, FL
- Population (ZIP)
- 23,559
- Household income
- $89,334
- Rent vs Own
- Severe rent burden
- 550.0
Population outlook (Collier County) Hauer SSP2
- Today (2025)
- 420,858 people
- By 2030
- 450,054 · +6.9%
- By 2040
- 502,232 · +19.3%
- By 2050
- 544,932 · +29.5%
- By 2075
- 627,203 · +49.0%
- By 2100
- 659,015 · +56.6%
Race, ethnicity, and origin ACS 2023
- Neighborhood character
- Predominantly White (72%)
- Race & ethnicity
- White 72% Hispanic / Latino 17% Two or more races 13% Black 7%
- Hispanic origin (detail)
- Mexican 7% Puerto Rican 1% Cuban 3%
- Common ancestry
- Hispanic 5% Romanian 4% Lithuanian 1%
- Foreign-born
- 21% · Canada, Jamaica
- Languages at home
- 75% English-only · Spanish 15% French/Haitian/Cajun 5% Other Indo-European 4%
Political lean MEDSL · Collier
- 2024 margin
- Solid R (+33.1) · D 33.1% · R 66.2%
- 2008→2024 swing
- -10.6pp toward R · 2008: -22.5pp · 2024: -33.1pp
- All cycles
- 2024: R+33.1 2020: R+24.7 2016: R+26.0 2012: R+30.1 2008: R+22.5
Not yet ingested
- Civics
- —
Market trends
- HPI YoY
- ▼ -1.48%
- Current HPI
- 266.5545
- Rent YoY
- ▲ 3.21%
- Metro
- Naples-Marco Island, FL
- State GDP YoY
- ▲ 3.28%
- F500 in state
- 36
Industry mix (Fortune 500 HQ in FL)
| Industry | F500 HQs | Revenue |
|---|---|---|
| Industrial Technology | 2 | $29B |
|
||
| Insurance | 2 | $17B |
|
||
| Retail | 1 | $60B |
|
||
| Technology Distribution | 1 | $58B |
|
||
| Homebuilding | 1 | $35B |
|
||
| Technology Manufacturing | 1 | $35B |
|
||
Price history
-30.1% since first listed65 events — show timeline
- 2026-02-10 Price Changed $230,000 NAPLESMLS
- 2026-02-10 Listed $250,000 NAPLESMLS
- 2025-12-17 Listing Removed — MARMLS
- 2025-08-28 Price Changed $250,000 MARMLS
- 2025-08-07 Price Changed $290,000 MARMLS
- 2025-06-18 Listed $310,000 MARMLS
- 2025-06-11 Rental Removed $2,000 STELLARMLS
- 2025-06-11 Price Changed $2,000 STELLARMLS
- 2025-06-11 Listing Removed — Stellar MLS as Distributed by MLS Grid
- 2025-06-11 Listing Removed — MARMLS
- 2025-06-11 Listing Removed — FORTMLS
- 2025-06-10 Price Changed $300,000 MARMLS
- 2025-06-10 Price Changed $300,000 Stellar MLS as Distributed by MLS Grid
- 2025-05-14 Price Changed $300,000 FORTMLS
- 2025-05-09 Relisted — FORTMLS
- 2025-05-06 Listing Removed — FORTMLS
- 2025-04-22 Listed $309,900 MARMLS
- 2025-04-10 Listed for Rent $2,400 STELLARMLS
- 2025-04-10 Rental Removed $2,400 FORTMLS
- 2025-04-09 Listed $309,900 Stellar MLS as Distributed by MLS Grid
- 2025-04-09 Listed for Rent $2,400 FORTMLS
- 2025-04-08 Listed $309,900 FORTMLS
- 2025-03-12 Rental Removed $2,500 NAPLESMLS
- 2025-03-11 Listing Removed — Stellar MLS as Distributed by MLS Grid
- 2025-03-11 Listing Removed — MARMLS
- 2025-03-11 Listing Removed — NAPLESMLS
- 2025-02-19 Listed $319,900 Stellar MLS as Distributed by MLS Grid
- 2025-02-06 Price Changed $319,900 NAPLESMLS
- 2025-02-06 Price Changed $319,900 MARMLS
- 2024-12-31 Listing Removed — Stellar MLS as Distributed by MLS Grid
- 2024-12-16 Relisted — Stellar MLS as Distributed by MLS Grid
- 2024-12-03 Relisted — NAPLESMLS
- 2024-12-03 Relisted — MARMLS
- 2024-10-31 Price Changed $319,900 MARMLS
- 2024-10-31 Price Changed $319,900 Stellar MLS as Distributed by MLS Grid
- 2024-10-31 Price Changed $329,900 Stellar MLS as Distributed by MLS Grid
- 2024-10-31 Price Changed $329,900 MARMLS
- 2024-10-31 Price Changed $329,900 NAPLESMLS
- 2024-10-31 Listing Removed — NAPLESMLS
- 2024-10-22 Price Changed $2,500 NAPLESMLS
- 2024-10-21 Price Changed $319,900 NAPLESMLS
- 2024-08-15 Listed for Rent $2,700 NAPLESMLS
- 2024-08-15 Rental Removed $4,000 NAPLESMLS
- 2024-08-07 Listed for Rent $4,000 NAPLESMLS
- 2024-07-16 Rental Removed $3,000 NAPLESMLS
- 2024-06-20 Price Changed $339,900 NAPLESMLS
- 2024-06-20 Price Changed $339,900 Stellar MLS as Distributed by MLS Grid
- 2024-06-20 Price Changed $339,900 MARMLS
- 2024-06-05 Listed for Rent $3,000 NAPLESMLS
- 2024-05-23 Listed $344,900 Stellar MLS as Distributed by MLS Grid
- 2024-05-20 Price Changed $344,900 NAPLESMLS
- 2024-05-20 Price Changed $344,900 MARMLS
- 2024-04-02 Listed $349,900 MARMLS
- 2024-03-29 Listed $349,900 NAPLESMLS
- 2024-02-06 Rental Removed $3,000 FORTMLS
- 2024-01-31 Listed for Rent $3,000 FORTMLS
- 2023-07-09 Sold (Public Records) $310,000 Public Records
- 2023-07-01 Sold (MLS) $310,000 NAPLESMLS
- 2023-05-09 Pending — NAPLESMLS
- 2023-03-03 Price Changed $319,000 NAPLESMLS
- 2023-02-24 Price Changed $335,000 NAPLESMLS
- 2022-12-02 Price Changed $319,000 NAPLESMLS
- 2022-11-15 Listed $329,000 NAPLESMLS
- 2022-11-10 Listing Removed — NAPLESMLS
- 2022-10-25 Listed $329,000 NAPLESMLS
Property tax history
+9.3%/yrLatest (2025): $4,105 · -24.3% YoY. Source: county tax records.
Cash-flow waterfall
monthlySold comps — $/sqft
last 12 mo · ≤1 miLoading sold comps…