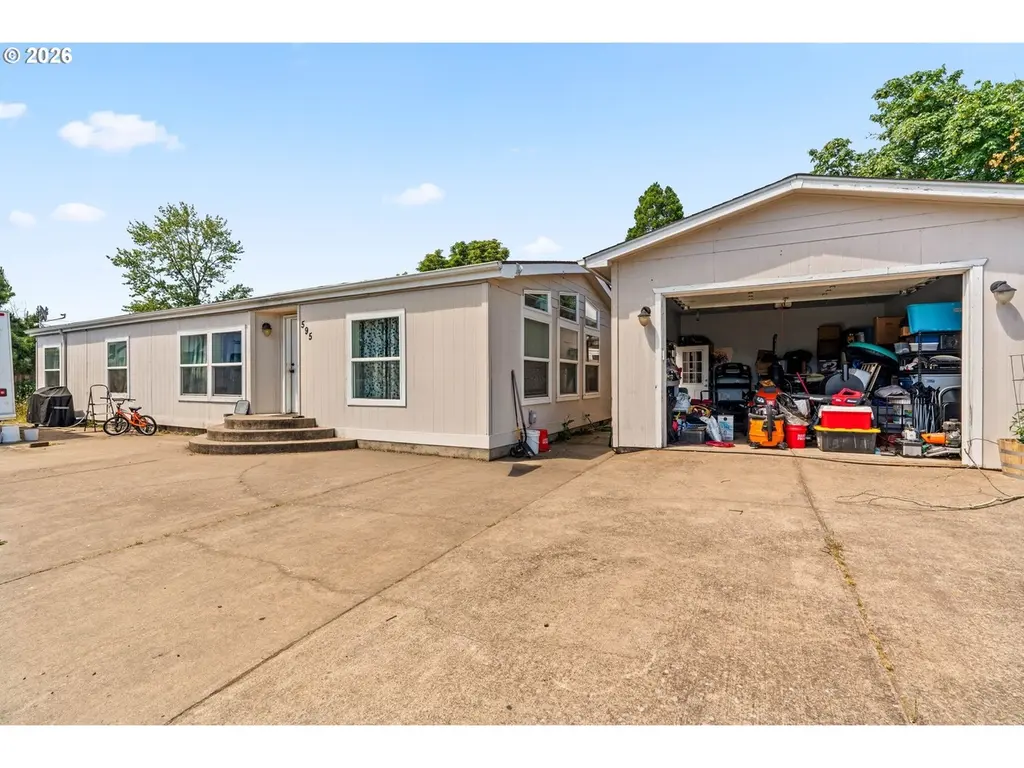
595 Kesling St · Harrisburg, OR
Flood risk 4/10 · Minor
- FEMA flood zone
- X (unshaded)
- Chance of flooding over 30 yrs
- 0.13%
- Est. flood insurance / yr
- $507 – $1,088
Fire risk 1/10 · Minimal
- Est. fire insurance / yr
- $498 – $926
Heat risk 4/10 · Minor
- Hot days now (above 92°F)
- 7 days/yr
- Hot days in 30 yrs
- 15 days/yr
Wind risk 1/10 · Minimal
- Chance of severe wind over 30 yrs
- —
Air-quality risk 9/10 · Severe
- Unhealthy air days now
- 12 days/yr
- Unhealthy air days in 30 yrs
- 12 days/yr
Risk factors via First Street. Map © Google.
Why this score? — see what drove the C- grade
The composite is a weighted blend of 9 inputs, each scored 0–100. Each bar is that input's sub-score; the figure is the points it added to the 100-point composite (weight × sub-score).
- Cash flow +22.0/30.0
- ARV discount +7.5/15.0
- DSCR +7.1/10.0
- 1% rule +4.8/10.0
- Livability +3.6/5.0
- Schools +3.5/10.0
- Rent growth +2.5/5.0
- Condition / age +2.5/5.0
- Appreciation +0.0/10.0
$175,000
🖨 Deal sheet (PDF) 📄 Offer letter ✓ Due diligence
Listing remarks MLS
2 Houses, 1 tax lot-zoned R2.MFG home with 2 car detached garage that is 1568 sq feet AND stick built home with 1 car garage that is 760 sq feet @ 370 S 6th St. Fantastic opportunity for flexible living or investment. Both homes have updates throughout. Mfg home has RV parking space. Homes have separate utility meters, parking, driveways and back yards. Yr built: Mfg home is 1995 and stick built is 1946 w/zonal heat and vinyl siding. Possible owner carry with appropriate down payment & credit.
Key facts
- 2 garage spots
- Built 1995
- Listed 25 days
Property features AI
Finance
- Other: Lot size range: under 3,000 sq ft
- Financial info: Rental amount listed as $1,800
- HOA & community: Located in a private ownership park; Land lease (park lot rent $800 monthly); land lease expires June 30, 2026
Exterior
- Parking: RV access/parking and RV hookups; Detached, extra-deep oversized garage; Detached 2-car garage; Total parking spaces: 2
- Security: Security details not specified
- Utilities: Public water; Public sewer; Electric service (fuel: electricity)
- Home design: Manufactured home in a park; Residential property, resale; Single-story (one level); No notable view
- Construction: Built in 1995; Pillar/post/pier foundation
- Exterior features: RV/boat storage and RV parking/hookup; T-111 siding; Composition roof; Paved road access; Located on a cul-de-sac
Interior
- Kitchen: Kitchen (appliances not specified); Hot water: electric
- Bedrooms: Primary bedroom on the main level; Additional bedrooms: 2nd bedroom, 3rd bedroom
- Flooring: Laminate flooring
- Bathrooms: Two full bathrooms (both on the main level)
- Heating & cooling: Forced air heating; Central air conditioning
- Interior features: One-level layout (accessible); Laminate flooring; Double-pane windows with vinyl frames; Crawl space
- Laundry & utility: Laundry/utility details not specified
Neighborhood map
What this means for you Summary
Snapshot
- This is a 3-bed/2.0-bath other listed at $175k.
Deal economics
- At list price, monthly cash flow is $280 ($3k/yr) — positive.
- The deal already cash-flows at list — no discount required.
- To meet the 1% rule (rent ≥ 1% of price), the offer needs to be $171k (2.3% below list).
- Recommended offer: $171k (2.3% below list) — sets the bar for 1% rule.
Location & tenants
- Location reads 71/100 on livability (#124 in OR) — a middle-class / working-renter tenant base. Strengths: health & safety A+, housing A, cost of living A-; Watch: amenities C-, commute F, employment F.
- Harrisburg SD 7J (town): math 34% / reading 40% proficiency, ranked #123 of 183 in OR (top 67%) — families likely to look elsewhere, expect single-tenant / working-renter base with shorter leases.
- Zoned schools: Harrisburg Elementary School (math 24% / reading 54%, grade F, #183 of 412 statewide, top 47%, 288 students, 66% FRL); Harrisburg Middle School (math 22% / reading 32%, grade F, #96 of 128 statewide, top 78%, 238 students, 66% FRL); Harrisburg High School (math 10% / reading 70%, grade F, #69 of 143 statewide, top 54%, 250 students, 33% FRL).
- Market conditions: 38 active listings in the ZIP; 311 units permitted in Linn County in 2024 (60 in 5+ unit buildings).
Forward outlook
- Local home prices are declining (-3.0%/yr); year-one equity from $1k of loan paydown is wiped out by about $5k of value loss. Plan a longer hold.
- Linn County population projected at +5% by 2050 — modest demand growth; plan on rents tracking national, not racing it.
Negotiation context
- It's been on market 25 days — a 2% lower offer ($172k) is reasonable based on typical stale-listing flexibility.
- 2 sale attempts since 5y ago with the ask held roughly flat each time — persistent listings suggest the price (not the market) is what's stuck; bring a comps-based counter.
Questions for the listing agent
- Is there a deadline driving the sale (1031 exchange, divorce, estate, relocation)? That informs how much negotiation room exists.
- Schools are D-rated, which usually means shorter tenancies and higher turnover. Who's the typical renter profile here, and what's been the actual vacancy rate?
- What's the average days-on-market for RENTAL listings here right now (not sales)? A rising rental-DOM trend means longer vacancies and softer asking-rent achievability than the comps imply.
- What's the recent tenant-quality profile in this submarket — average credit score on applications, eviction rate, late-payment / NSF rate, and stable-employment percentage? A property-management company in the area should have these aggregated.
- How much new for-sale + rental construction is in the pipeline within 1–3 miles? Heavy new supply typically softens prices + rents 12–24 months out; constrained supply supports both.
Investment metrics
- 1% rule
- 0.98% ✗
- Cap rate
- 8.21%
- Cash-on-cash
- 6.86%
- DSCR
- 1.31
- GRM
- 8.5
CMA / ARV
No comps found within radius.
Projected returns pro-forma
-3.0% appreciation · 3.0% rent growth · sell at horizon
- IRR
- -5.8%
- Equity multiple
- 0.78×
- Total profit
- $-10,568
- Equity at exit
- $26,093
- IRR
- 3.8%
- Equity multiple
- 1.28×
- Total profit
- $13,539
- Equity at exit
- $15,131
Cash invested: $49,000 (down + closing). Projections, not guarantees.
Landlord ↔ Tenant lean methodology
- Overall (STATE)
- 28 Tenant-Leaning
- State Oregon
- 28 Tenant-Leaning · D+6
- County
- — inherits STATE
- City
- — inherits STATE
ZIP-level market 97446
- Active inventory
- 38
- Price-to-rent
- 8.5×
Monthly cashflow live
- Estimated rent
- $1,710 medium interval (Pro) →
- Mortgage (P&I)
- −$918
- Tax from tax record
- −$80 /mo · $962/yr
- Insurance
- −$73
- HOA
- −$0
- Vacancy / Maint / Mgmt
- −$359
- Net cashflow
- $280
Break-even live
Sensitivity live
| Price | -10% $379 | -5% $330 | +0% $280 | +5% $231 | +10% $181 |
|---|---|---|---|---|---|
| Rent | -10% $145 | -5% $213 | +0% $280 | +5% $348 | +10% $415 |
| Rate | -1.0pp $368 | -0.5pp $325 | base $280 | +0.5pp $235 | +1.0pp $189 |
UW: 25.0% down · 7.5% · 30yr · 1.5% tax · 5.0% vac · 8.0% maint · 8.0% mgmt
Financing live
Cash to close
- Down payment
- $43,750
- Closing costs
- $5,250
- Reserves months
- —
- Total cash needed
- —
Loan-product check · same deal, 3 products live
Conventional
25% down · 7.5% · 30yr
- Down + closing
- —
- Monthly P&I
- —
- Monthly cashflow
- —
- DSCR
- —
- Eligible?
- —
Personal DTI + credit; lowest rate.
DSCR
20% down · 8.5% · 30yr
- Down + closing
- —
- Monthly P&I
- —
- Monthly cashflow
- —
- DSCR
- —
- Eligible?
- —
No personal income docs; deal must DSCR.
Hard money
10% down · 12.0% · 12mo
- Down + closing
- —
- Monthly P&I
- —
- Monthly cashflow
- —
- DSCR
- —
- Eligible?
- —
Short-term bridge; refi at stabilization.
Listing history 21 events
-
2026-06-22days on market $175,000 Active 25 DOM
-
2026-06-18days on market $175,000 Active 22 DOM
-
2026-06-17days on market $175,000 Active 21 DOM
-
2026-06-16days on market $175,000 Active 20 DOM
-
2026-06-15days on market $175,000 Active 19 DOM
-
2026-06-14days on market $175,000 Active 17 DOM
-
2026-06-10days on market $175,000 Active 14 DOM
-
2026-06-09days on market $175,000 Active 13 DOM
-
2026-06-08days on market $175,000 Active 12 DOM
-
2026-06-07days on market $175,000 Active 11 DOM
-
2026-06-05days on market $175,000 Active 8 DOM
-
2026-06-03days on market $175,000 Active 7 DOM
-
2026-06-02days on market $175,000 Active 6 DOM
-
2026-06-01days on market $175,000 Active 5 DOM
-
2026-05-31days on market $175,000 Active 4 DOM
-
2026-05-30days on market $175,000 Active 3 DOM
-
2026-05-27$175,000 Active
-
2021-03-31soldstatus $400,000 Sold 502-char remark
Show marketing remark (502 chars)
2 Houses, 1 tax lot-zoned R2.MFG home with 2 car detached garage that is 1568 sq feet AND stick built home with 1 car garage that is 760 sq feet @ 370 S 6th St. Fantastic opportunity for flexible living or investment. Both homes have updates throughout. Mfg home has RV parking space. Homes have separate utility meters, parking, driveways and back yards. Yr built: Mfg home is 1995 and stick built is 1946 w/zonal heat and vinyl siding. Possible owner carry with appropriate down payment & credit.
-
2021-03-31soldstatus $400,000
Show marketing remark (502 chars)
2 Houses, 1 tax lot-zoned R2.MFG home with 2 car detached garage that is 1568 sq feet AND stick built home with 1 car garage that is 760 sq feet @ 370 S 6th St. Fantastic opportunity for flexible living or investment. Both homes have updates throughout. Mfg home has RV parking space. Homes have separate utility meters, parking, driveways and back yards. Yr built: Mfg home is 1995 and stick built is 1946 w/zonal heat and vinyl siding. Possible owner carry with appropriate down payment & credit.
-
2021-03-17status Pending 502-char remark
Show marketing remark (502 chars)
2 Houses, 1 tax lot-zoned R2.MFG home with 2 car detached garage that is 1568 sq feet AND stick built home with 1 car garage that is 760 sq feet @ 370 S 6th St. Fantastic opportunity for flexible living or investment. Both homes have updates throughout. Mfg home has RV parking space. Homes have separate utility meters, parking, driveways and back yards. Yr built: Mfg home is 1995 and stick built is 1946 w/zonal heat and vinyl siding. Possible owner carry with appropriate down payment & credit.
-
2021-03-08$399,500 Active 502-char remark
Show marketing remark (502 chars)
2 Houses, 1 tax lot-zoned R2.MFG home with 2 car detached garage that is 1568 sq feet AND stick built home with 1 car garage that is 760 sq feet @ 370 S 6th St. Fantastic opportunity for flexible living or investment. Both homes have updates throughout. Mfg home has RV parking space. Homes have separate utility meters, parking, driveways and back yards. Yr built: Mfg home is 1995 and stick built is 1946 w/zonal heat and vinyl siding. Possible owner carry with appropriate down payment & credit.
ⓘ Source: listings_history table (triggers on properties + properties_extension) + one-shot
backfill from property_details.listing_events for pre-trigger history.
Tax reassessment forecast OR · Resets to sale price
- Current annual tax
- $962 · $80/mo
- Projected year-2 tax
- $1,698 · $141/mo
- Expected delta
- +$736/yr (+$61/mo · 76.5%)
ⓘ Screening estimate from a state-policy table — verify with the county assessor before closing.
Climate risk First Street
- Flood 4/10 Moderate FEMA zone X (unshaded) · 13% chance over 30 yrs
- Wildfire 1/10 Low
- Heat 4/10 Moderate 7 d/yr ≥92°F today · 15 d/yr by 30 yrs out
- Wind 1/10 Low
- Air quality 9/10 Extreme 12 unhealthy d/yr today · 12 by 30 yrs out
Nearby sold comps map
Loading sold comps map…
Walkable amenities ~0.75 mi
Loading nearby amenities…
Taxation est. · year 1
- Rental income
- $20,522
- − Mortgage interest
- −$9,803
- − Property taxes
- −$962
- − Insurance
- −$875
- − Repairs & maintenance
- −$1,642
- − Management
- −$1,642
- − Depreciation
- −$5,091
- Taxable income
- $508
- Est. tax owed @ 24.0%
- −$122
- After-tax cash flow
- $3,241/yr
For passive investors: Depreciation is non-cash, so a rental often shows a tax loss while cash-flowing — sheltering income. Rental losses are passive: they offset passive income freely, and up to $25,000/yr can offset ordinary (W-2) income if you actively participate and your MAGI is under $100k (phasing out to $0 by $150k); unused losses carry forward. On sale, claimed depreciation is recaptured at up to 25%, and gains may owe capital-gains tax (a 1031 exchange can defer both). Figures are a year-1 estimate at your 24.0% rate — not tax advice; consult a CPA.
Schools (NCES district)
- District
- Harrisburg SD 7J
- NCES district ID
- 4100019
- Math proficiency
- 34% ▲ 1.00%
- Reading proficiency
- 40% ▼ -8.00%
- Median HH income
- $51,875
- Composite
- 34.72/100
- National rank
- #10052
- State rank
- #123 of 183 in OR
Livability — Harrisburg
- Score
- 71/100
- State rank
- #124
- US rank
- #7106
Category grades
Schools grade is shown separately in the Schools card above.
Census & demographics
- Census place
- Harrisburg, OR
- Population (ZIP)
- 4,997
Population outlook (Linn County) Hauer SSP2
- Today (2025)
- 127,026 people
- By 2030
- 129,540 · +2.0%
- By 2040
- 132,780 · +4.5%
- By 2050
- 133,614 · +5.2%
- By 2075
- 129,061 · +1.6%
- By 2100
- 112,224 · -11.7%
Race, ethnicity, and origin ACS 2023
- Neighborhood character
- Predominantly White (86%)
- Race & ethnicity
- White 86% Two or more races 11% Hispanic / Latino 6% Native American 1%
- Hispanic origin (detail)
- Mexican 4%
- Common ancestry
- Italian 4% Portuguese 3% Lithuanian 3%
- Foreign-born
- 2% · Canada, Guatemala
- Languages at home
- 98% English-only · Spanish 2%
Political lean MEDSL · Linn
- 2024 margin
- Strong R (+24.4) · D 36.2% · R 60.6% · Other 3.1%
- 2008→2024 swing
- -13.0pp toward R · 2008: -11.4pp · 2024: -24.4pp
- All cycles
- 2024: R+24.4 2020: R+23.4 2016: R+27.8 2012: R+17.2 2008: R+11.4
Not yet ingested
- Civics
- —
Market trends
- HPI YoY
- ▼ -156.45%
- Current HPI
- 211.3327
- Rent YoY
- —
- Metro
- —
- State GDP YoY
- ▲ 2.05%
- F500 in state
- 2
Industry mix (Fortune 500 HQ in OR)
| Industry | F500 HQs | Revenue |
|---|---|---|
| Consumer Goods | 1 | $51B |
|
||
Price history
-56.2% since first listed5 events — show timeline
- 2026-05-27 Listed $175,000 RMLS
- 2021-03-31 Sold (Public Records) $400,000 Public Records
- 2021-03-31 Sold (MLS) $400,000 RMLS
- 2021-03-17 Pending — RMLS
- 2021-03-08 Listed $399,500 RMLS
Property tax history
+4.0%/yrLatest (2025): $962 · +2.9% YoY. Source: county tax records.
Cash-flow waterfall
monthlySold comps — $/sqft
last 12 mo · ≤1 miLoading sold comps…