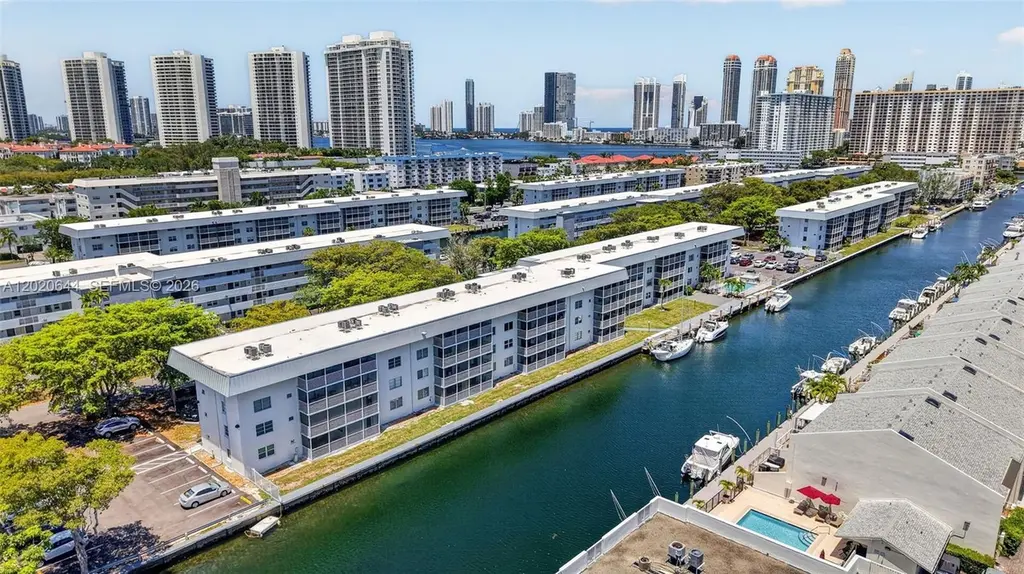
 🌊 Lakefront
3550 NE 169th St #407 · North Miami Beach, FL
Flood risk 9/10 · Severe
- FEMA flood zone
- AE
- Chance of flooding over 30 yrs
- 0.99%
- Est. flood insurance / yr
- $1,737 – $8,500
Fire risk 1/10 · Minimal
- Est. fire insurance / yr
- $947 – $1,759
Heat risk 10/10 · Severe
- Hot days now (above 103°F)
- 7 days/yr
- Hot days in 30 yrs
- 28 days/yr
Wind risk 10/10 · Severe
- Chance of severe wind over 30 yrs
- 99.0%
Air-quality risk 2/10 · Minimal
- Unhealthy air days now
- 1 days/yr
- Unhealthy air days in 30 yrs
- 2 days/yr
Risk factors via First Street. Map © Google.
Why this score? — see what drove the C+ grade
The composite is a weighted blend of 9 inputs, each scored 0–100. Each bar is that input's sub-score; the figure is the points it added to the 100-point composite (weight × sub-score).
- Cash flow +19.1/30.0
- 1% rule +8.1/10.0
- ARV discount +7.5/15.0
- DSCR +6.0/10.0
- Appreciation +5.3/10.0
- Schools +5.0/10.0
- Livability +4.1/5.0
- Rent growth +2.7/5.0
- Condition / age +2.5/5.0
$299,000
🖨 Deal sheet (PDF) 📄 Offer letter ✓ Due diligence
Listing remarks
Amazing unit in excellent condition. Ready to move in. Some new furniture included in sale. Unit features New AC unit, upgraded electrical panel, all done with permits and approved and closed with city of NMB. Spacious open kitchen and living area. Beautiful tile throughout entire unit. Large bedroom with great closet space. Upgraded bathroom. Unit on top floor with great intercoastal views. Unit easy to show. located in the highly desirable gated community of Eastern Shores. This prime location puts you just minutes from the beach, Oleta State Park, Sunny Isles, Bal Harbour, Aventura Mall, and more. The building has had major improvements, including a new roof, restored concrete balconies,
Key facts
- Tile throughout
- Upgraded bathroom
- Living area
Tags
Property features AI
Finance
- Other: Association pool
- Financial info: Pets allowed with restrictions or conditions
- HOA & community: Monthly association fee of $734; Association fee covers insurance, grounds maintenance, sewer and water; Association amenities include a fitness center and a pool; Senior community
Exterior
- Parking: One designated parking space
- Utilities: Cooling: Central Air
- Home design: 4-story building; Resale property; Attached property; Entry on level 4
- Construction: Block construction
- Exterior features: No notable exterior features listed; Intracoastal access waterfront
Interior
- Flooring: Tile
- Bathrooms: 2 full bathrooms
- Heating & cooling: Central Air conditioning
- Interior features: Tile flooring; Other interior features
Neighborhood map
What this means for you Summary
Snapshot
- This is a 2-bed/2.0-bath condo listed at $299k.
Deal economics
- At list price, monthly cash flow is $-107 ($-1k/yr) — negative.
- To cash-flow at today's rent, offer at most $280k (6.3% below list).
- Meets the 1% rule at list price ($4k rent vs $299k).
- Recommended offer: $280k (6.3% below list) — sets the bar for cash-flow.
- Cap rate 7.6% vs local median 5.2% in North Miami Beach — top-decile yield for the area; either an underpriced asset or a hidden risk that comps aren't pricing in. Stress-test before assuming the spread holds.
Location & tenants
- Location reads 82/100 on livability (#71 in FL, #1,177 nationally) — a professional / high-income tenant draw. Strengths: commute A+, housing A+, health & safety A+; Watch: employment D+, crime F.
- Zoned schools: Ojus Elementary School (math 56% / reading 59%, grade C+, #764 of 2,144 statewide, top 36%, 776 students, 63% FRL); Highland Oaks Middle School (math 28% / reading 51%, grade F, #373 of 571 statewide, top 66%, 774 students, 50% FRL); Alonzo & Tracy Mourning Senior High School (math 38% / reading 50%, grade F, #244 of 667 statewide, top 37%, 1,597 students, 48% FRL).
- Market conditions: Rents flat; 1879 active listings in the ZIP; 1 comparable units currently listed for rent nearby; 10,051 units permitted in Miami-Dade County in 2024 (7,758 in 5+ unit buildings).
- At $3,926/mo this rent would consume 70% of the median local household income ($67k/yr) (locally 3106% of renters already pay >50% of income on rent) — very limited rent-growth headroom before tenants either downsize or default.
Forward outlook
- In year one you build about $4k of equity ($2k loan paydown + $2k appreciation (0.5% local appreciation)).
- Miami-Dade County population projected at +28% by 2050 — long-run rental-demand tailwind backs the buy-and-hold thesis.
- By year 8, paydown + projected appreciation supports a ~$31k cash-out refi (75% LTV) — recoverable capital for the next deal without selling this one.
Negotiation context
- It's been on market 34 days — a 3% lower offer ($290k) is reasonable based on typical stale-listing flexibility.
- 11 sale attempts since 12y ago with the ask held roughly flat each time — persistent listings suggest the price (not the market) is what's stuck; bring a comps-based counter.
- Current owner paid $192k; list at $299k implies a 56% gain — meaningful room to come down on a strong offer.
Risks & watch-outs
- Watch-outs: flood insurance adds $427/mo.
- Climate carrying-cost: in FEMA flood zone AE (mandatory federal flood insurance); severe wind risk, 99% chance of damaging wind over 30y; extreme-heat days projected 7→28/yr by 2055 (HVAC capex compounding) — expect insurance premiums to compound above CPI over the hold.
Questions for the listing agent
- What do current leases actually rent for vs. the listed asking? Can we see a recent rent roll and the last 12 months of T-12 income?
- It's been on market 34 days. Have you received any prior offers? Is the seller open to a 6% concession, seller financing, or rate buy-down credit?
- Built in 1972 — when were the roof, HVAC, electrical panel, plumbing, and water heater last replaced?
- What's the actual annual flood-insurance premium (NFIP or private), and is the property in a SFHA with mandatory coverage?
- What does the HOA fee cover, when was the last increase, and are there any pending special assessments or reserve-fund shortfalls?
- Any open or pending special assessments — roof, HVAC, plumbing, elevator, façade? What's the per-unit balance and payoff schedule, and is the seller paying it off at close or rolling it to the buyer?
- Is there a deadline driving the sale (1031 exchange, divorce, estate, relocation)? That informs how much negotiation room exists.
- Crime grade is F in this area — have there been break-ins, vandalism, or insurance claims at this property in the last 3 years? What carrier currently insures it and at what premium?
- This sits on a lake — are riparian / water-frontage rights deeded with the parcel? Any dock permits, shoreline easements, or HOA water-use restrictions?
- What's the documented flood / surge / shoreline-erosion history here (FEMA AND non-FEMA — e.g., storm surge, creek backup, septic-field saturation)?
- Any water-quality or seasonal algae-bloom issues that affect tenant satisfaction or short-term-rental demand?
- What's the average days-on-market for RENTAL listings here right now (not sales)? A rising rental-DOM trend means longer vacancies and softer asking-rent achievability than the comps imply.
- What's the recent tenant-quality profile in this submarket — average credit score on applications, eviction rate, late-payment / NSF rate, and stable-employment percentage? A property-management company in the area should have these aggregated.
- How much new apartment / multifamily construction is in the pipeline within 1–3 miles? Heavy new supply (>2% of stock underway) typically softens rents 12–24 months out; light construction supports rent growth.
Investment metrics
- 1% rule
- 1.31% ✓
- Cap rate
- 7.58%
- Cash-on-cash
- 4.58%
- DSCR
- 1.20
- GRM
- 6.3
CMA / ARV
No comps found within radius.
Projected returns pro-forma
0.53% appreciation · 0.94% rent growth · sell at horizon
- IRR
- -3.8%
- Equity multiple
- 0.82×
- Total profit
- $-15,291
- Equity at exit
- $94,781
- IRR
- -0.3%
- Equity multiple
- 0.97×
- Total profit
- $-2,518
- Equity at exit
- $120,495
Cash invested: $83,720 (down + closing). Projections, not guarantees.
Landlord ↔ Tenant lean methodology
- Overall (STATE)
- 87 Strongly Landlord-Friendly
- State Florida
- 87 Strongly Landlord-Friendly · R+3
- County
- — inherits STATE
- City
- — inherits STATE
ZIP-level market 33160
- Home prices YoY
- 0.2%
- Rents YoY
- 0.9%
- Active inventory
- 1879
- Price-to-rent
- 6.3×
Monthly cashflow live
- Estimated rent
- $3,926 medium interval (Pro) →
- Mortgage (P&I)
- −$1,568
- Tax from tax record
- −$356 /mo · $4,266/yr
- Insurance
- −$125
- Flood insurance flood zone
- −$427 /mo · $5,118/yr
- HOA
- −$734
- Vacancy / Maint / Mgmt
- −$824
- Net cashflow
- $-107
Break-even live
Sensitivity live
| Price | -10% $62 | -5% $-22 | +0% $-107 | +5% $-192 | +10% $-276 |
|---|---|---|---|---|---|
| Rent | -10% $-417 | -5% $-262 | +0% $-107 | +5% $48 | +10% $203 |
| Rate | -1.0pp $44 | -0.5pp $-31 | base $-107 | +0.5pp $-184 | +1.0pp $-263 |
UW: 25.0% down · 7.5% · 30yr · 1.5% tax · 5.0% vac · 8.0% maint · 8.0% mgmt
Financing live
Cash to close
- Down payment
- $74,750
- Closing costs
- $8,970
- Reserves months
- —
- Total cash needed
- —
Loan-product check · same deal, 3 products live
Conventional
25% down · 7.5% · 30yr
- Down + closing
- —
- Monthly P&I
- —
- Monthly cashflow
- —
- DSCR
- —
- Eligible?
- —
Personal DTI + credit; lowest rate.
DSCR
20% down · 8.5% · 30yr
- Down + closing
- —
- Monthly P&I
- —
- Monthly cashflow
- —
- DSCR
- —
- Eligible?
- —
No personal income docs; deal must DSCR.
Hard money
10% down · 12.0% · 12mo
- Down + closing
- —
- Monthly P&I
- —
- Monthly cashflow
- —
- DSCR
- —
- Eligible?
- —
Short-term bridge; refi at stabilization.
Rent comps 1 comps
| Address | Beds | Baths | Sqft | Rent | $/sqft | DOM | Units | Dist |
|---|---|---|---|---|---|---|---|---|
| 15701 Collins Ave Sunny Isles Beach, FL | 2.0–4.0 | 2.5–5.5 | 2325 | $18,000 | $7.74 | 4d | 9 | 1.32mi |
HOA detail condo
- Monthly dues
- $734 · $8,808/yr
- Likely covers
- electricsecurity
- Assessments
- None detected in remarks — confirm with the listing agent.
Listing history 39 events
-
2026-06-21days on market $299,000 Active 34 DOM
-
2026-06-18days on market $299,000 Active 31 DOM
-
2026-06-17days on market $299,000 Active 30 DOM
-
2026-06-16days on market $299,000 Active 29 DOM
-
2026-06-15days on market $299,000 Active 28 DOM
-
2026-06-13days on market $299,000 Active 26 DOM
-
2026-06-09days on market $299,000 Active 22 DOM
-
2026-06-08days on market $299,000 Active 21 DOM
-
2026-06-07days on market $299,000 Active 20 DOM
-
2026-06-04days on market $299,000 Active 17 DOM
-
2026-06-03days on market $299,000 Active 16 DOM
-
2026-06-02days on market $299,000 Active 15 DOM
-
2026-06-01days on market $299,000 Active 14 DOM
-
2026-05-31days on market $299,000 Active 13 DOM
-
2026-05-17$299,000 Active
-
2023-12-07historical
-
2023-12-04status Active
-
2023-09-06status Active
-
2023-02-25historical
-
2022-10-29status Active
-
2022-10-22$290,000 Active
-
2022-09-12historical Active Under Contract
-
2022-08-22status Active
-
2022-08-22price $290,000
-
2022-08-12historical Active Under Contract
-
2022-05-11status Active
-
2022-05-05historical Active Under Contract
-
2022-04-25$310,000 Active
-
2021-05-03$229,000 Active
-
2020-07-15soldstatus $192,000
-
2020-07-10soldstatus $192,000
-
2020-03-06$195,000
-
2015-02-03soldstatus $160,000 Sold
-
2014-10-29soldstatus $160,000
-
2014-09-17status Pending
-
2014-08-27price $169,000
-
2014-08-14$175,000 Active
-
1999-07-28soldstatus $55,000
-
1992-07-22soldstatus $42,500
ⓘ Source: listings_history table (triggers on properties + properties_extension) + one-shot
backfill from property_details.listing_events for pre-trigger history.
Tax reassessment forecast FL · Resets to sale price
- Current annual tax
- $4,266 · $356/mo
- Projected year-2 tax
- $4,266 · $356/mo
- Expected delta
- $0/yr ($0/mo · 0.0%)
ⓘ Screening estimate from a state-policy table — verify with the county assessor before closing.
Climate risk First Street
- Flood 9/10 Extreme FEMA zone AE · 99% chance over 30 yrs
- Wildfire 1/10 Low
- Heat 10/10 Extreme 7 d/yr ≥103°F today · 28 d/yr by 30 yrs out
- Wind 10/10 Extreme 99% chance of damaging wind over 30 yrs
- Air quality 2/10 Low 1 unhealthy d/yr today · 2 by 30 yrs out
Nearby sold comps map
Loading sold comps map…
Walkable amenities ~0.75 mi
Loading nearby amenities…
Taxation est. · year 1
- Rental income
- $47,113
- − Mortgage interest
- −$16,749
- − Property taxes
- −$4,266
- − Insurance
- −$6,614
- − Repairs & maintenance
- −$3,769
- − Management
- −$3,769
- − HOA
- −$8,808
- − Depreciation
- −$8,698
- Taxable loss
- −$5,559
- Est. tax savings @ 24.0%
- +$1,334
- After-tax cash flow
- $50/yr
For passive investors: Depreciation is non-cash, so a rental often shows a tax loss while cash-flowing — sheltering income. Rental losses are passive: they offset passive income freely, and up to $25,000/yr can offset ordinary (W-2) income if you actively participate and your MAGI is under $100k (phasing out to $0 by $150k); unused losses carry forward. On sale, claimed depreciation is recaptured at up to 25%, and gains may owe capital-gains tax (a 1031 exchange can defer both). Figures are a year-1 estimate at your 24.0% rate — not tax advice; consult a CPA.
Schools (NCES district)
No district data.
Livability — North Miami Beach
- Score
- 82/100
- State rank
- #71
- US rank
- #1177
Category grades
Schools grade is shown separately in the Schools card above.
Census & demographics
- Census place
- North Miami Beach, FL
- County
- Miami-Dade County · 2,697,751 people
- City population
- 90,324
- Metro
- Miami-Fort Lauderdale-Pompano Beach, FL
- Population (ZIP)
- 43,718
- Household income
- $67,040
- Rent vs Own
- Severe rent burden
- 3106.0
Population outlook (Miami-Dade County) Hauer SSP2
- Today (2025)
- 3,126,439 people
- By 2030
- 3,325,765 · +6.4%
- By 2040
- 3,697,561 · +18.3%
- By 2050
- 4,012,134 · +28.3%
- By 2075
- 4,605,612 · +47.3%
- By 2100
- 4,866,598 · +55.7%
Race, ethnicity, and origin ACS 2023
- Neighborhood character
- Diverse neighborhood (Simpson 0.59)
- Race & ethnicity
- Hispanic / Latino 46% White 44% Two or more races 27% Black 4% Asian 2%
- Hispanic origin (detail)
- Mexican 1% Puerto Rican 3% Cuban 8% Dominican 1% Salvadoran 4%
- Common ancestry
- Scotch-Irish 8% Hispanic 3% Subsaharan African 3%
- Foreign-born
- 61% · Canada, Jamaica, Dominican Republic
- Languages at home
- 29% English-only · Spanish 45% Russian/Polish/Slavic 12% Other Indo-European 5%
Political lean MEDSL · Miami-Dade
- 2024 margin
- R (+11.4) · D 43.9% · R 55.4%
- 2008→2024 swing
- -27.6pp toward R · 2008: 16.1pp · 2024: -11.4pp
- All cycles
- 2024: R+11.4 2020: D+7.3 2016: D+29.6 2012: D+23.7 2008: D+16.1
Not yet ingested
- Civics
- —
Market trends
- HPI YoY
- ▲ 0.53%
- Current HPI
- 284.9293
- Rent YoY
- ▲ 0.94%
- Metro
- Miami-Fort Lauderdale-Pompano Beach, FL
- State GDP YoY
- ▲ 3.28%
- F500 in state
- 36
Industry mix (Fortune 500 HQ in FL)
| Industry | F500 HQs | Revenue |
|---|---|---|
| Industrial Technology | 2 | $29B |
|
||
| Insurance | 2 | $17B |
|
||
| Retail | 1 | $60B |
|
||
| Technology Distribution | 1 | $58B |
|
||
| Homebuilding | 1 | $35B |
|
||
| Technology Manufacturing | 1 | $35B |
|
||
Price history
+603.5% since first listed25 events — show timeline
- 2026-05-17 Listed $299,000 MARMLS
- 2023-12-07 Listing Removed — MARMLS
- 2023-12-04 Relisted — MARMLS
- 2023-09-06 Relisted — MARMLS
- 2023-02-25 Listing Removed — MARMLS
- 2022-10-29 Relisted — MARMLS
- 2022-10-22 Listed $290,000 MARMLS
- 2022-09-12 Contingent — MARMLS
- 2022-08-22 Relisted — MARMLS
- 2022-08-22 Price Changed $290,000 MARMLS
- 2022-08-12 Contingent — MARMLS
- 2022-05-11 Relisted — MARMLS
- 2022-05-05 Contingent — MARMLS
- 2022-04-25 Listed $310,000 MARMLS
- 2021-05-03 Listed $229,000 MARMLS
- 2020-07-15 Sold (Public Records) $192,000 Public Records
- 2020-07-10 Sold (MLS) $192,000 Beaches MLS
- 2020-03-06 Listed $195,000 Beaches MLS
- 2015-02-03 Sold (MLS) $160,000 MARMLS
- 2014-10-29 Sold (Public Records) $160,000 Public Records
- 2014-09-17 Pending — MARMLS
- 2014-08-27 Price Changed $169,000 MARMLS
- 2014-08-14 Listed $175,000 MARMLS
- 1999-07-28 Sold (Public Records) $55,000 Public Records
- 1992-07-22 Sold (Public Records) $42,500 Public Records
Property tax history
+12.7%/yrLatest (2025): $4,266 · +4.7% YoY. Source: county tax records.
Cash-flow waterfall
monthlySold comps — $/sqft
last 12 mo · ≤1 miLoading sold comps…