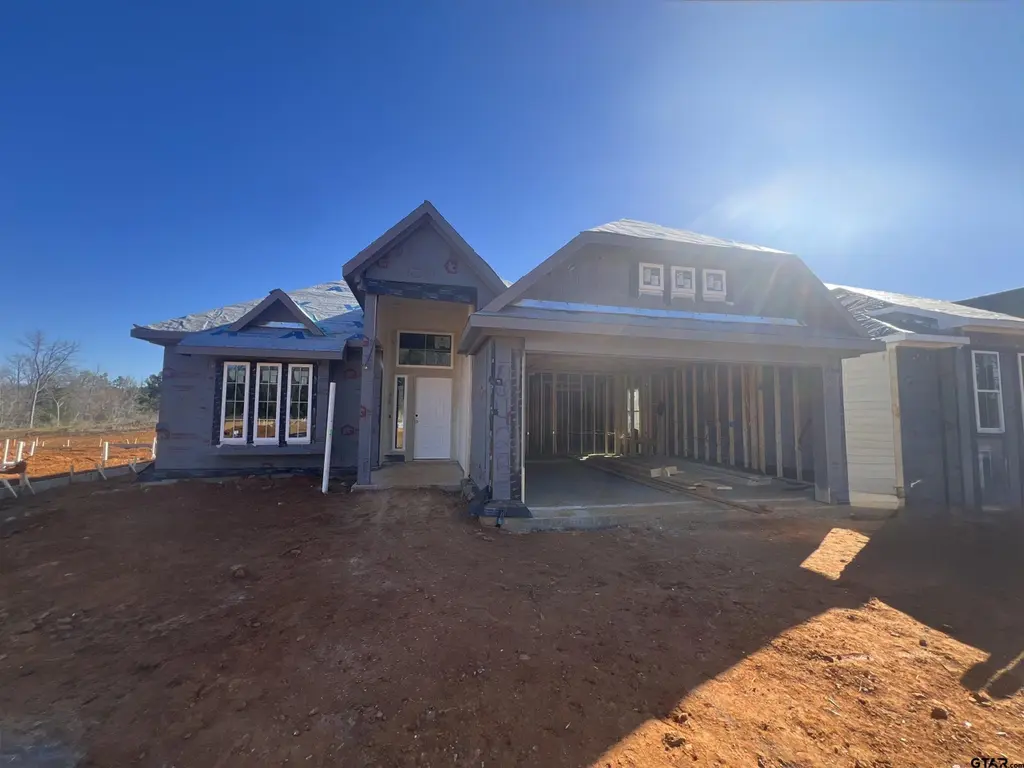
6423 Wellington Oak Ave · Tyler, TX
Flood risk No data
- FEMA flood zone
- —
- Chance of flooding over 30 yrs
- —
- Est. flood insurance / yr
- —
Fire risk No data
- Est. fire insurance / yr
- —
Heat risk No data
- Hot days now (above threshold)
- —
- Hot days in 30 yrs
- —
Wind risk No data
- Chance of severe wind over 30 yrs
- —
Air-quality risk No data
- Unhealthy air days now
- —
- Unhealthy air days in 30 yrs
- —
Risk factors via First Street. Map © Google.
Why this score? — see what drove the D grade
The composite is a weighted blend of 9 inputs, each scored 0–100. Each bar is that input's sub-score; the figure is the points it added to the 100-point composite (weight × sub-score).
- ARV discount +13.2/15.0
- Appreciation +8.4/10.0
- Schools +5.9/10.0
- Cash flow +4.3/30.0
- Livability +3.8/5.0
- Rent growth +2.5/5.0
- Condition / age +2.5/5.0
- 1% rule +0.5/10.0
- DSCR +0.0/10.0
$299,900
🖨 Deal sheet (PDF) 📄 Offer letter ✓ Due diligence
Listing remarks MLS
This beauty is luxury living with three bedrooms and two baths. This beautiful home features large secondary bedrooms with walk-in closets. Open living, dining, and kitchen provides abundant space without all the cost. The primary bedroom suite is fit for a king sized bed and features a large walk-in closet.
Key facts
- 2 garage spots
- Built 2026
- Listed 125 days
Neighborhood map
What this means for you Summary
Snapshot
- This is a 3-bed/2.0-bath other listed at $300k.
Deal economics
- At list price, monthly cash flow is $-794 ($-10k/yr) — negative.
- To cash-flow at today's rent, offer at most $185k (38.3% below list).
- To meet the 1% rule (rent ≥ 1% of price), the offer needs to be $165k (45.1% below list).
- Recommended offer: $165k (45.1% below list) — sets the bar for 1% rule.
Location & tenants
- Location reads 75/100 on livability (#147 in TX, #4,181 nationally) — a middle-class / working-renter tenant base. Strengths: cost of living A+, housing A+, health & safety A+; Watch: employment C-, crime D+, commute F.
- Lindale ISD (town): math 71% / reading 66% proficiency, ranked #20 of 826 in TX (top 2%) — acceptable for families but not a draw, mixed tenant base, ~2y average lease.
- Zoned schools: Velma Penny El (math 67% / reading 67%, grade B+, #199 of 4,322 statewide, top 5%, 541 students, 48% FRL); E J Moss Int (math 66% / reading 59%, grade B+, #128 of 1,662 statewide, top 8%, 981 students, 45% FRL); Lindale H S (math 79% / reading 75%, grade A-, #60 of 1,632 statewide, top 4%, 1,265 students, 38% FRL).
- Market conditions: 110 active listings in the ZIP; 595 units permitted in Smith County in 2024 (45 in 5+ unit buildings).
Forward outlook
- In year one you build about $22k of equity ($2k loan paydown + $20k appreciation (6.7% local appreciation)).
- Smith County population projected at +24% by 2050 — long-run rental-demand tailwind backs the buy-and-hold thesis.
- By year 2, paydown + projected appreciation supports a ~$36k cash-out refi (75% LTV) — recoverable capital for the next deal without selling this one.
Negotiation context
- It's been on market 125 days — a 12% lower offer ($264k) is reasonable based on typical stale-listing flexibility.
- 2 sale attempts with the ask held roughly flat each time — persistent listings suggest the price (not the market) is what's stuck; bring a comps-based counter.
Questions for the listing agent
- What do current leases actually rent for vs. the listed asking? Can we see a recent rent roll and the last 12 months of T-12 income?
- It's been on market 125 days. Have you received any prior offers? Is the seller open to a 45% concession, seller financing, or rate buy-down credit?
- What does the HOA fee cover, when was the last increase, and are there any pending special assessments or reserve-fund shortfalls?
- Why hasn't it sold? Are there any deal-killer items the seller is aware of (foundation, flood, title, zoning, code violations)?
- Is there a deadline driving the sale (1031 exchange, divorce, estate, relocation)? That informs how much negotiation room exists.
- Schools are D-rated, which usually means shorter tenancies and higher turnover. Who's the typical renter profile here, and what's been the actual vacancy rate?
- Crime grade is D in this area — have there been break-ins, vandalism, or insurance claims at this property in the last 3 years? What carrier currently insures it and at what premium?
- The area grade is low — what's the realistic commute time and amenity access for the typical tenant pool here? Any planned neighborhood developments (good or bad) we should know about?
- What's the average days-on-market for RENTAL listings here right now (not sales)? A rising rental-DOM trend means longer vacancies and softer asking-rent achievability than the comps imply.
- What's the recent tenant-quality profile in this submarket — average credit score on applications, eviction rate, late-payment / NSF rate, and stable-employment percentage? A property-management company in the area should have these aggregated.
- How much new for-sale + rental construction is in the pipeline within 1–3 miles? Heavy new supply typically softens prices + rents 12–24 months out; constrained supply supports both.
Investment metrics
- 1% rule
- 0.55% ✗
- Cap rate
- 3.12%
- Cash-on-cash
- -11.34%
- DSCR
- 0.50
- GRM
- 15.2
CMA / ARV
- ARV (median comp)
- $343,654
- List price
- $299,900
- Delta
- -12.73%
- Verdict
- UNDERPRICED
- Comps
- 5 within 1.0 mi
Projected returns pro-forma
6.72% appreciation · 3.0% rent growth · sell at horizon
- IRR
- 8.2%
- Equity multiple
- 1.58×
- Total profit
- $49,013
- Equity at exit
- $202,286
- IRR
- 9.8%
- Equity multiple
- 3.16×
- Total profit
- $180,978
- Equity at exit
- $379,338
Cash invested: $83,972 (down + closing). Projections, not guarantees.
Landlord ↔ Tenant lean methodology
- Overall (STATE)
- 87 Strongly Landlord-Friendly
- State Texas
- 87 Strongly Landlord-Friendly · R+5
- County
- — inherits STATE
- City
- — inherits STATE
ZIP-level market 75706
- Home prices YoY
- 2.9%
- Active inventory
- 110
- Price-to-rent
- 15.2×
Monthly cashflow live
- Estimated rent
- $1,646 medium interval (Pro) →
- Mortgage (P&I)
- −$1,573
- Tax est. 1.5%
- −$375 /mo · $4,498/yr
- Insurance
- −$125
- HOA
- −$21
- Vacancy / Maint / Mgmt
- −$346
- Net cashflow
- $-794
Break-even live
Sensitivity live
| Price | -10% $-586 | -5% $-690 | +0% $-794 | +5% $-897 | +10% $-1,001 |
|---|---|---|---|---|---|
| Rent | -10% $-924 | -5% $-859 | +0% $-794 | +5% $-729 | +10% $-664 |
| Rate | -1.0pp $-643 | -0.5pp $-717 | base $-794 | +0.5pp $-871 | +1.0pp $-950 |
UW: 25.0% down · 7.5% · 30yr · 1.5% tax · 5.0% vac · 8.0% maint · 8.0% mgmt
Financing live
Cash to close
- Down payment
- $74,975
- Closing costs
- $8,997
- Reserves months
- —
- Total cash needed
- —
Loan-product check · same deal, 3 products live
Conventional
25% down · 7.5% · 30yr
- Down + closing
- —
- Monthly P&I
- —
- Monthly cashflow
- —
- DSCR
- —
- Eligible?
- —
Personal DTI + credit; lowest rate.
DSCR
20% down · 8.5% · 30yr
- Down + closing
- —
- Monthly P&I
- —
- Monthly cashflow
- —
- DSCR
- —
- Eligible?
- —
No personal income docs; deal must DSCR.
Hard money
10% down · 12.0% · 12mo
- Down + closing
- —
- Monthly P&I
- —
- Monthly cashflow
- —
- DSCR
- —
- Eligible?
- —
Short-term bridge; refi at stabilization.
HOA detail
- Monthly dues
- $21 · $252/yr
Listing history 21 events
-
2026-06-22days on market $299,900 Active 125 DOM
-
2026-06-19days on market $299,900 Active 123 DOM
-
2026-06-18days on market $299,900 Active 122 DOM
-
2026-06-17days on market $299,900 Active 121 DOM
-
2026-06-16days on market $299,900 Active 120 DOM
-
2026-06-15days on market $299,900 Active 119 DOM
-
2026-06-14days on market $299,900 Active 117 DOM
-
2026-06-13days on market $299,900 Active 116 DOM
-
2026-06-10days on market $299,900 Active 114 DOM
-
2026-06-09days on market $299,900 Active 113 DOM
-
2026-06-08days on market $299,900 Active 112 DOM
-
2026-06-07days on market $299,900 Active 111 DOM
-
2026-06-03days on market $299,900 Active 107 DOM
-
2026-06-02days on market $299,900 Active 106 DOM
-
2026-06-01days on market $299,900 Active 105 DOM
-
2026-05-31days on market $299,900 Active 104 DOM
-
2026-05-30days on market $299,900 Active 103 DOM
-
2026-02-16$299,900 Active 309-char remark
Show marketing remark (309 chars)
This beauty is luxury living with three bedrooms and two baths. This beautiful home features large secondary bedrooms with walk-in closets. Open living, dining, and kitchen provides abundant space without all the cost. The primary bedroom suite is fit for a king sized bed and features a large walk-in closet.
-
2026-01-31price $299,900 870-char remark
Show marketing remark (870 chars)
Some images shown may be from a previously built Stylecraft home of similar design. Actual options, colors, and selections may vary. Contact us for details! Our most popular floor plan! This charming 3 bedroom, 2 bath home is known for its intelligent use of space and now features an even more open living area. The large kitchen granite-topped island opens up to your living room to provide a cozy flow throughout the home. Your dining room features the most charming front window you'll ever see, which is accented by your gorgeous front elevation. Featuring large walk-in closets, luxury flooring, and volume ceilings - the 1613 certainly delivers when it comes to affordable luxury. Additional Options Included: Stainless Steel Appliances, A Single Basin Sink it Kitchen, A Decorative Tile Backsplash, and A Walk-In Shower with Tile Walls, Tile Floor & Bench.
-
2025-11-22price $309,900 870-char remark
Show marketing remark (870 chars)
Some images shown may be from a previously built Stylecraft home of similar design. Actual options, colors, and selections may vary. Contact us for details! Our most popular floor plan! This charming 3 bedroom, 2 bath home is known for its intelligent use of space and now features an even more open living area. The large kitchen granite-topped island opens up to your living room to provide a cozy flow throughout the home. Your dining room features the most charming front window you'll ever see, which is accented by your gorgeous front elevation. Featuring large walk-in closets, luxury flooring, and volume ceilings - the 1613 certainly delivers when it comes to affordable luxury. Additional Options Included: Stainless Steel Appliances, A Single Basin Sink it Kitchen, A Decorative Tile Backsplash, and A Walk-In Shower with Tile Walls, Tile Floor & Bench.
-
2025-10-23$308,100 Active 870-char remark
Show marketing remark (870 chars)
Some images shown may be from a previously built Stylecraft home of similar design. Actual options, colors, and selections may vary. Contact us for details! Our most popular floor plan! This charming 3 bedroom, 2 bath home is known for its intelligent use of space and now features an even more open living area. The large kitchen granite-topped island opens up to your living room to provide a cozy flow throughout the home. Your dining room features the most charming front window you'll ever see, which is accented by your gorgeous front elevation. Featuring large walk-in closets, luxury flooring, and volume ceilings - the 1613 certainly delivers when it comes to affordable luxury. Additional Options Included: Stainless Steel Appliances, A Single Basin Sink it Kitchen, A Decorative Tile Backsplash, and A Walk-In Shower with Tile Walls, Tile Floor & Bench.
ⓘ Source: listings_history table (triggers on properties + properties_extension) + one-shot
backfill from property_details.listing_events for pre-trigger history.
Nearby sold comps map
Loading sold comps map…
Walkable amenities ~0.75 mi
Loading nearby amenities…
Taxation est. · year 1
- Rental income
- $19,746
- − Mortgage interest
- −$16,799
- − Property taxes
- −$4,498
- − Insurance
- −$1,500
- − Repairs & maintenance
- −$1,580
- − Management
- −$1,580
- − HOA
- −$252
- − Depreciation
- −$8,724
- Taxable loss
- −$15,187
- Est. tax savings @ 24.0%
- +$3,645
- After-tax cash flow
- $-5,878/yr
For passive investors: Depreciation is non-cash, so a rental often shows a tax loss while cash-flowing — sheltering income. Rental losses are passive: they offset passive income freely, and up to $25,000/yr can offset ordinary (W-2) income if you actively participate and your MAGI is under $100k (phasing out to $0 by $150k); unused losses carry forward. On sale, claimed depreciation is recaptured at up to 25%, and gains may owe capital-gains tax (a 1031 exchange can defer both). Figures are a year-1 estimate at your 24.0% rate — not tax advice; consult a CPA.
Schools (NCES district)
- District
- Lindale ISD
- NCES district ID
- 4827510
- Math proficiency
- 71% ▼ -2.00%
- Reading proficiency
- 66% ▲ 4.00%
- Median HH income
- $57,325
- Composite
- 58.85/100
- National rank
- #974
- State rank
- #20 of 826 in TX
Livability — Tyler
- Score
- 75/100
- State rank
- #147
- US rank
- #4181
Category grades
Schools grade is shown separately in the Schools card above.
Census & demographics
- City population
- 127,842
- Population (ZIP)
- 10,975
Population outlook (Smith County) Hauer SSP2
- Today (2025)
- 248,890 people
- By 2030
- 261,665 · +5.1%
- By 2040
- 286,114 · +15.0%
- By 2050
- 308,006 · +23.8%
- By 2075
- 354,171 · +42.3%
- By 2100
- 372,828 · +49.8%
Race, ethnicity, and origin ACS 2023
- Neighborhood character
- Diverse neighborhood (Simpson 0.63)
- Race & ethnicity
- White 43% Hispanic / Latino 40% Black 14% Two or more races 13%
- Hispanic origin (detail)
- Mexican 38%
- Common ancestry
- Slovak 3% Lithuanian 2% Serbian 1%
- Foreign-born
- 13% · Canada
- Languages at home
- 68% English-only · Spanish 31% Tagalog/Filipino 1%
Political lean MEDSL · Smith
- 2024 margin
- Solid R (+45.1) · D 27.0% · R 72.1%
- 2008→2024 swing
- -5.6pp toward R · 2008: -39.5pp · 2024: -45.1pp
- All cycles
- 2024: R+45.1 2020: R+39.4 2016: R+43.9 2012: R+46.9 2008: R+39.5
Not yet ingested
- Civics
- —
Market trends
- HPI YoY
- ▲ 6.72%
- Current HPI
- 234.9412
- Rent YoY
- —
- Metro
- —
- State GDP YoY
- ▲ 3.95%
- F500 in state
- 110
Industry mix (Fortune 500 HQ in TX)
| Industry | F500 HQs | Revenue |
|---|---|---|
| Energy | 16 | $1,198B |
|
||
| Technology | 5 | $198B |
|
||
| Engineering / Construction | 4 | $72B |
|
||
| Energy Services | 3 | $60B |
|
||
| Utilities | 3 | $41B |
|
||
| Healthcare | 2 | $330B |
|
||
Price history
-2.7% since first listed4 events — show timeline
- 2026-02-16 Listed $299,900 GTAR
- 2026-01-31 Price Changed $299,900 Zillow
- 2025-11-22 Price Changed $309,900 Zillow
- 2025-10-23 Listed $308,100 Zillow
Cash-flow waterfall
monthlySold comps — $/sqft
last 12 mo · ≤1 miLoading sold comps…