2416 Flicker Pl #7 · West Melbourne, FL
Flood risk 1/10 · Minimal
- FEMA flood zone
- X (unshaded)
- Chance of flooding over 30 yrs
- 0.0%
- Est. flood insurance / yr
- $507 – $1,088
Fire risk 2/10 · Minimal
- Est. fire insurance / yr
- $947 – $1,759
Heat risk 10/10 · Severe
- Hot days now (above 106°F)
- 7 days/yr
- Hot days in 30 yrs
- 23 days/yr
Wind risk 10/10 · Severe
- Chance of severe wind over 30 yrs
- 99.0%
Air-quality risk 1/10 · Minimal
- Unhealthy air days now
- 0 days/yr
- Unhealthy air days in 30 yrs
- 0 days/yr
Risk factors via First Street. Map © Google.
Why this score? — see what drove the B grade
The composite is a weighted blend of 9 inputs, each scored 0–100. Each bar is that input's sub-score; the figure is the points it added to the 100-point composite (weight × sub-score).
- Cash flow +30.0/30.0
- 1% rule +10.0/10.0
- DSCR +10.0/10.0
- ARV discount +7.5/15.0
- Schools +4.7/10.0
- Livability +4.1/5.0
- Condition / age +2.5/5.0
- Rent growth +2.4/5.0
- Appreciation +0.0/10.0
$130,000
🖨 Deal sheet 📄 Offer letter ✓ Due diligence
Listing remarks
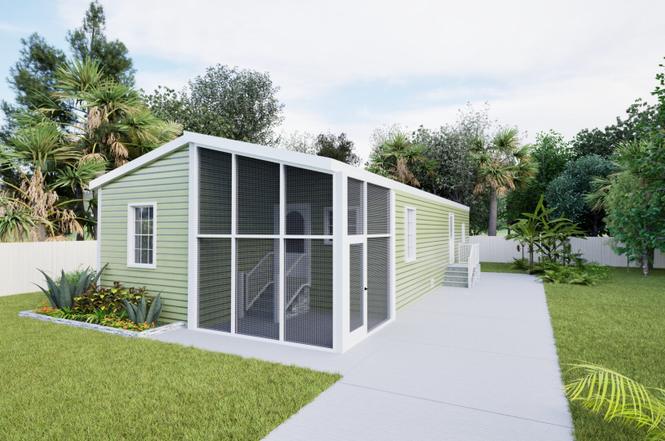
Introducing The Heron, a brand-new 2026 home designed for effortless living. This stunning 2-bedroom, 2-bath layout offers 1,344 sq. ft. of bright, open space with stylish olive exterior siding. Inside, enjoy stainless steel appliances, walk-in closets, a tile master shower, and recessed lighting throughout. Stay cool with ceiling fans, relax in your 10' x 12' screen room, and appreciate the easy-care landscaping already in place. A beautiful option for anyone seeking a fresh start in a welcoming community-this home is move-in ready and built for comfort.
Key facts
- Screen room
- Tile master shower
- Ceiling fans
Tags
Property features AI
Finance
- Other: Address: 2416 Flicker Pl #7, Melbourne, FL 32904; Status: Active
- Financial info: List price $130,000
Exterior
- Utilities: Forced Air heating
- Home design: Spec new construction — Plan named The Heron
- Construction: New construction (Spec), listed 2026
- Exterior features: Living area of 1,344 (interior measurement)
Interior
- Bedrooms: 2 bedrooms
- Bathrooms: 2 bathrooms
- Interior features: Forced Air heating
Neighborhood map
What this means for you Summary
Snapshot
- This is a 2-bed/2.0-bath manufactured listed at $130k.
Deal economics
- At list price, monthly cash flow is $720 ($9k/yr) — positive.
- The deal already cash-flows at list — no discount required.
- Meets the 1% rule at list price ($2k rent vs $130k).
- Recommended offer: $118k (9.0% below list) — sets the bar for market timing.
Location & tenants
- Location reads 82/100 on livability (#73 in FL, #1,214 nationally) — a professional / high-income tenant draw. Strengths: employment A+, housing A+, schools A; Watch: commute D+, amenities F.
- Brevard (suburban): math 53% / reading 57% proficiency, ranked #19 of 73 in FL (top 26%) — acceptable for families but not a draw, mixed tenant base, ~2y average lease.
- Market conditions: Rents soft (-0.3%/yr); 304 active listings in the ZIP; 13 comparable units currently listed for rent nearby; rentals at typical pace (median 24d on market — plan ~3-4 weeks tenant-placement turnaround); solid renter incomes; 4,602 units permitted in Brevard County in 2024 (702 in 5+ unit buildings).
Forward outlook
- Local home prices are declining (-3.0%/yr); year-one equity from $899 of loan paydown is wiped out by about $4k of value loss. Plan a longer hold.
- Brevard County population projected at +15% by 2050 — modest demand growth; plan on rents tracking national, not racing it.
- At projected returns (-3.0% appreciation + 0.0% rent growth), your $36k cash investment doubles in ~7 years — after that, you're playing with house money.
Negotiation context
- It's been on market 107 days — a 9% lower offer ($118k) is reasonable based on typical stale-listing flexibility.
Risks & watch-outs
- Climate carrying-cost: severe wind risk, 99% chance of damaging wind over 30y; extreme-heat days projected 7→23/yr by 2055 (HVAC capex compounding) — expect insurance premiums to compound above CPI over the hold.
Questions for the listing agent
- It's been on market 107 days. Have you received any prior offers? Is the seller open to a 9% concession, seller financing, or rate buy-down credit?
- Why hasn't it sold? Are there any deal-killer items the seller is aware of (foundation, flood, title, zoning, code violations)?
- Is there a deadline driving the sale (1031 exchange, divorce, estate, relocation)? That informs how much negotiation room exists.
- Schools are A-rated — typically a magnet for longer-tenancy family renters. What's the average tenant stay here, and is there a school-zone premium baked into asking?
- What's the average days-on-market for RENTAL listings here right now (not sales)? A rising rental-DOM trend means longer vacancies and softer asking-rent achievability than the comps imply.
- What's the recent tenant-quality profile in this submarket — average credit score on applications, eviction rate, late-payment / NSF rate, and stable-employment percentage? A property-management company in the area should have these aggregated.
- How much new for-sale + rental construction is in the pipeline within 1–3 miles? Heavy new supply typically softens prices + rents 12–24 months out; constrained supply supports both.
Investment metrics
- 1% rule
- 1.58% ✓
- Cap rate
- 12.94%
- Cash-on-cash
- 23.74%
- DSCR
- 2.06
- GRM
- 5.3
CMA / ARV
No comps found within radius.
Projected returns pro-forma
-3.0% appreciation · 0.0% rent growth · sell at horizon
- IRR
- 13.5%
- Equity multiple
- 1.52×
- Total profit
- $18,817
- Equity at exit
- $19,383
- IRR
- 19.9%
- Equity multiple
- 2.44×
- Total profit
- $52,356
- Equity at exit
- $11,240
Cash invested: $36,400 (down + closing). Projections, not guarantees.
Landlord ↔ Tenant lean methodology
- Overall (STATE)
- 87 Strongly Landlord-Friendly
- State Florida
- 87 Strongly Landlord-Friendly · R+3
- County
- — inherits STATE
- City
- — inherits STATE
ZIP-level market 32904
- Rents YoY
- -0.3%
- Active inventory
- 304
- Price-to-rent
- 5.3×
Monthly cashflow live
- Estimated rent
- $2,049 high interval (Pro) →
- Mortgage (P&I)
- −$682
- Tax est. 1.5%
- −$162 /mo · $1,950/yr
- Insurance
- −$54
- HOA
- −$0
- Vacancy / Maint / Mgmt
- −$430
- Net cashflow
- $720
Break-even live
UW: 25.0% down · 7.5% · 30yr · 1.5% tax · 5.0% vac · 8.0% maint · 8.0% mgmt
Financing live
Cash to close
- Down payment
- $32,500
- Closing costs
- $3,900
- Reserves months
- —
- Total cash needed
- —
Loan-product check · same deal, 3 products live
Conventional
25% down · 7.5% · 30yr
- Down + closing
- —
- Monthly P&I
- —
- Monthly cashflow
- —
- DSCR
- —
- Eligible?
- —
Personal DTI + credit; lowest rate.
DSCR
20% down · 8.5% · 30yr
- Down + closing
- —
- Monthly P&I
- —
- Monthly cashflow
- —
- DSCR
- —
- Eligible?
- —
No personal income docs; deal must DSCR.
Hard money
10% down · 12.0% · 12mo
- Down + closing
- —
- Monthly P&I
- —
- Monthly cashflow
- —
- DSCR
- —
- Eligible?
- —
Short-term bridge; refi at stabilization.
Rent comps 13 comps
| Address | Beds | Baths | Sqft | Rent | $/sqft | DOM | Units | Dist |
|---|---|---|---|---|---|---|---|---|
| 1152 Bainbury Ln Melbourne, FL | 3.0 | 2.0 | 1297 | $2,000 | $1.54 | 23d | 1 | 0.18mi |
| 4152 Merrillville Dr West Melbourne, FL | 1.0–3.0 | 1.0–3.0 | 1106 | $1,764 | $1.59 | 23d | 1 | 0.55mi |
| 1361 Tamango Dr Melbourne, FL | 3.0 | 2.0 | 1815 | $2,350 | $1.29 | 23d | 1 | 0.69mi |
| 118 Discovery DR West Melbourne, FL | 1.0–3.0 | 1.0–2.0 | 994 | $2,042 | $2.05 | 14d | 58 | 0.71mi |
| 3184 Burdock Ave Melbourne, FL | 3.0 | 2.0 | 1874 | $2,200 | $1.17 | 14d | 1 | 0.95mi |
| 760 John Adams Ln Melbourne, FL | 3.0 | 2.0 | 1288 | $1,950 | $1.51 | 23d | 1 | 1.11mi |
| 918 Aventine Dr West Melbourne, FL | 1.0–2.0 | 1.0–2.0 | 907 | $2,202 | $2.43 | 13d | 33 | 1.22mi |
| 4535 Amore Ln Melbourne, FL | 3.0 | 2.5 | 1463 | $2,144 | $1.47 | 14d | 4 | 1.26mi |
| 4850 Heritage Lakes BLVD West Melbourne, FL | 1.0–3.0 | 1.0–2.5 | 1018 | $2,070 | $2.03 | 13d | 119 | 1.30mi |
| 4714 Crosswind Ct Melbourne, FL | 1.0–3.0 | 1.0–2.0 | 1071 | $1,725 | $1.61 | 13d | 19 | 1.32mi |
| 1040 Venetian Dr #203 Melbourne, FL | 3.0 | 2.0 | 1781 | $1,700 | $0.95 | 23d | 1 | 1.36mi |
| 127 Memory Ln NE Palm Bay, FL | 3.0 | 2.0 | 1756 | $4,000 | $2.28 | 23d | 1 | 1.40mi |
| 1015 Venetian Dr #104 Melbourne, FL | 2.0 | 2.0 | 1438 | $1,750 | $1.22 | 23d | 1 | 1.45mi |
Listing history 13 events
-
2026-06-18days on market $130,000 Active 107 DOM
-
2026-06-17days on market $130,000 Active 106 DOM
-
2026-06-16days on market $130,000 Active 105 DOM
-
2026-06-15days on market $130,000 Active 104 DOM
-
2026-06-14days on market $130,000 Active 102 DOM
-
2026-06-10days on market $130,000 Active 99 DOM
-
2026-06-08days on market $130,000 Active 97 DOM
-
2026-06-07days on market $130,000 Active 96 DOM
-
2026-06-05days on market $130,000 Active 93 DOM
-
2026-06-03days on market $130,000 Active 92 DOM
-
2026-06-02days on market $130,000 Active 91 DOM
-
2026-06-01days on market $130,000 Active 90 DOM
-
2026-05-31days on market $130,000 Active 89 DOM
ⓘ Source: listings_history table (triggers on properties + properties_extension) + one-shot
backfill from property_details.listing_events for pre-trigger history.
Climate risk First Street
- Flood 1/10 Low FEMA zone X (unshaded) · 0% chance over 30 yrs
- Wildfire 2/10 Low
- Heat 10/10 Extreme 7 d/yr ≥106°F today · 23 d/yr by 30 yrs out
- Wind 10/10 Extreme 99% chance of damaging wind over 30 yrs
- Air quality 1/10 Low 0 unhealthy d/yr today · 0 by 30 yrs out
Nearby sold comps map
Loading sold comps map…
Walkable amenities ~0.75 mi
Loading nearby amenities…
Taxation est. · year 1
- Rental income
- $24,583
- − Mortgage interest
- −$7,282
- − Property taxes
- −$1,950
- − Insurance
- −$650
- − Repairs & maintenance
- −$1,967
- − Management
- −$1,967
- − Depreciation
- −$3,782
- Taxable income
- $6,986
- Est. tax owed @ 24.0%
- −$1,677
- After-tax cash flow
- $6,963/yr
For passive investors: Depreciation is non-cash, so a rental often shows a tax loss while cash-flowing — sheltering income. Rental losses are passive: they offset passive income freely, and up to $25,000/yr can offset ordinary (W-2) income if you actively participate and your MAGI is under $100k (phasing out to $0 by $150k); unused losses carry forward. On sale, claimed depreciation is recaptured at up to 25%, and gains may owe capital-gains tax (a 1031 exchange can defer both). Figures are a year-1 estimate at your 24.0% rate — not tax advice; consult a CPA.
Schools (NCES district)
- District
- Brevard
- NCES district ID
- 1200150
- Math proficiency
- 53% ▼ -9.00%
- Reading proficiency
- 57% ▼ -4.00%
- Median HH income
- $49,426
- Composite
- 46.86/100
- National rank
- #2370
- State rank
- #19 of 73 in FL
Livability — West Melbourne
- Score
- 82/100
- State rank
- #73
- US rank
- #1214
Category grades
Schools grade is shown separately in the Schools card above.
Census & demographics
- County
- Brevard County · 602,871 people
- Metro
- Palm Bay-Melbourne-Titusville, FL
- Population (ZIP)
- 37,241
- Household income
- $90,673
- Rent vs Own
- Severe rent burden
- 597.0
Population outlook (Brevard County) Hauer SSP2
- Today (2025)
- 623,254 people
- By 2030
- 648,420 · +4.0%
- By 2040
- 690,009 · +10.7%
- By 2050
- 715,669 · +14.8%
- By 2075
- 775,744 · +24.5%
- By 2100
- 776,687 · +24.6%
Race, ethnicity, and origin ACS 2023
- Neighborhood character
- Predominantly White (72%)
- Race & ethnicity
- White 72% Hispanic / Latino 14% Two or more races 10% Asian 5% Black 4%
- Hispanic origin (detail)
- Mexican 2% Puerto Rican 6%
- Common ancestry
- Romanian 3% Lithuanian 3% Italian 2%
- Foreign-born
- 10% · Canada, China, Vietnam
- Languages at home
- 84% English-only · Spanish 8% Other Indo-European 2% Chinese 2%
Political lean MEDSL · Brevard
- 2024 margin
- Strong R (+20.8) · D 39.1% · R 59.9% · Other 1.0%
- 2008→2024 swing
- -10.4pp toward R · 2008: -10.4pp · 2024: -20.8pp
- All cycles
- 2024: R+20.8 2020: R+16.4 2016: R+19.8 2012: R+12.7 2008: R+10.4
Not yet ingested
- Civics
- —
Market trends
- HPI YoY
- ▼ -195.98%
- Current HPI
- 304.2546
- Rent YoY
- ▼ -0.32%
- Metro
- Palm Bay-Melbourne-Titusville, FL
- State GDP YoY
- ▲ 3.28%
- F500 in state
- 36
Industry mix (Fortune 500 HQ in FL)
| Industry | F500 HQs | Revenue |
|---|---|---|
| Industrial Technology | 2 | $29B |
|
||
| Insurance | 2 | $17B |
|
||
| Retail | 1 | $60B |
|
||
| Technology Distribution | 1 | $58B |
|
||
| Homebuilding | 1 | $35B |
|
||
| Technology Manufacturing | 1 | $35B |
|
||
Cash-flow waterfall
monthlySold comps — $/sqft
last 12 mo · ≤1 miLoading sold comps…