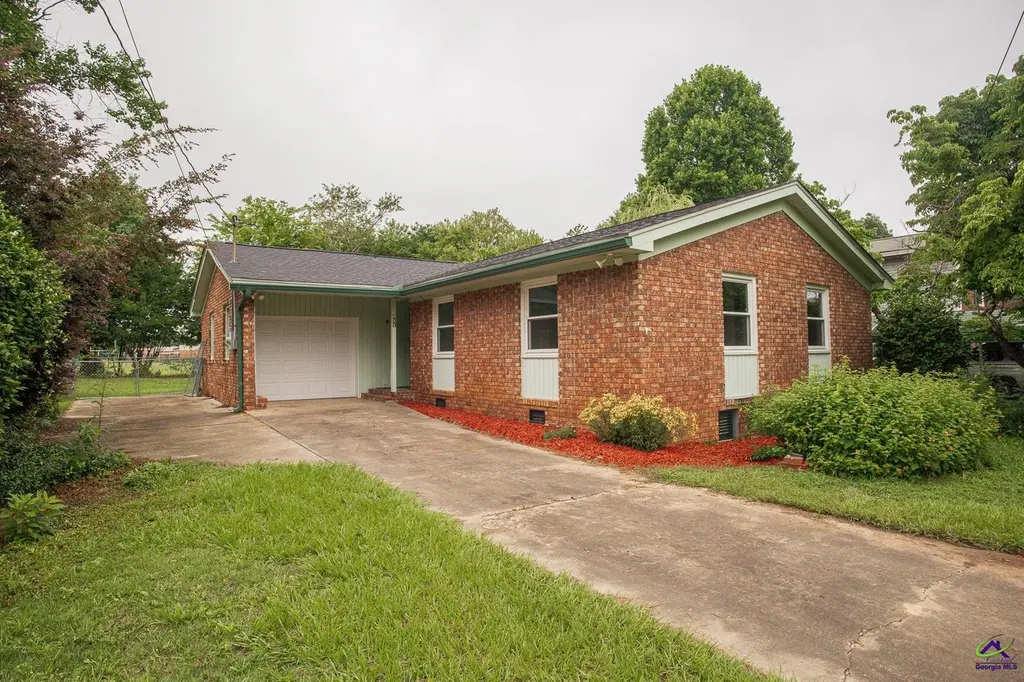
211 Sunnydale Dr · Warner Robins, GA
Flood risk 1/10 · Minimal
- FEMA flood zone
- X (unshaded)
- Chance of flooding over 30 yrs
- 0.0%
- Est. flood insurance / yr
- $507 – $1,088
Fire risk 4/10 · Minor
- Est. fire insurance / yr
- $963 – $1,789
Heat risk 7/10 · Major
- Hot days now (above 108°F)
- 7 days/yr
- Hot days in 30 yrs
- 18 days/yr
Wind risk 6/10 · Moderate
- Chance of severe wind over 30 yrs
- 76.0%
Air-quality risk 3/10 · Minor
- Unhealthy air days now
- 2 days/yr
- Unhealthy air days in 30 yrs
- 3 days/yr
Risk factors via First Street. Map © Google.
Why this score? — see what drove the C+ grade
The composite is a weighted blend of 9 inputs, each scored 0–100. Each bar is that input's sub-score; the figure is the points it added to the 100-point composite (weight × sub-score).
- Cash flow +22.0/30.0
- ARV discount +15.0/15.0
- DSCR +7.0/10.0
- 1% rule +4.8/10.0
- Schools +3.9/10.0
- Livability +3.2/5.0
- Rent growth +2.9/5.0
- Condition / age +2.5/5.0
- Appreciation +0.0/10.0
$169,900
🖨 Deal sheet 📄 Offer letter ✓ Due diligence
Listing remarks MLS
Welcome home to this charming 3-bedroom, 2-bath residence offering 1,644 square feet of comfortable living space! Designed with both functionality and everyday living in mind, this home features a spacious layout perfect for relaxing or entertaining. The 1-car garage provides added convenience and storage, while the well-appointed interior offers plenty of room to make it your own. Whether you're a first-time homebuyer, downsizing, or looking for your next investment opportunity, this property is full of potential and ready for its next owners!
Key facts
- 9,583 sq ft lot
- Garage
- Built 1967
Property features AI
Finance
- Other: Located in the Hill & Dale subdivision; Lot approximately 0.22 acres; Address: 211 Sunnydale Drive, Warner Robins, GA 31088; County: Houston
- HOA & community: No homeowners association
Exterior
- Parking: Attached garage
- Utilities: Public water; Public sewer; Cable available; Electricity available; Electric service on property
- Home design: Single-family residence; House structure type; Resale property
- Construction: Built in 1967; Slab foundation; Brick construction; Composition roof
- Exterior features: Level lot; Composition roof; Brick exterior
Interior
- Kitchen: Cooktop; Dishwasher; Disposal; Microwave; Oven
- Bedrooms: Three main-level bedrooms
- Flooring: Hardwood floors
- Bathrooms: Two full bathrooms (both on the main level)
- Heating & cooling: Central heating (electric); Central air conditioning
- Interior features: One-level living; Public-record living area of 1644; Dining room and living room combined; No basement; Laundry area in a common space; Hardwood flooring
- Laundry & utility: Laundry in common area
Neighborhood map
What this means for you Summary
Snapshot
- This is a 3-bed/2.0-bath single-family listed at $170k.
Deal economics
- At list price, monthly cash flow is $269 ($3k/yr) — positive.
- The deal already cash-flows at list — no discount required.
- To meet the 1% rule (rent ≥ 1% of price), the offer needs to be $166k (2.1% below list).
- Recommended offer: $166k (2.1% below list) — sets the bar for 1% rule.
- Cap rate 8.2% vs local median 4.9% in Warner Robins — top-decile yield for the area; either an underpriced asset or a hidden risk that comps aren't pricing in. Stress-test before assuming the spread holds.
Location & tenants
- Location reads 65/100 on livability (#227 in GA) — a middle-class / working-renter tenant base. Strengths: cost of living A+, housing A+, health & safety A+; Watch: employment D+, crime F, amenities F.
- Houston County (urban): math 43% / reading 46% proficiency, ranked #23 of 174 in GA (top 13%) — families likely to look elsewhere, expect single-tenant / working-renter base with shorter leases.
- Zoned schools: Shirley Hills Elementary School (math 44% / reading 52%, grade D, #289 of 1,228 statewide, top 24%, 545 students, 84% FRL); Warner Robins Middle School (math 25% / reading 37%, grade F, #237 of 470 statewide, top 51%, 813 students, 84% FRL); Warner Robins High School (math 7% / reading 21%, grade F, #322 of 424 statewide, top 76%, 1,816 students, 84% FRL) — zoned schools average 84% FRL vs 46% district-wide (38 pts higher); higher-poverty schools than district average — tighter screening recommended.
- Zoned-school proficiency averages 31% at this address vs 44% district-wide (-14 pts) — the specific schools serving this property underperform the Houston County average; the district grade overstates school quality for this exact location.
- Market conditions: Rents rising (+1.7%/yr); 286 active listings in the ZIP; 25 comparable units currently listed for rent nearby; rentals at typical pace (median 21d on market — plan ~3-4 weeks tenant-placement turnaround); 40% of comp listings sitting > 30 days — soft ceiling on asking rent; solid renter incomes; 1,545 units permitted in Houston County in 2024 (336 in 5+ unit buildings).
Forward outlook
- Local home prices are declining (-3.0%/yr); year-one equity from $1k of loan paydown is wiped out by about $5k of value loss. Plan a longer hold.
- Houston County population projected at +22% by 2050 — long-run rental-demand tailwind backs the buy-and-hold thesis.
Negotiation context
- Only 4 days on market — expect competitive offers; lowballing is unlikely to land.
- 3 sale attempts with the ask held roughly flat each time — persistent listings suggest the price (not the market) is what's stuck; bring a comps-based counter.
- Current owner paid $70k; list at $170k implies a 143% gain — meaningful room to come down on a strong offer.
Risks & watch-outs
- Climate carrying-cost: major wind risk, 76% chance of damaging wind over 30y; extreme-heat days projected 7→18/yr by 2055 (HVAC capex compounding) — expect insurance premiums to compound above CPI over the hold.
Questions for the listing agent
- Built in 1967 — when were the roof, HVAC, electrical panel, plumbing, and water heater last replaced?
- Is there a deadline driving the sale (1031 exchange, divorce, estate, relocation)? That informs how much negotiation room exists.
- Schools are D-rated, which usually means shorter tenancies and higher turnover. Who's the typical renter profile here, and what's been the actual vacancy rate?
- Crime grade is F in this area — have there been break-ins, vandalism, or insurance claims at this property in the last 3 years? What carrier currently insures it and at what premium?
- What's the average days-on-market for RENTAL listings here right now (not sales)? A rising rental-DOM trend means longer vacancies and softer asking-rent achievability than the comps imply.
- What's the recent tenant-quality profile in this submarket — average credit score on applications, eviction rate, late-payment / NSF rate, and stable-employment percentage? A property-management company in the area should have these aggregated.
- How much new for-sale + rental construction is in the pipeline within 1–3 miles? Heavy new supply typically softens prices + rents 12–24 months out; constrained supply supports both.
Investment metrics
- 1% rule
- 0.98% ✗
- Cap rate
- 8.19%
- Cash-on-cash
- 6.79%
- DSCR
- 1.30
- GRM
- 8.5
CMA / ARV
- ARV (on-the-fly)
- $210,432
- Comps found
- 12
Show comp detail 12 sales within ~0.75 mi
| Address | Dist | Beds/Ba | Sqft | Sold | Price | $/sf | Match |
|---|---|---|---|---|---|---|---|
| 108 Woodsdale Dr | 0.16mi | 4/2.0 (+1) | 1,617 (-2%) | 2mo | $172,900 | $107 | 83 |
| 139 Rolling Woods Circle Cir | 0.31mi | 3/2.0 | 1,565 (-5%) | 2mo | $230,900 | $148 | 76 |
| 141 Rolling Woods Circle Cir | 0.30mi | 3/2.0 | 1,565 (-5%) | 3mo | $230,900 | $148 | 76 |
| 129 Rolling Woods Cir | 0.36mi | 3/2.0 | 1,508 (-8%) | 7mo | $144,000 | $95 | 64 |
| 216 Self St | 0.50mi | 4/2.0 (+1) | 1,576 (-4%) | 5mo | $201,900 | $128 | 60 |
| 112 Lake Dr | 0.66mi | 3/1.5 | 1,623 (-1%) | 7mo | $156,000 | $96 | 59 |
| 122 Cheryl Blvd | 0.73mi | 3/2.0 | 1,626 (-1%) | 11mo | $150,000 | $92 | 55 |
| 122 Cheryl Blvd Blvd | 0.73mi | 3/2.0 | 1,626 (-1%) | 11mo | $150,000 | $92 | 55 |
| 145 Rolling Woods Cir | 0.31mi | 3/2.5 | 1,439 (-12%) | 11mo | $210,000 | $146 | 54 |
| 103 Sonja Dr | 0.61mi | 3/1.5 | 1,426 (-13%) | 8mo | $182,750 | $128 | 41 |
| 107 Self St | 0.59mi | 4/2.0 (+1) | 1,448 (-12%) | 8mo | $213,000 | $147 | 41 |
| 116 Lake Dr | 0.70mi | 4/1.5 (+1) | 1,425 (-13%) | 7mo | $160,000 | $112 | 32 |
Match score weights: distance 35% · size 25% · config 20% · recency 20%. Top-matched comps best support the ARV.
Projected returns pro-forma
-3.0% appreciation · 1.67% rent growth · sell at horizon
- IRR
- -7.3%
- Equity multiple
- 0.73×
- Total profit
- $-12,645
- Equity at exit
- $25,333
- IRR
- 0.7%
- Equity multiple
- 1.04×
- Total profit
- $2,060
- Equity at exit
- $14,690
Cash invested: $47,572 (down + closing). Projections, not guarantees.
Landlord ↔ Tenant lean methodology
- Overall (STATE)
- 90 Strongly Landlord-Friendly
- State Georgia
- 90 Strongly Landlord-Friendly · R+3
- County
- — inherits STATE
- City
- — inherits STATE
ZIP-level market 31088
- Rents YoY
- 1.7%
- Active inventory
- 286
- Price-to-rent
- 8.5×
Monthly cashflow live
- Estimated rent
- $1,663 high interval (Pro) →
- Mortgage (P&I)
- −$891
- Tax from tax record
- −$83 /mo · $998/yr
- Insurance
- −$71
- HOA
- −$0
- Vacancy / Maint / Mgmt
- −$349
- Net cashflow
- $269
Break-even live
UW: 25.0% down · 7.5% · 30yr · 1.5% tax · 5.0% vac · 8.0% maint · 8.0% mgmt
Financing live
Cash to close
- Down payment
- $42,475
- Closing costs
- $5,097
- Reserves months
- —
- Total cash needed
- —
Loan-product check · same deal, 3 products live
Conventional
25% down · 7.5% · 30yr
- Down + closing
- —
- Monthly P&I
- —
- Monthly cashflow
- —
- DSCR
- —
- Eligible?
- —
Personal DTI + credit; lowest rate.
DSCR
20% down · 8.5% · 30yr
- Down + closing
- —
- Monthly P&I
- —
- Monthly cashflow
- —
- DSCR
- —
- Eligible?
- —
No personal income docs; deal must DSCR.
Hard money
10% down · 12.0% · 12mo
- Down + closing
- —
- Monthly P&I
- —
- Monthly cashflow
- —
- DSCR
- —
- Eligible?
- —
Short-term bridge; refi at stabilization.
Rent comps 25 comps
| Address | Beds | Baths | Sqft | Rent | $/sqft | DOM | Units | Dist |
|---|---|---|---|---|---|---|---|---|
| 122 Rolling Woods Cir Warner Robins, GA | 3.0 | 2.5 | 1920 | $1,750 | $0.91 | 21d | 1 | 0.32mi |
| 122 Rolling Woods Cir Warner Robins, GA | 3.0 | 2.5 | 1920 | $1,750 | $0.91 | 43d | 1 | 0.32mi |
| 1010 S Houston Lake Rd Warner Robins, GA | 1.0–3.0 | 1.0–2.0 | 1088 | $1,572 | $1.44 | 13d | 23 | 0.45mi |
| 202 Self St Warner Robins, GA | 3.0 | 2.0 | 1294 | $1,450 | $1.12 | 43d | 1 | 0.53mi |
| 341 Mary Ln Warner Robins, GA | 3.0 | 2.0 | 1413 | $1,350 | $0.96 | 21d | 1 | 0.62mi |
| 211 Laverne Dr Warner Robins, GA | 3.0 | 2.0 | 1431 | $1,395 | $0.97 | 13d | 1 | 0.62mi |
| 320 Carl Vinson Pkwy Warner Robins, GA | 2.0–3.0 | 2.0 | 1090 | $1,225 | $1.12 | 43d | 1 | 0.63mi |
| 337 Mary Ln Warner Robins, GA | 3.0 | 2.0 | 1411 | $1,500 | $1.06 | 13d | 1 | 0.65mi |
| 115 Cheryl Blvd Warner Robins, GA | 3.0 | 2.0 | 1328 | $1,500 | $1.13 | 13d | 1 | 0.67mi |
| 115 Cheryl Blvd Warner Robins, GA | 3.0 | 2.0 | 1328 | $1,500 | $1.13 | 21d | 1 | 0.67mi |
| 132 Cathy Ct Warner Robins, GA | 3.0 | 1.5 | 1428 | $1,450 | $1.02 | 21d | 1 | 0.75mi |
| 132 Cathy Ct Warner Robins, GA | 3.0 | 2.0 | 1428 | $1,450 | $1.02 | 13d | 1 | 0.75mi |
| 1205 Leverett Rd Warner Robins, GA | 2.0 | 2.0 | 1055 | $1,125 | $1.07 | 21d | 1 | 0.76mi |
| 91 Bass Rd Warner Robins, GA | 1.0–3.0 | 1.0–2.5 | 1008 | $2,199 | $2.18 | 13d | 11 | 0.82mi |
| 124 Carterwoods Dr Warner Robins, GA | 3.0 | 2.0 | 1818 | $1,811 | $1.00 | 21d | 1 | 0.97mi |
| 121 Highland Dr Warner Robins, GA | 3.0 | 2.0 | 1712 | $1,795 | $1.05 | 43d | 1 | 1.15mi |
| 121 Highland Dr Warner Robins, GA | 3.0 | 2.0 | 1712 | $1,795 | $1.05 | 21d | 1 | 1.15mi |
| 204 Ashby Way Warner Robins, GA | 3.0 | 2.0 | 1251 | $1,395 | $1.12 | 43d | 1 | 1.16mi |
| 100 Wrights Mill Cir Warner Robins, GA | 2.0 | 2.0 | 1118 | $1,475 | $1.32 | 43d | 1 | 1.20mi |
| 109 Leisure Pointe Cv Warner Robins, GA | 4.0 | 2.5 | 1682 | $1,925 | $1.14 | 43d | 1 | 1.26mi |
| 106 Leisure Pointe Cv Warner Robins, GA | 4.0 | 2.5 | 1682 | $1,950 | $1.16 | 13d | 1 | 1.29mi |
| 106 Leisure Pointe Cv Warner Robins, GA | 4.0 | 2.5 | 1682 | $2,000 | $1.19 | 43d | 1 | 1.29mi |
| 1485 Leverette Rd Warner Robins, GA | 1.0–3.0 | 1.0–2.0 | 1144 | $1,804 | $1.58 | 13d | 13 | 1.40mi |
| 126 Jaybee Dr Warner Robins, GA | 3.0 | 2.0 | 1378 | $1,750 | $1.27 | 43d | 1 | 1.41mi |
| 108 Pershing Place Ct Warner Robins, GA | 2.0 | 2.0 | 1120 | $1,300 | $1.16 | 43d | 1 | 1.49mi |
Listing history 5 events
-
2026-06-07statusdays on market $169,900 Under Contract 4 DOM
-
2026-06-05days on market $169,900 New 3 DOM
-
2026-06-03days on market $169,900 New 2 DOM
-
2026-06-02remarks 550-char remark
-
2026-06-02$169,900 New 1 DOM
ⓘ Source: listings_history table (triggers on properties + properties_extension) + one-shot
backfill from property_details.listing_events for pre-trigger history.
Tax reassessment forecast GA · Resets to sale price
- Current annual tax
- $998 · $83/mo
- Projected year-2 tax
- $1,563 · $130/mo
- Expected delta
- +$565/yr (+$47/mo · 56.6%)
ⓘ Screening estimate from a state-policy table — verify with the county assessor before closing.
Climate risk First Street
- Flood 1/10 Low FEMA zone X (unshaded) · 0% chance over 30 yrs
- Wildfire 4/10 Moderate
- Heat 7/10 Severe 7 d/yr ≥108°F today · 18 d/yr by 30 yrs out
- Wind 6/10 Major 76% chance of damaging wind over 30 yrs
- Air quality 3/10 Moderate 2 unhealthy d/yr today · 3 by 30 yrs out
Nearby sold comps map
Loading sold comps map…
Walkable amenities ~0.75 mi
Loading nearby amenities…
Taxation est. · year 1
- Rental income
- $19,960
- − Mortgage interest
- −$9,517
- − Property taxes
- −$998
- − Insurance
- −$850
- − Repairs & maintenance
- −$1,597
- − Management
- −$1,597
- − Depreciation
- −$4,943
- Taxable income
- $459
- Est. tax owed @ 24.0%
- −$110
- After-tax cash flow
- $3,119/yr
For passive investors: Depreciation is non-cash, so a rental often shows a tax loss while cash-flowing — sheltering income. Rental losses are passive: they offset passive income freely, and up to $25,000/yr can offset ordinary (W-2) income if you actively participate and your MAGI is under $100k (phasing out to $0 by $150k); unused losses carry forward. On sale, claimed depreciation is recaptured at up to 25%, and gains may owe capital-gains tax (a 1031 exchange can defer both). Figures are a year-1 estimate at your 24.0% rate — not tax advice; consult a CPA.
Schools (NCES district)
- District
- Houston County
- NCES district ID
- 1302880
- Math proficiency
- 43% ▼ -7.00%
- Reading proficiency
- 46% ▼ -2.00%
- Median HH income
- $54,823
- Composite
- 38.68/100
- National rank
- #4144
- State rank
- #23 of 174 in GA
Livability — Warner Robins
- Score
- 65/100
- State rank
- #227
- US rank
- #13290
Category grades
Schools grade is shown separately in the Schools card above.
Census & demographics
- Census place
- Warner Robins, GA
- County
- Houston County · 157,321 people
- City population
- 92,102
- Metro
- Warner Robins, GA
- Population (ZIP)
- 58,585
- Household income
- $83,082
- Rent vs Own
- Severe rent burden
- 1668.0
Population outlook (Houston County) Hauer SSP2
- Today (2025)
- 169,502 people
- By 2030
- 178,486 · +5.3%
- By 2040
- 194,642 · +14.8%
- By 2050
- 207,119 · +22.2%
- By 2075
- 231,480 · +36.6%
- By 2100
- 235,034 · +38.7%
Race, ethnicity, and origin ACS 2023
- Neighborhood character
- Diverse neighborhood (Simpson 0.63)
- Race & ethnicity
- White 51% Black 32% Two or more races 9% Hispanic / Latino 7% Asian 4%
- Hispanic origin (detail)
- Mexican 4%
- Common ancestry
- Romanian 2% Slovak 2% Lithuanian 2%
- Foreign-born
- 9% · Canada, Vietnam, Jamaica
- Languages at home
- 90% English-only · Spanish 5% Other Asian/Pacific 2% Vietnamese 2%
Political lean MEDSL · Houston
- 2024 margin
- R (+11.3) · D 44.0% · R 55.3%
- 2008→2024 swing
- +8.9pp toward D · 2008: -20.2pp · 2024: -11.3pp
- All cycles
- 2024: R+11.3 2020: R+12.4 2016: R+21.6 2012: R+20.7 2008: R+20.2
Not yet ingested
- Civics
- —
Market trends
- HPI YoY
- ▼ -135.75%
- Current HPI
- 219.8261
- Rent YoY
- ▲ 1.67%
- Metro
- Warner Robins, GA
- State GDP YoY
- ▲ 2.66%
- F500 in state
- 28
Industry mix (Fortune 500 HQ in GA)
| Industry | F500 HQs | Revenue |
|---|---|---|
| Paper / Packaging | 2 | $29B |
|
||
| Retail | 1 | $160B |
|
||
| Transportation / Logistics | 1 | $91B |
|
||
| Airlines | 1 | $62B |
|
||
| Consumer Goods | 1 | $47B |
|
||
| Utilities | 1 | $25B |
|
||
Price history
+143.1% since first listed4 events — show timeline
- 2026-06-01 Listed $169,900 CGMLS
- 2026-06-01 Listed $169,900 MGMLS
- 2026-05-22 Listed $169,900 GAMLS
- 2001-12-06 Sold (Public Records) $69,900 Public Records
Property tax history
+2.5%/yrLatest (2025): $998 · +10.8% YoY. Source: county tax records.
Cash-flow waterfall
monthlySold comps — $/sqft
last 12 mo · ≤1 miLoading sold comps…