6010 Blind Mdw · San Antonio, TX
Flood risk 1/10 · Minimal
- FEMA flood zone
- X (unshaded)
- Chance of flooding over 30 yrs
- 0.0%
- Est. flood insurance / yr
- $507 – $1,088
Fire risk 4/10 · Minor
- Est. fire insurance / yr
- $1,222 – $2,270
Heat risk 8/10 · Major
- Hot days now (above 110°F)
- 7 days/yr
- Hot days in 30 yrs
- 23 days/yr
Wind risk 8/10 · Major
- Chance of severe wind over 30 yrs
- 80.0%
Air-quality risk 2/10 · Minimal
- Unhealthy air days now
- 0 days/yr
- Unhealthy air days in 30 yrs
- 2 days/yr
Risk factors via First Street. Map © Google.
Why this score? — see what drove the B+ grade
The composite is a weighted blend of 9 inputs, each scored 0–100. Each bar is that input's sub-score; the figure is the points it added to the 100-point composite (weight × sub-score).
- Cash flow +30.0/30.0
- ARV discount +15.0/15.0
- 1% rule +10.0/10.0
- DSCR +10.0/10.0
- Livability +4.0/5.0
- Rent growth +3.6/5.0
- Condition / age +2.5/5.0
- Schools +1.9/10.0
- Appreciation +0.0/10.0
$99,000
🖨 Deal sheet 📄 Offer letter ✓ Due diligence
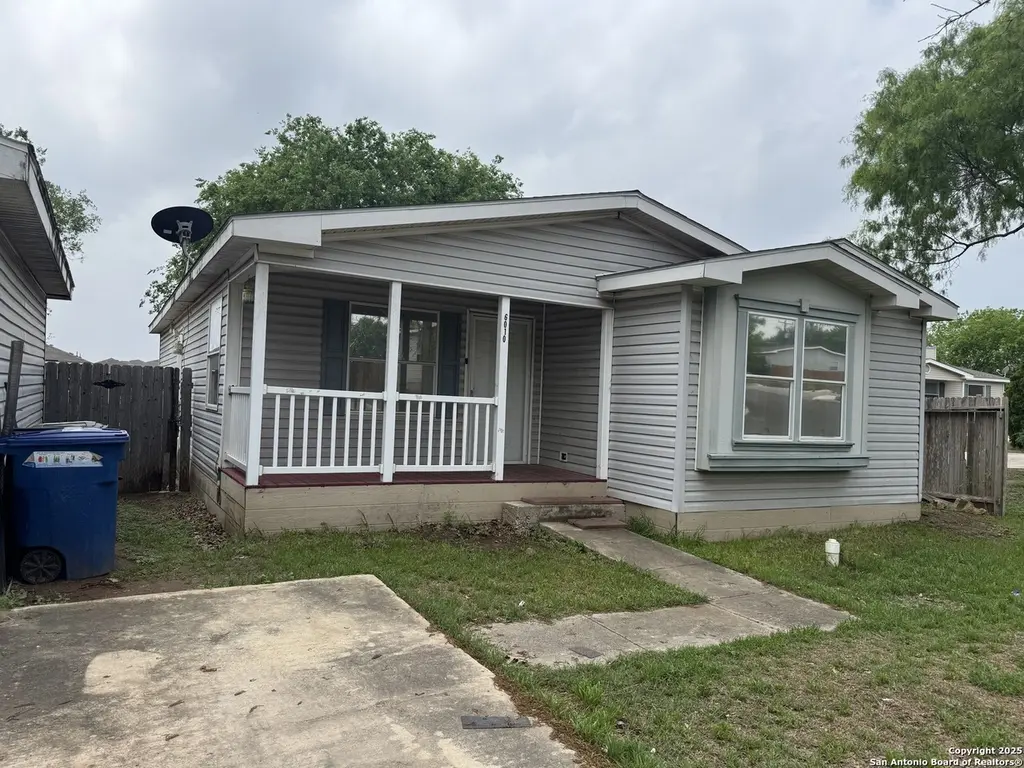
Listing remarks MLS
3/2 Home Available in Foster Meadows! Large eat in kitchen with plenty of cabinet space. Living room with lots of windows for natural light. Stove, refrigerator and dishwasher included. Spacious bedrooms with no carpet! Master suite features walk in closet, garden tub and separate shower. Good sized yard. Detached one car garage. Needs repair but could be a great investment opportunity!
Key facts
- Eat in kitchen
- Natural light
- Lots of windows
Tags
Neighborhood map
What this means for you Summary
Snapshot
- This is a 3-bed/2.0-bath manufactured listed at $99k.
Deal economics
- At list price, monthly cash flow is $590 ($7k/yr) — positive.
- The deal already cash-flows at list — no discount required.
- Meets the 1% rule at list price ($2k rent vs $99k).
- Recommended offer: $87k (12.0% below list) — sets the bar for market timing.
- Cap rate 13.4% vs local median 3.8% in San Antonio — top-decile yield for the area; either an underpriced asset or a hidden risk that comps aren't pricing in. Stress-test before assuming the spread holds.
Location & tenants
- Location reads 80/100 on livability (#31 in TX, #1,616 nationally) — a professional / high-income tenant draw. Strengths: amenities A+, commute A+, cost of living A+; Watch: schools C-, crime F.
- East Central ISD (rural): math 16% / reading 25% proficiency, ranked #758 of 826 in TX (top 92%) — low school quality limits family demand, transient renter base, plan for 1-2y turnover; 61% free/reduced lunch — lower-income household profile, screen leases tightly.
- Market conditions: Rents rising fast (+4.3%/yr); 428 active listings in the ZIP; 40 comparable units currently listed for rent nearby; rentals at typical pace (median 24d on market — plan ~3-4 weeks tenant-placement turnaround); 8,308 units permitted in Bexar County in 2024 (2,506 in 5+ unit buildings).
- This rent runs 31% of the median local income ($66k/yr) — at the standard rent-burdened threshold; future hikes will face affordability resistance.
Forward outlook
- Local home prices are declining (-3.0%/yr); year-one equity from $684 of loan paydown is wiped out by about $3k of value loss. Plan a longer hold.
- Bexar County population projected at +50% by 2050 — long-run rental-demand tailwind backs the buy-and-hold thesis.
- At projected returns (-3.0% appreciation + 4.3% rent growth), your $28k cash investment doubles in ~5 years — after that, you're playing with house money.
Negotiation context
- It's been on market 381 days — a 12% lower offer ($87k) is reasonable based on typical stale-listing flexibility.
- 4 sale attempts since 23y ago; this cycle's ask has dropped $51k (34%) from the opening price — seller is motivated, your offer sets the floor, not the list.
Risks & watch-outs
- Climate carrying-cost: severe wind risk, 80% chance of damaging wind over 30y; extreme-heat days projected 7→23/yr by 2055 (HVAC capex compounding) — expect insurance premiums to compound above CPI over the hold.
Questions for the listing agent
- It's been on market 381 days. Have you received any prior offers? Is the seller open to a 12% concession, seller financing, or rate buy-down credit?
- Why hasn't it sold? Are there any deal-killer items the seller is aware of (foundation, flood, title, zoning, code violations)?
- Is there a deadline driving the sale (1031 exchange, divorce, estate, relocation)? That informs how much negotiation room exists.
- Crime grade is F in this area — have there been break-ins, vandalism, or insurance claims at this property in the last 3 years? What carrier currently insures it and at what premium?
- What's the average days-on-market for RENTAL listings here right now (not sales)? A rising rental-DOM trend means longer vacancies and softer asking-rent achievability than the comps imply.
- What's the recent tenant-quality profile in this submarket — average credit score on applications, eviction rate, late-payment / NSF rate, and stable-employment percentage? A property-management company in the area should have these aggregated.
- How much new for-sale + rental construction is in the pipeline within 1–3 miles? Heavy new supply typically softens prices + rents 12–24 months out; constrained supply supports both.
Investment metrics
- 1% rule
- 1.71% ✓
- Cap rate
- 13.44%
- Cash-on-cash
- 25.54%
- DSCR
- 2.14
- GRM
- 4.9
CMA / ARV
- ARV (median comp)
- $193,291
- List price
- $99,000
- Delta
- -48.78%
- Verdict
- UNDERPRICED
- Comps
- 20 within 1.0 mi
Projected returns pro-forma
-3.0% appreciation · 4.35% rent growth · sell at horizon
- IRR
- 20.8%
- Equity multiple
- 1.86×
- Total profit
- $23,927
- Equity at exit
- $14,761
- IRR
- 29.9%
- Equity multiple
- 3.86×
- Total profit
- $79,309
- Equity at exit
- $8,560
Cash invested: $27,720 (down + closing). Projections, not guarantees.
Landlord ↔ Tenant lean methodology
- Overall (STATE)
- 87 Strongly Landlord-Friendly
- State Texas
- 87 Strongly Landlord-Friendly · R+5
- County
- — inherits STATE
- City
- — inherits STATE
ZIP-level market 78222
- Home prices YoY
- -4.8%
- Rents YoY
- 4.3%
- Active inventory
- 428
- Price-to-rent
- 4.9×
Monthly cashflow live
- Estimated rent
- $1,693 high interval (Pro) →
- Mortgage (P&I)
- −$519
- Tax from tax record
- −$187 /mo · $2,243/yr
- Insurance
- −$41
- HOA
- −$0
- Vacancy / Maint / Mgmt
- −$355
- Net cashflow
- $590
Break-even live
UW: 25.0% down · 7.5% · 30yr · 1.5% tax · 5.0% vac · 8.0% maint · 8.0% mgmt
Financing live
Cash to close
- Down payment
- $24,750
- Closing costs
- $2,970
- Reserves months
- —
- Total cash needed
- —
Loan-product check · same deal, 3 products live
Conventional
25% down · 7.5% · 30yr
- Down + closing
- —
- Monthly P&I
- —
- Monthly cashflow
- —
- DSCR
- —
- Eligible?
- —
Personal DTI + credit; lowest rate.
DSCR
20% down · 8.5% · 30yr
- Down + closing
- —
- Monthly P&I
- —
- Monthly cashflow
- —
- DSCR
- —
- Eligible?
- —
No personal income docs; deal must DSCR.
Hard money
10% down · 12.0% · 12mo
- Down + closing
- —
- Monthly P&I
- —
- Monthly cashflow
- —
- DSCR
- —
- Eligible?
- —
Short-term bridge; refi at stabilization.
Rent comps 40 comps
| Address | Beds | Baths | Sqft | Rent | $/sqft | DOM | Units | Dist |
|---|---|---|---|---|---|---|---|---|
| 6115 Southern Vis San Antonio, TX | 3.0 | 2.0 | 1415 | $1,509 | $1.07 | 3d | 1 | 0.13mi |
| 6119 Southern Vis San Antonio, TX | 3.0 | 2.5 | 1246 | $1,685 | $1.35 | 23d | 1 | 0.14mi |
| 6223 Still Mdw San Antonio, TX | 3.0 | 2.0 | 1330 | $1,650 | $1.24 | 4d | 1 | 0.14mi |
| 2951 Lavender Mdw San Antonio, TX | 3.0 | 2.5 | 1246 | $1,530 | $1.23 | 12d | 1 | 0.20mi |
| 2906 Lavender Mdw San Antonio, TX | 3.0 | 2.5 | 1246 | $1,495 | $1.20 | 2d | 1 | 0.22mi |
| 2911 Lakebriar St San Antonio, TX | 4.0 | 2.0 | 1440 | $1,695 | $1.18 | 21d | 1 | 0.29mi |
| 2911 Lakebriar St San Antonio, TX | 4.0 | 2.0 | 1440 | $1,695 | $1.18 | 2d | 1 | 0.29mi |
| 6307 Sloane Cv San Antonio, TX | 3.0 | 2.5 | 1416 | $1,510 | $1.07 | 20d | 1 | 0.31mi |
| 6119 Lakefront St San Antonio, TX | 3.0 | 2.5 | 1246 | $1,495 | $1.20 | 43d | 1 | 0.33mi |
| 6427 Woodcliff Bnd San Antonio, TX | 3.0 | 2.5 | 1247 | $1,440 | $1.15 | 10d | 1 | 0.41mi |
| 3131 Rosalind Way San Antonio, TX | 3.0 | 2.5 | 1247 | $1,650 | $1.32 | 23d | 1 | 0.43mi |
| 5910 Sandy Lake St San Antonio, TX | 3.0 | 2.0 | 1389 | $2,100 | $1.51 | 43d | 1 | 0.45mi |
| 6230 Lake Victoria St San Antonio, TX | 3.0 | 2.0 | 1205 | $1,465 | $1.22 | 2d | 1 | 0.51mi |
| 6023 Lake Victoria St San Antonio, TX | 3.0 | 2.0 | 1368 | $1,575 | $1.15 | 12d | 1 | 0.53mi |
| 3535 Honey Mdw San Antonio, TX | 3.0 | 2.5 | 1438 | $1,400 | $0.97 | 16d | 1 | 0.59mi |
| 3510 Bottomless Lk San Antonio, TX | 2.0 | 2.0 | 1068 | $1,150 | $1.08 | 43d | 1 | 0.61mi |
| 5334 Hickory Pl San Antonio, TX | 3.0 | 2.0 | 1401 | $1,650 | $1.18 | 43d | 1 | 0.71mi |
| 4734 Shale Cv San Antonio, TX | 3.0 | 2.0 | 1247 | $1,725 | $1.38 | 23d | 1 | 0.76mi |
| 5227 Hickory Pl San Antonio, TX | 3.0 | 2.0 | 1199 | $1,700 | $1.42 | 23d | 1 | 0.80mi |
| 2718 Bermuda Dr San Antonio, TX | 3.0 | 3.0 | 1080 | $1,400 | $1.30 | 20d | 1 | 0.98mi |
| 5011 Jade Xing San Antonio, TX | 3.0 | 2.5 | 1239 | $1,590 | $1.28 | 43d | 1 | 0.99mi |
| 4226 Toledo Mist San Antonio, TX | 2.0 | 2.5 | 944 | $1,600 | $1.69 | 23d | 1 | 1.00mi |
| 5338 Natho St San Antonio, TX | 3.0 | 2.0 | 1298 | $1,349 | $1.04 | 12d | 1 | 1.00mi |
| 2719 Bermuda Dr San Antonio, TX | 3.0 | 2.0 | 1298 | $1,364 | $1.05 | 4d | 1 | 1.00mi |
| 5019 Jade Xing San Antonio, TX | 3.0 | 2.5 | 1272 | $1,500 | $1.18 | 23d | 1 | 1.01mi |
| 5334 Natho St San Antonio, TX | 3.0 | 2.0 | 1298 | $1,325 | $1.02 | 4d | 1 | 1.01mi |
| 5102 Blue Rnch San Antonio, TX | 3.0 | 2.5 | 1272 | $1,615 | $1.27 | 23d | 1 | 1.02mi |
| 5107 Jade Xing San Antonio, TX | 3.0 | 2.5 | 1419 | $1,575 | $1.11 | 23d | 1 | 1.02mi |
| 5114 Jade Xing San Antonio, TX | 3.0 | 2.5 | 1419 | $1,690 | $1.19 | 23d | 1 | 1.03mi |
| 5115 Jade Xing San Antonio, TX | 3.0 | 2.5 | 1239 | $1,550 | $1.25 | 17d | 1 | 1.03mi |
| 5119 Blue Rnch San Antonio, TX | 3.0 | 2.5 | 1272 | $1,615 | $1.27 | 23d | 1 | 1.05mi |
| 5207 Jade Xing San Antonio, TX | 3.0 | 2.5 | 1239 | $1,590 | $1.28 | 43d | 1 | 1.07mi |
| 2434 Bermuda Dr San Antonio, TX | 3.0 | 2.0 | 1298 | $1,414 | $1.09 | 4d | 1 | 1.08mi |
| 2430 Bermuda Dr San Antonio, TX | 3.0 | 2.0 | 1298 | $1,390 | $1.07 | 12d | 1 | 1.08mi |
| 5214 Jade Xing San Antonio, TX | 3.0 | 2.5 | 1419 | $1,690 | $1.19 | 23d | 1 | 1.08mi |
| 5203 Blue Rnch San Antonio, TX | 3.0 | 2.5 | 1272 | $1,615 | $1.27 | 23d | 1 | 1.08mi |
| 5215 Jade Xing San Antonio, TX | 3.0 | 2.5 | 1272 | $1,595 | $1.25 | 4d | 1 | 1.08mi |
| 5231 Jade Xing San Antonio, TX | 3.0 | 2.5 | 1239 | $1,590 | $1.28 | 10d | 1 | 1.11mi |
| 5227 Blue Rnch San Antonio, TX | 3.0 | 2.5 | 1239 | $1,590 | $1.28 | 23d | 1 | 1.12mi |
| 5231 Blue Rnch San Antonio, TX | 3.0 | 2.5 | 1419 | $1,690 | $1.19 | 43d | 1 | 1.13mi |
Listing history 27 events
-
2026-06-18days on market $99,000 Active 381 DOM
-
2026-06-17days on market $99,000 Active 380 DOM
-
2026-06-16days on market $99,000 Active 379 DOM
-
2026-06-15days on market $99,000 Active 378 DOM
-
2026-06-13days on market $99,000 Active 376 DOM
-
2026-06-09days on market $99,000 Active 372 DOM
-
2026-06-08days on market $99,000 Active 371 DOM
-
2026-06-07days on market $99,000 Active 370 DOM
-
2026-06-04days on market $99,000 Active 367 DOM
-
2026-06-03days on market $99,000 Active 366 DOM
-
2026-06-02days on market $99,000 Active 365 DOM
-
2026-06-01days on market $99,000 Active 364 DOM
-
2026-05-31days on market $99,000 Active 363 DOM
-
2026-04-27price $99,000 389-char remark
Show marketing remark (389 chars)
3/2 Home Available in Foster Meadows! Large eat in kitchen with plenty of cabinet space. Living room with lots of windows for natural light. Stove, refrigerator and dishwasher included. Spacious bedrooms with no carpet! Master suite features walk in closet, garden tub and separate shower. Good sized yard. Detached one car garage. Needs repair but could be a great investment opportunity!
-
2026-01-09price $105,000 389-char remark
Show marketing remark (389 chars)
3/2 Home Available in Foster Meadows! Large eat in kitchen with plenty of cabinet space. Living room with lots of windows for natural light. Stove, refrigerator and dishwasher included. Spacious bedrooms with no carpet! Master suite features walk in closet, garden tub and separate shower. Good sized yard. Detached one car garage. Needs repair but could be a great investment opportunity!
-
2025-11-01price $125,000 389-char remark
Show marketing remark (389 chars)
3/2 Home Available in Foster Meadows! Large eat in kitchen with plenty of cabinet space. Living room with lots of windows for natural light. Stove, refrigerator and dishwasher included. Spacious bedrooms with no carpet! Master suite features walk in closet, garden tub and separate shower. Good sized yard. Detached one car garage. Needs repair but could be a great investment opportunity!
-
2025-09-20price $135,000 389-char remark
Show marketing remark (389 chars)
3/2 Home Available in Foster Meadows! Large eat in kitchen with plenty of cabinet space. Living room with lots of windows for natural light. Stove, refrigerator and dishwasher included. Spacious bedrooms with no carpet! Master suite features walk in closet, garden tub and separate shower. Good sized yard. Detached one car garage. Needs repair but could be a great investment opportunity!
-
2025-06-02$150,000 New 389-char remark
Show marketing remark (389 chars)
3/2 Home Available in Foster Meadows! Large eat in kitchen with plenty of cabinet space. Living room with lots of windows for natural light. Stove, refrigerator and dishwasher included. Spacious bedrooms with no carpet! Master suite features walk in closet, garden tub and separate shower. Good sized yard. Detached one car garage. Needs repair but could be a great investment opportunity!
-
2007-08-06soldstatus
-
2007-08-01soldstatus 348-char remark
Show marketing remark (348 chars)
CLEAN AND WELL MAITAINED. GREAT COMMUNITY. WALKING DISTANCE TO ELEMENTARY SCHOOL. CLOSE TO FREEWAYS 410,I-10,37, COMMERCIAL CENTERS, SHOPPING COMPLEX ETC. OPEN FLOOR PLAN. READY TO MOVE IN. SPACIOUS, OPEN FLOOR PLAN. BRIGHT AND SUNNY ROOMS. BEAUTIFUL GARDEN TUB IN MASTERS BEDROOM WITH SEPARATE SHOWER AND LARGE WALK IN CLOSETS. LARGE UTILITY ROOM.
-
2007-06-18historical 348-char remark
Show marketing remark (348 chars)
CLEAN AND WELL MAITAINED. GREAT COMMUNITY. WALKING DISTANCE TO ELEMENTARY SCHOOL. CLOSE TO FREEWAYS 410,I-10,37, COMMERCIAL CENTERS, SHOPPING COMPLEX ETC. OPEN FLOOR PLAN. READY TO MOVE IN. SPACIOUS, OPEN FLOOR PLAN. BRIGHT AND SUNNY ROOMS. BEAUTIFUL GARDEN TUB IN MASTERS BEDROOM WITH SEPARATE SHOWER AND LARGE WALK IN CLOSETS. LARGE UTILITY ROOM.
-
2006-12-11$86,900 348-char remark
Show marketing remark (348 chars)
CLEAN AND WELL MAITAINED. GREAT COMMUNITY. WALKING DISTANCE TO ELEMENTARY SCHOOL. CLOSE TO FREEWAYS 410,I-10,37, COMMERCIAL CENTERS, SHOPPING COMPLEX ETC. OPEN FLOOR PLAN. READY TO MOVE IN. SPACIOUS, OPEN FLOOR PLAN. BRIGHT AND SUNNY ROOMS. BEAUTIFUL GARDEN TUB IN MASTERS BEDROOM WITH SEPARATE SHOWER AND LARGE WALK IN CLOSETS. LARGE UTILITY ROOM.
-
2006-12-05soldstatus
-
2006-10-20$60,000
-
2004-03-24soldstatus
-
2004-03-16soldstatus
-
2003-03-27$66,200
ⓘ Source: listings_history table (triggers on properties + properties_extension) + one-shot
backfill from property_details.listing_events for pre-trigger history.
Tax reassessment forecast TX · Resets to sale price
- Current annual tax
- $2,243 · $187/mo
- Projected year-2 tax
- $2,243 · $187/mo
- Expected delta
- $0/yr ($0/mo · 0.0%)
ⓘ Screening estimate from a state-policy table — verify with the county assessor before closing.
Climate risk First Street
- Flood 1/10 Low FEMA zone X (unshaded) · 0% chance over 30 yrs
- Wildfire 4/10 Moderate
- Heat 8/10 Severe 7 d/yr ≥110°F today · 23 d/yr by 30 yrs out
- Wind 8/10 Severe 80% chance of damaging wind over 30 yrs
- Air quality 2/10 Low 0 unhealthy d/yr today · 2 by 30 yrs out
Nearby sold comps map
Loading sold comps map…
Walkable amenities ~0.75 mi
Loading nearby amenities…
Taxation est. · year 1
- Rental income
- $20,313
- − Mortgage interest
- −$5,546
- − Property taxes
- −$2,243
- − Insurance
- −$495
- − Repairs & maintenance
- −$1,625
- − Management
- −$1,625
- − Depreciation
- −$2,880
- Taxable income
- $5,900
- Est. tax owed @ 24.0%
- −$1,416
- After-tax cash flow
- $5,664/yr
For passive investors: Depreciation is non-cash, so a rental often shows a tax loss while cash-flowing — sheltering income. Rental losses are passive: they offset passive income freely, and up to $25,000/yr can offset ordinary (W-2) income if you actively participate and your MAGI is under $100k (phasing out to $0 by $150k); unused losses carry forward. On sale, claimed depreciation is recaptured at up to 25%, and gains may owe capital-gains tax (a 1031 exchange can defer both). Figures are a year-1 estimate at your 24.0% rate — not tax advice; consult a CPA.
Schools (NCES district)
- District
- East Central ISD
- NCES district ID
- 4817850
- Math proficiency
- 16% ▼ -12.00%
- Reading proficiency
- 25% ▼ -6.00%
- Median HH income
- $53,941
- Composite
- 18.67/100
- National rank
- #8887
- State rank
- #758 of 826 in TX
Livability — San Antonio
- Score
- 80/100
- State rank
- #31
- US rank
- #1616
Category grades
Schools grade is shown separately in the Schools card above.
Census & demographics
- Census place
- San Antonio, TX
- County
- Bexar County · 1,990,555 people
- City population
- 1,806,925
- Metro
- San Antonio-New Braunfels, TX
- Population (ZIP)
- 26,476
- Household income
- $66,362
- Rent vs Own
- Severe rent burden
- 686.0
Population outlook (Bexar County) Hauer SSP2
- Today (2025)
- 2,336,851 people
- By 2030
- 2,560,728 · +9.6%
- By 2040
- 3,020,569 · +29.3%
- By 2050
- 3,493,522 · +49.5%
- By 2075
- 4,668,459 · +99.8%
- By 2100
- 5,533,242 · +136.8%
Race, ethnicity, and origin ACS 2023
- Neighborhood character
- Majority Hispanic (64%)
- Race & ethnicity
- Hispanic / Latino 64% Two or more races 26% White 19% Black 14% Asian 1%
- Hispanic origin (detail)
- Mexican 55%
- Common ancestry
- Romanian 1% Italian 1% Slovak 1%
- Foreign-born
- 14% · Canada
- Languages at home
- 61% English-only · Spanish 37% Arabic 1%
Political lean MEDSL · Bexar
- 2024 margin
- Lean D (+9.8) · D 54.3% · R 44.6% · Other 1.1%
- 2008→2024 swing
- +4.2pp toward D · 2008: 5.6pp · 2024: 9.8pp
- All cycles
- 2024: D+9.8 2020: D+18.2 2016: D+13.5 2012: D+4.6 2008: D+5.6
Not yet ingested
- Civics
- —
Market trends
- HPI YoY
- ▼ -14.18%
- Current HPI
- 278.8429
- Rent YoY
- ▲ 4.35%
- Metro
- San Antonio-New Braunfels, TX
- State GDP YoY
- ▲ 3.95%
- F500 in state
- 110
Industry mix (Fortune 500 HQ in TX)
| Industry | F500 HQs | Revenue |
|---|---|---|
| Energy | 16 | $1,198B |
|
||
| Technology | 5 | $198B |
|
||
| Engineering / Construction | 4 | $72B |
|
||
| Energy Services | 3 | $60B |
|
||
| Utilities | 3 | $41B |
|
||
| Healthcare | 2 | $330B |
|
||
Price history
+49.5% since first listed14 events — show timeline
- 2026-04-27 Price Changed $99,000 LERA
- 2026-01-09 Price Changed $105,000 LERA
- 2025-11-01 Price Changed $125,000 LERA
- 2025-09-20 Price Changed $135,000 LERA
- 2025-06-02 Listed $150,000 LERA
- 2007-08-06 Sold (Public Records) — Public Records
- 2007-08-01 Sold (MLS) — LERA
- 2007-06-18 Listing Removed — LERA
- 2006-12-11 Listed $86,900 LERA
- 2006-12-05 Sold (MLS) — LERA
- 2006-10-20 Listed $60,000 LERA
- 2004-03-24 Sold (Public Records) — Public Records
- 2004-03-16 Sold (MLS) — LERA
- 2003-03-27 Listed $66,200 LERA
Property tax history
+3.3%/yrLatest (2025): $2,243 · +1.8% YoY. Source: county tax records.
Cash-flow waterfall
monthlySold comps — $/sqft
last 12 mo · ≤1 miLoading sold comps…