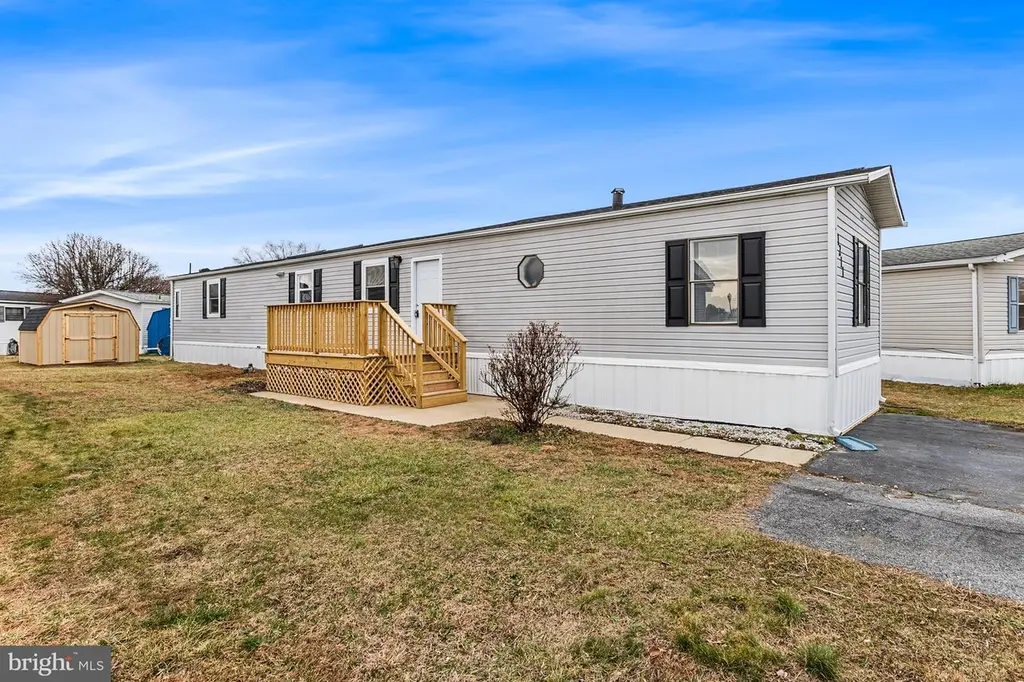
1211 Donna Marie Way · Bear, DE
Flood risk No data
- FEMA flood zone
- —
- Chance of flooding over 30 yrs
- —
- Est. flood insurance / yr
- —
Fire risk No data
- Est. fire insurance / yr
- —
Heat risk No data
- Hot days now (above threshold)
- —
- Hot days in 30 yrs
- —
Wind risk No data
- Chance of severe wind over 30 yrs
- —
Air-quality risk No data
- Unhealthy air days now
- —
- Unhealthy air days in 30 yrs
- —
Risk factors via First Street. Map © Google.
Why this score? — see what drove the C+ grade
The composite is a weighted blend of 9 inputs, each scored 0–100. Each bar is that input's sub-score; the figure is the points it added to the 100-point composite (weight × sub-score).
- Cash flow +30.0/30.0
- 1% rule +10.0/10.0
- DSCR +10.0/10.0
- Rent growth +4.8/5.0
- Livability +3.7/5.0
- Schools +2.5/10.0
- Condition / age +2.5/5.0
- ARV discount +0.0/15.0
- Appreciation +0.0/10.0
$75,000
🖨 Deal sheet (PDF) 📄 Offer letter ✓ Due diligence
Listing remarks
Beautifully updated 3-bedroom, 2-bath home located in Waterford Mobile Home Park. This property has been fully remodeled inside and out and is truly move-in ready. Features include a spacious open-concept layout, updated kitchen with abundant cabinetry, renovated bathrooms, new flooring throughout, fresh interior finishes, and central A/C for year-round comfort. Enjoy outdoor living with a large front deck, private driveway, and storage shed. Conveniently located just minutes from shopping, dining, and everyday amenities, with quick 2-minute access to Route 95; ideal for commuters. A great opportunity for affordable homeownership in a well-maintained community. :: Hermosa casa de 3 habitac
Key facts
- Renovated bathrooms
- Private driveway
- New flooring
Tags
Property features AI
Finance
- Other: Not in a federal flood zone; Outside city limits; Directions: From US-40 (Pulaski Hwy), turn onto Donna Marie Way. Follow road into Waterford Mobile Home Park to 1211 Donna Marie Way.
- Financial info: Annual ground rent noted
- HOA & community: Ground rent of $1,090 paid monthly; Property manager present
Exterior
- Parking: 2 total garage/parking spaces; Driveway with 2 spaces
- Utilities: Public water; Public sewer
- Home design: Manufactured property; Modular/Manufactured construction; Shingle roof; Ground rent ownership
- Construction: Manufactured structure; Shingle roof; Above-grade finished area (estimated)
- Exterior features: Paved, private parking
Interior
- Bedrooms: 3 bedrooms on the main level
- Flooring: Laminate plank
- Bathrooms: 2 full bathrooms on the main level
- Heating & cooling: Heat pump heating; Central air conditioning; Electric heating and cooling; Propane hot water
- Interior features: Laminate plank flooring; No basement; Estimated living area
Neighborhood map
What this means for you Summary
Snapshot
- This is a 3-bed/2.0-bath other listed at $75k.
Deal economics
- At list price, monthly cash flow is $2k ($19k/yr) — positive.
- The deal already cash-flows at list — no discount required.
- Meets the 1% rule at list price ($3k rent vs $75k).
- Cap rate 32.0% vs local median 4.7% in Bear — top-decile yield for the area; either an underpriced asset or a hidden risk that comps aren't pricing in. Stress-test before assuming the spread holds.
Location & tenants
- Location reads 73/100 on livability (#8 in DE) — a middle-class / working-renter tenant base. Strengths: housing A+, employment A-, cost of living A-; Watch: crime C-, amenities F, commute F.
- Christina School District (suburban): math 22% / reading 33% proficiency, ranked #18 of 26 in DE (top 69%) — low school quality limits family demand, transient renter base, plan for 1-2y turnover.
- Zoned schools: Oberle (William) Elementary School (math 7% / reading 20%, grade F, #95 of 105 statewide, top 90%, 543 students, 0% FRL); Gauger-Cobbs Middle School (math 11% / reading 26%, grade F, #30 of 36 statewide, top 86%, 779 students, 0% FRL); Glasgow High School (math 8% / reading 17%, grade F, #36 of 40 statewide, top 90%, 895 students, 0% FRL) — zoned schools average 0% FRL vs 50% district-wide (50 pts lower); this property's tenant base skews higher-income than the district average.
- Zoned-school proficiency averages 15% at this address vs 28% district-wide (-13 pts) — the specific schools serving this property underperform the Christina School District average; the district grade overstates school quality for this exact location.
- Market conditions: Rents rising fast (+9.0%/yr); 112 active listings in the ZIP; 8 comparable units currently listed for rent nearby; rentals leasing fast (median 1d on market — plan ~1-2 weeks tenant-placement turnaround); high-income renter base; 1,367 units permitted in New Castle County in 2024 (201 in 5+ unit buildings).
Forward outlook
- Local home prices are declining (-3.0%/yr); year-one equity from $519 of loan paydown is wiped out by about $2k of value loss. Plan a longer hold.
- New Castle County population projected at +9% by 2050 — modest demand growth; plan on rents tracking national, not racing it.
- At projected returns (-3.0% appreciation + 8.0% rent growth), your $21k cash investment doubles in ~2 years — after that, you're playing with house money.
Negotiation context
- Only 3 days on market — expect competitive offers; lowballing is unlikely to land.
- 3 sale attempts; this cycle's ask has dropped $10k (12%) from the opening price — seller is motivated, your offer sets the floor, not the list.
Questions for the listing agent
- Is there a deadline driving the sale (1031 exchange, divorce, estate, relocation)? That informs how much negotiation room exists.
- Schools are D-rated, which usually means shorter tenancies and higher turnover. Who's the typical renter profile here, and what's been the actual vacancy rate?
- What's the average days-on-market for RENTAL listings here right now (not sales)? A rising rental-DOM trend means longer vacancies and softer asking-rent achievability than the comps imply.
- What's the recent tenant-quality profile in this submarket — average credit score on applications, eviction rate, late-payment / NSF rate, and stable-employment percentage? A property-management company in the area should have these aggregated.
- How much new for-sale + rental construction is in the pipeline within 1–3 miles? Heavy new supply typically softens prices + rents 12–24 months out; constrained supply supports both.
Investment metrics
- 1% rule
- 3.49% ✓
- Cap rate
- 32.04%
- Cash-on-cash
- 91.94%
- DSCR
- 5.09
- GRM
- 2.4
CMA / ARV
- ARV (median comp)
- $61,709
- List price
- $75,000
- Delta
- 35.31%
- Verdict
- OVERPRICED
- Comps
- 20 within 1.0 mi
Projected returns pro-forma
-3.0% appreciation · 8.0% rent growth · sell at horizon
- IRR
- 98.1%
- Equity multiple
- 5.96×
- Total profit
- $104,142
- Equity at exit
- $11,183
- IRR
- —
- Equity multiple
- 14.60×
- Total profit
- $285,548
- Equity at exit
- $6,485
Cash invested: $21,000 (down + closing). Projections, not guarantees.
Landlord ↔ Tenant lean methodology
- Overall (STATE)
- 70 Landlord-Friendly
- State Delaware
- 70 Landlord-Friendly · D+7
- County
- — inherits STATE
- City
- — inherits STATE
ZIP-level market 19701
- Rents YoY
- 9.0%
- Active inventory
- 112
- Price-to-rent
- 2.4×
Monthly cashflow live
- Estimated rent
- $2,615 high interval (Pro) →
- Mortgage (P&I)
- −$393
- Tax from tax record
- −$33 /mo · $392/yr
- Insurance
- −$31
- HOA
- −$0
- Vacancy / Maint / Mgmt
- −$549
- Net cashflow
- $1,609
Break-even live
Sensitivity live
| Price | -10% $1,651 | -5% $1,630 | +0% $1,609 | +5% $1,588 | +10% $1,566 |
|---|---|---|---|---|---|
| Rent | -10% $1,402 | -5% $1,506 | +0% $1,609 | +5% $1,712 | +10% $1,816 |
| Rate | -1.0pp $1,647 | -0.5pp $1,628 | base $1,609 | +0.5pp $1,589 | +1.0pp $1,570 |
UW: 25.0% down · 7.5% · 30yr · 1.5% tax · 5.0% vac · 8.0% maint · 8.0% mgmt
Financing live
Cash to close
- Down payment
- $18,750
- Closing costs
- $2,250
- Reserves months
- —
- Total cash needed
- —
Loan-product check · same deal, 3 products live
Conventional
25% down · 7.5% · 30yr
- Down + closing
- —
- Monthly P&I
- —
- Monthly cashflow
- —
- DSCR
- —
- Eligible?
- —
Personal DTI + credit; lowest rate.
DSCR
20% down · 8.5% · 30yr
- Down + closing
- —
- Monthly P&I
- —
- Monthly cashflow
- —
- DSCR
- —
- Eligible?
- —
No personal income docs; deal must DSCR.
Hard money
10% down · 12.0% · 12mo
- Down + closing
- —
- Monthly P&I
- —
- Monthly cashflow
- —
- DSCR
- —
- Eligible?
- —
Short-term bridge; refi at stabilization.
Rent comps 8 comps
| Address | Beds | Baths | Sqft | Rent | $/sqft | DOM | Units | Dist |
|---|---|---|---|---|---|---|---|---|
| 1 Kennedy Cir Bear, DE | 2.0–3.0 | 2.0–3.0 | 1702 | $3,315 | $1.95 | 0d | 34 | 0.41mi |
| 885 Salem Church Rd Newark, DE | 1.0–2.0 | 1.0–2.0 | 850 | $1,795 | $2.11 | 0d | 1 | 0.49mi |
| 10 McFarland Dr Newark, DE | 1.0–2.0 | 1.0–2.0 | 955 | $2,125 | $2.22 | 0d | 3 | 0.79mi |
| 50 Turnberry Ct Bear, DE | 1.0–3.0 | 1.0–3.0 | 1598 | $3,400 | $2.13 | 0d | 195 | 0.80mi |
| 2102 Ashkirk Dr Newark, DE | 1.0–2.0 | 1.0–2.0 | 880 | $1,795 | $2.04 | 0d | 6 | 1.00mi |
| 138 Creekside Ct Newark, DE | 2.0 | 2.5 | 1225 | $2,200 | $1.80 | 45d | 1 | 1.30mi |
| 182 Darling St Newark, DE | 3.0 | 2.5 | 1345 | $2,450 | $1.82 | 45d | 1 | 1.40mi |
| 2139 Valence Pl Newark, DE | 2.0–3.0 | 2.0 | 1183 | $2,505 | $2.12 | 17d | 6 | 1.41mi |
Listing history 8 events
-
2026-06-21pricedays on market $75,000 Active 3 DOM
-
2026-06-18pricedays on market $85,000 Active 1 DOM
-
2026-06-01days on market $79,900 Active 132 DOM
-
2026-05-31days on market $79,900 Active 131 DOM
-
2026-05-08price $83,500 1473-char remark
-
2026-04-02status Active 1473-char remark
-
2026-03-30status Pending 1473-char remark
-
2026-01-17$85,000 Active 1473-char remark
ⓘ Source: listings_history table (triggers on properties + properties_extension) + one-shot
backfill from property_details.listing_events for pre-trigger history.
Tax reassessment forecast DE · Partial reset (capped growth)
- Current annual tax
- $392 · $33/mo
- Projected year-2 tax
- $413 · $34/mo
- Expected delta
- +$22/yr (+$2/mo · 5.5%)
ⓘ Screening estimate from a state-policy table — verify with the county assessor before closing.
Nearby sold comps map
Loading sold comps map…
Walkable amenities ~0.75 mi
Loading nearby amenities…
Taxation est. · year 1
- Rental income
- $31,384
- − Mortgage interest
- −$4,201
- − Property taxes
- −$392
- − Insurance
- −$375
- − Repairs & maintenance
- −$2,511
- − Management
- −$2,511
- − Depreciation
- −$2,182
- Taxable income
- $19,213
- Est. tax owed @ 24.0%
- −$4,611
- After-tax cash flow
- $14,696/yr
For passive investors: Depreciation is non-cash, so a rental often shows a tax loss while cash-flowing — sheltering income. Rental losses are passive: they offset passive income freely, and up to $25,000/yr can offset ordinary (W-2) income if you actively participate and your MAGI is under $100k (phasing out to $0 by $150k); unused losses carry forward. On sale, claimed depreciation is recaptured at up to 25%, and gains may owe capital-gains tax (a 1031 exchange can defer both). Figures are a year-1 estimate at your 24.0% rate — not tax advice; consult a CPA.
Schools (NCES district)
- District
- Christina School District
- NCES district ID
- 1000200
- Math proficiency
- 22% ▼ -12.00%
- Reading proficiency
- 33% ▼ -5.00%
- Median HH income
- $58,838
- Composite
- 24.93/100
- National rank
- #7567
- State rank
- #18 of 26 in DE
Livability — Bear
- Score
- 73/100
- State rank
- #8
- US rank
- #5158
Category grades
Schools grade is shown separately in the Schools card above.
Census & demographics
- Census place
- Bear, DE
- County
- New Castle County · 483,412 people
- City population
- 42,984
- Metro
- Philadelphia-Camden-Wilmington, PA-NJ-DE-MD
- Population (ZIP)
- 42,984
- Household income
- $111,198
- Rent vs Own
- Severe rent burden
- 619.0
Population outlook (New Castle County) Hauer SSP2
- Today (2025)
- 594,686 people
- By 2030
- 609,164 · +2.4%
- By 2040
- 632,154 · +6.3%
- By 2050
- 649,068 · +9.1%
- By 2075
- 687,771 · +15.7%
- By 2100
- 694,961 · +16.9%
Race, ethnicity, and origin ACS 2023
- Neighborhood character
- Diverse neighborhood (Simpson 0.67)
- Race & ethnicity
- White 50% Black 26% Hispanic / Latino 11% Asian 10% Two or more races 7%
- Hispanic origin (detail)
- Mexican 4% Puerto Rican 4%
- Common ancestry
- Romanian 4% Lithuanian 2% Slovak 1%
- Foreign-born
- 17% · Canada, China, Vietnam
- Languages at home
- 78% English-only · Spanish 8% Other Asian/Pacific 3% Other Indo-European 3%
Political lean MEDSL · New Castle
- 2024 margin
- Solid D (+32.6) · D 65.5% · R 32.9% · Other 1.6%
- 2008→2024 swing
- -8.1pp toward R · 2008: 40.6pp · 2024: 32.6pp
- All cycles
- 2024: D+32.6 2020: D+37.1 2016: D+29.6 2012: D+34.1 2008: D+40.6
Not yet ingested
- Civics
- —
Market trends
- HPI YoY
- ▼ -159.00%
- Current HPI
- 261.2988
- Rent YoY
- ▲ 9.03%
- Metro
- Philadelphia-Camden-Wilmington, PA-NJ-DE-MD
- State GDP YoY
- —
- F500 in state
- 0
Price history
-11.8% since first listed8 events — show timeline
- 2026-06-19 Price Changed $75,000 BRIGHT MLS
- 2026-06-18 Listed $85,000 BRIGHT MLS
- 2026-06-01 Listing Removed — BRIGHT MLS
- 2026-05-28 Price Changed $79,900 BRIGHT MLS
- 2026-05-08 Price Changed $83,500 BRIGHT MLS
- 2026-04-02 Relisted — BRIGHT MLS
- 2026-03-30 Pending — BRIGHT MLS
- 2026-01-17 Listed $85,000 BRIGHT MLS
Property tax history
-6.6%/yrLatest (2024): $392 · +2.8% YoY. Source: county tax records.
Cash-flow waterfall
monthlySold comps — $/sqft
last 12 mo · ≤1 miLoading sold comps…