1457 Pine Grove School Rd · London, KY
Flood risk 1/10 · Minimal
- FEMA flood zone
- X (unshaded)
- Chance of flooding over 30 yrs
- 0.0%
- Est. flood insurance / yr
- $473 – $860
Fire risk 6/10 · Moderate
- Est. fire insurance / yr
- $839 – $1,559
Heat risk 4/10 · Minor
- Hot days now (above 101°F)
- 7 days/yr
- Hot days in 30 yrs
- 19 days/yr
Wind risk 2/10 · Minimal
- Chance of severe wind over 30 yrs
- 4.0%
Air-quality risk 2/10 · Minimal
- Unhealthy air days now
- 0 days/yr
- Unhealthy air days in 30 yrs
- 1 days/yr
Risk factors via First Street. Map © Google.
Why this score? — see what drove the B grade
The composite is a weighted blend of 9 inputs, each scored 0–100. Each bar is that input's sub-score; the figure is the points it added to the 100-point composite (weight × sub-score).
- Cash flow +30.0/30.0
- 1% rule +10.0/10.0
- DSCR +10.0/10.0
- ARV discount +7.5/15.0
- Schools +4.4/10.0
- Livability +3.4/5.0
- Rent growth +2.5/5.0
- Condition / age +2.5/5.0
- Appreciation +0.0/10.0
$69,900
🖨 Deal sheet (PDF) 📄 Offer letter ✓ Due diligence
Listing remarks MLS
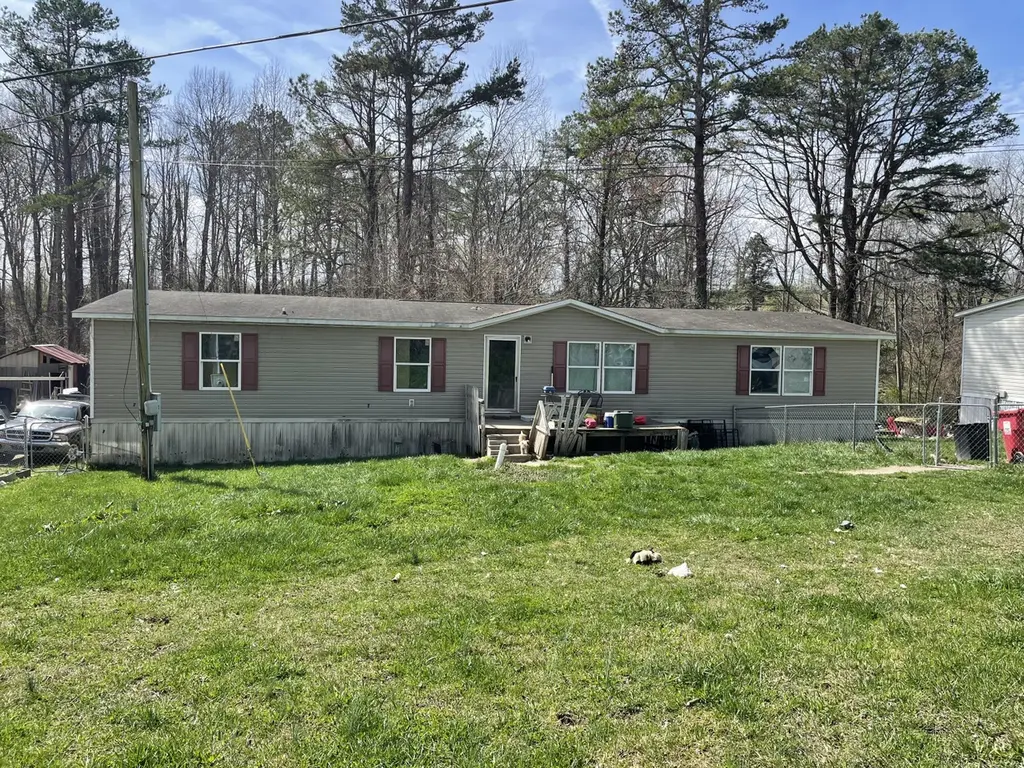
Handyman / investor special! This 2014 double wide home offers over 2,000 sq ft of living space with 4 bedrooms and 2 bathrooms, situated on approximately 0.3 acres. The property has great potential and just needs a little TLC to bring it back to its full potential. With its spacious layout, this home would make a great investment opportunity, rental property, or affordable project for someone looking to add their own touch. Sold AS IS - Cash or Convectional finance only
Key facts
- 0.32 acre lot
- Built 2014
- Listed 52 days
Neighborhood map
What this means for you Summary
Snapshot
- This is a 4-bed/2.0-bath manufactured listed at $70k.
Deal economics
- At list price, monthly cash flow is $576 ($7k/yr) — positive.
- The deal already cash-flows at list — no discount required.
- Meets the 1% rule at list price ($1k rent vs $70k).
- Recommended offer: $68k (3.0% below list) — sets the bar for market timing.
- Cap rate 16.2% vs local median 2.3% in London — top-decile yield for the area; either an underpriced asset or a hidden risk that comps aren't pricing in. Stress-test before assuming the spread holds.
Location & tenants
- Location reads 68/100 on livability (#202 in KY) — a middle-class / working-renter tenant base. Strengths: cost of living A+, housing A+, health & safety B+; Watch: schools D+, employment D+, amenities F.
- Laurel County (town): math 51% / reading 56% proficiency, ranked #8 of 165 in KY (top 5%) — acceptable for families but not a draw, mixed tenant base, ~2y average lease.
- Market conditions: 175 active listings in the ZIP; 16 units permitted in Laurel County in 2024 (0 in 5+ unit buildings).
Forward outlook
- Local home prices are declining (-3.0%/yr); year-one equity from $483 of loan paydown is wiped out by about $2k of value loss. Plan a longer hold.
- At projected returns (-3.0% appreciation + 3.0% rent growth), your $20k cash investment doubles in ~4 years — after that, you're playing with house money.
Negotiation context
- It's been on market 52 days — a 3% lower offer ($68k) is reasonable based on typical stale-listing flexibility.
- 2 sale attempts; this cycle's ask has dropped $9k (12%) from the opening price — seller is motivated, your offer sets the floor, not the list.
Risks & watch-outs
- Climate carrying-cost: major wildfire risk — expect insurance premiums to compound above CPI over the hold.
Questions for the listing agent
- It's been on market 52 days. Have you received any prior offers? Is the seller open to a 3% concession, seller financing, or rate buy-down credit?
- Is there a deadline driving the sale (1031 exchange, divorce, estate, relocation)? That informs how much negotiation room exists.
- Schools are D-rated, which usually means shorter tenancies and higher turnover. Who's the typical renter profile here, and what's been the actual vacancy rate?
- What's the average days-on-market for RENTAL listings here right now (not sales)? A rising rental-DOM trend means longer vacancies and softer asking-rent achievability than the comps imply.
- What's the recent tenant-quality profile in this submarket — average credit score on applications, eviction rate, late-payment / NSF rate, and stable-employment percentage? A property-management company in the area should have these aggregated.
- How much new for-sale + rental construction is in the pipeline within 1–3 miles? Heavy new supply typically softens prices + rents 12–24 months out; constrained supply supports both.
Investment metrics
- 1% rule
- 1.85% ✓
- Cap rate
- 16.18%
- Cash-on-cash
- 35.30%
- DSCR
- 2.57
- GRM
- 4.5
CMA / ARV
- ARV (median comp)
- $262,407
- List price
- $69,900
- Delta
- -73.36%
- Verdict
- UNDERPRICED
- Comps
- 20 within 1.0 mi
Projected returns pro-forma
-3.0% appreciation · 3.0% rent growth · sell at horizon
- IRR
- 30.9%
- Equity multiple
- 2.29×
- Total profit
- $25,335
- Equity at exit
- $10,422
- IRR
- 38.1%
- Equity multiple
- 4.54×
- Total profit
- $69,257
- Equity at exit
- $6,044
Cash invested: $19,572 (down + closing). Projections, not guarantees.
Landlord ↔ Tenant lean methodology
- Overall (STATE)
- 83 Strongly Landlord-Friendly
- State Kentucky
- 83 Strongly Landlord-Friendly · R+16
- County
- — inherits STATE
- City
- — inherits STATE
ZIP-level market 40744
- Home prices YoY
- -13.0%
- Active inventory
- 175
- Price-to-rent
- 4.5×
Monthly cashflow live
- Estimated rent
- $1,291 medium interval (Pro) →
- Mortgage (P&I)
- −$367
- Tax from tax record
- −$49 /mo · $584/yr
- Insurance
- −$29
- HOA
- −$0
- Vacancy / Maint / Mgmt
- −$271
- Net cashflow
- $576
Break-even live
Sensitivity live
| Price | -10% $615 | -5% $595 | +0% $576 | +5% $556 | +10% $536 |
|---|---|---|---|---|---|
| Rent | -10% $474 | -5% $525 | +0% $576 | +5% $627 | +10% $678 |
| Rate | -1.0pp $611 | -0.5pp $593 | base $576 | +0.5pp $558 | +1.0pp $539 |
UW: 25.0% down · 7.5% · 30yr · 1.5% tax · 5.0% vac · 8.0% maint · 8.0% mgmt
Financing live
Cash to close
- Down payment
- $17,475
- Closing costs
- $2,097
- Reserves months
- —
- Total cash needed
- —
Loan-product check · same deal, 3 products live
Conventional
25% down · 7.5% · 30yr
- Down + closing
- —
- Monthly P&I
- —
- Monthly cashflow
- —
- DSCR
- —
- Eligible?
- —
Personal DTI + credit; lowest rate.
DSCR
20% down · 8.5% · 30yr
- Down + closing
- —
- Monthly P&I
- —
- Monthly cashflow
- —
- DSCR
- —
- Eligible?
- —
No personal income docs; deal must DSCR.
Hard money
10% down · 12.0% · 12mo
- Down + closing
- —
- Monthly P&I
- —
- Monthly cashflow
- —
- DSCR
- —
- Eligible?
- —
Short-term bridge; refi at stabilization.
Listing history 9 events
-
2026-06-04days on market $69,900 Active 52 DOM
-
2026-06-02days on market $69,900 Active 51 DOM
-
2026-06-01days on market $69,900 Active 50 DOM
-
2026-05-31days on market $69,900 Active 49 DOM
-
2026-05-31days on market $69,900 Active 48 DOM
-
2026-04-30price $69,900 475-char remark
Show marketing remark (475 chars)
Handyman / investor special! This 2014 double wide home offers over 2,000 sq ft of living space with 4 bedrooms and 2 bathrooms, situated on approximately 0.3 acres. The property has great potential and just needs a little TLC to bring it back to its full potential. With its spacious layout, this home would make a great investment opportunity, rental property, or affordable project for someone looking to add their own touch. Sold AS IS - Cash or Convectional finance only
-
2026-04-16status Active 475-char remark
Show marketing remark (475 chars)
Handyman / investor special! This 2014 double wide home offers over 2,000 sq ft of living space with 4 bedrooms and 2 bathrooms, situated on approximately 0.3 acres. The property has great potential and just needs a little TLC to bring it back to its full potential. With its spacious layout, this home would make a great investment opportunity, rental property, or affordable project for someone looking to add their own touch. Sold AS IS - Cash or Convectional finance only
-
2026-03-20historical 475-char remark
Show marketing remark (475 chars)
Handyman / investor special! This 2014 double wide home offers over 2,000 sq ft of living space with 4 bedrooms and 2 bathrooms, situated on approximately 0.3 acres. The property has great potential and just needs a little TLC to bring it back to its full potential. With its spacious layout, this home would make a great investment opportunity, rental property, or affordable project for someone looking to add their own touch. Sold AS IS - Cash or Convectional finance only
-
2026-03-16$79,000 Active 475-char remark
Show marketing remark (475 chars)
Handyman / investor special! This 2014 double wide home offers over 2,000 sq ft of living space with 4 bedrooms and 2 bathrooms, situated on approximately 0.3 acres. The property has great potential and just needs a little TLC to bring it back to its full potential. With its spacious layout, this home would make a great investment opportunity, rental property, or affordable project for someone looking to add their own touch. Sold AS IS - Cash or Convectional finance only
ⓘ Source: listings_history table (triggers on properties + properties_extension) + one-shot
backfill from property_details.listing_events for pre-trigger history.
Tax reassessment forecast KY · Resets to sale price
- Current annual tax
- $584 · $49/mo
- Projected year-2 tax
- $601 · $50/mo
- Expected delta
- +$18/yr (+$1/mo · 3.0%)
ⓘ Screening estimate from a state-policy table — verify with the county assessor before closing.
Climate risk First Street
- Flood 1/10 Low FEMA zone X (unshaded) · 0% chance over 30 yrs
- Wildfire 6/10 Major
- Heat 4/10 Moderate 7 d/yr ≥101°F today · 19 d/yr by 30 yrs out
- Wind 2/10 Low 4% chance of damaging wind over 30 yrs
- Air quality 2/10 Low 0 unhealthy d/yr today · 1 by 30 yrs out
Nearby sold comps map
Loading sold comps map…
Walkable amenities ~0.75 mi
Loading nearby amenities…
Taxation est. · year 1
- Rental income
- $15,494
- − Mortgage interest
- −$3,915
- − Property taxes
- −$584
- − Insurance
- −$350
- − Repairs & maintenance
- −$1,239
- − Management
- −$1,239
- − Depreciation
- −$2,033
- Taxable income
- $6,133
- Est. tax owed @ 24.0%
- −$1,472
- After-tax cash flow
- $5,436/yr
For passive investors: Depreciation is non-cash, so a rental often shows a tax loss while cash-flowing — sheltering income. Rental losses are passive: they offset passive income freely, and up to $25,000/yr can offset ordinary (W-2) income if you actively participate and your MAGI is under $100k (phasing out to $0 by $150k); unused losses carry forward. On sale, claimed depreciation is recaptured at up to 25%, and gains may owe capital-gains tax (a 1031 exchange can defer both). Figures are a year-1 estimate at your 24.0% rate — not tax advice; consult a CPA.
Schools (NCES district)
- District
- Laurel County
- NCES district ID
- 2103210
- Math proficiency
- 51% ▼ -9.00%
- Reading proficiency
- 56% ▼ -11.00%
- Median HH income
- $36,577
- Composite
- 44.39/100
- National rank
- #2814
- State rank
- #8 of 165 in KY
Livability — London
- Score
- 68/100
- State rank
- #202
- US rank
- #10028
Category grades
Schools grade is shown separately in the Schools card above.
Census & demographics
- Population (ZIP)
- 20,104
Population outlook (Laurel County) Hauer SSP2
- Today (2025)
- 62,602 people
- By 2030
- 63,310 · +1.1%
- By 2040
- 63,706 · +1.8%
- By 2050
- 62,705 · +0.2%
- By 2075
- 58,574 · -6.4%
- By 2100
- 50,888 · -18.7%
Race, ethnicity, and origin ACS 2023
- Neighborhood character
- Predominantly White (94%)
- Race & ethnicity
- White 94% Two or more races 4% Hispanic / Latino 1%
- Common ancestry
- Italian 2% Serbian 1% Romanian 1%
- Foreign-born
- 2% · China, Canada
- Languages at home
- 98% English-only · Chinese 1% Spanish 0%
Political lean MEDSL · Laurel
- 2024 margin
- Solid R (+69.9) · D 14.5% · R 84.3% · Other 1.2%
- 2008→2024 swing
- -11.9pp toward R · 2008: -58.0pp · 2024: -69.9pp
- All cycles
- 2024: R+69.9 2020: R+66.7 2016: R+69.1 2012: R+63.6 2008: R+58.0
Not yet ingested
- Civics
- —
Market trends
- HPI YoY
- ▼ -40.52%
- Current HPI
- 270.3876
- Rent YoY
- —
- Metro
- —
- State GDP YoY
- ▲ 1.81%
- F500 in state
- 4
Industry mix (Fortune 500 HQ in KY)
| Industry | F500 HQs | Revenue |
|---|---|---|
| Healthcare | 1 | $118B |
|
||
| Food / Beverage | 1 | $7B |
|
||
Price history
-11.5% since first listed4 events — show timeline
- 2026-04-30 Price Changed $69,900 ImagineMLS
- 2026-04-16 Relisted — ImagineMLS
- 2026-03-20 Listing Removed — ImagineMLS
- 2026-03-16 Listed $79,000 ImagineMLS
Property tax history
-0.8%/yrLatest (2025): $584 · +0.9% YoY. Source: county tax records.
Cash-flow waterfall
monthlySold comps — $/sqft
last 12 mo · ≤1 miLoading sold comps…