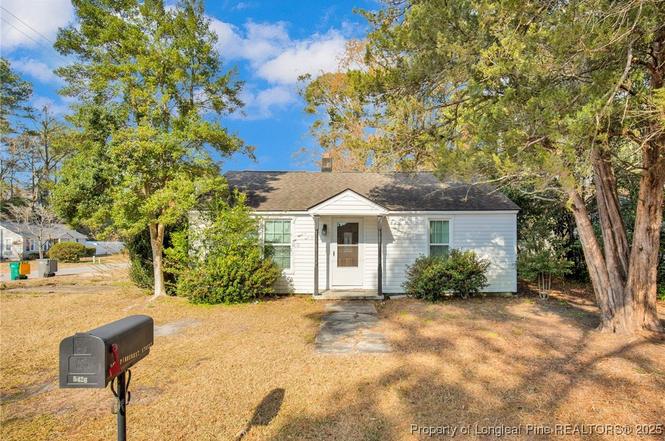
5426 Suncrest Dr · Hope Mills, NC
Flood risk 3/10 · Minor
- FEMA flood zone
- X (unshaded)
- Chance of flooding over 30 yrs
- 0.2%
- Est. flood insurance / yr
- $507 – $1,088
Fire risk 5/10 · Moderate
- Est. fire insurance / yr
- $906 – $1,684
Heat risk 7/10 · Major
- Hot days now (above 106°F)
- 7 days/yr
- Hot days in 30 yrs
- 16 days/yr
Wind risk 7/10 · Major
- Chance of severe wind over 30 yrs
- 78.0%
Air-quality risk 1/10 · Minimal
- Unhealthy air days now
- 0 days/yr
- Unhealthy air days in 30 yrs
- 0 days/yr
Risk factors via First Street. Map © Google.
Why this score? — see what drove the C grade
The composite is a weighted blend of 9 inputs, each scored 0–100. Each bar is that input's sub-score; the figure is the points it added to the 100-point composite (weight × sub-score).
- Cash flow +26.1/30.0
- DSCR +8.8/10.0
- 1% rule +6.9/10.0
- Rent growth +3.6/5.0
- ARV discount +3.4/15.0
- Livability +3.4/5.0
- Schools +3.1/10.0
- Condition / age +2.8/5.0
- Appreciation +0.0/10.0
$105,000
🖨 Deal sheet (PDF) 📄 Offer letter ✓ Due diligence
Listing remarks
Situated on a corner lot, this two-bedroom, one-bath home offers a simple and functional layout. The entrance opens into the living room, which leads directly into the kitchen with an eat-in dining space. The home provides a straightforward floor plan with living and dining areas conveniently connected. Please note that utilities are currently off, and the seller does not intend to have them turned on during the contract period. Home inspection on file. Home being sold as-is. Welcome Home! AGENTS-not a member of MLS? Call Showing Time for access/disclosures. Foreclosure scheduled to start June 9, 2026, Short sale pending approval
Key facts
- Built 1950
- Listed 170 days
Property features AI
Exterior
- Parking: No garage
- Utilities: Public water; Public sewer
- Home design: Single-family residence; Residential property; R10 residential zoning
- Construction: Wood siding
- Exterior features: Front porch; Corner lot
Interior
- Kitchen: Electric range; Refrigerator
- Flooring: Wood flooring
- Bathrooms: 1 full bathroom
- Heating & cooling: Electric heating; Has heating
- Interior features: Eat-in kitchen; 4 total rooms
- Laundry & utility: Washer hookup
Neighborhood map
What this means for you Summary
Snapshot
- This is a 2-bed/1.0-bath single-family listed at $105k. Condition is rated average.
Deal economics
- At list price, monthly cash flow is $264 ($3k/yr) — positive.
- The deal already cash-flows at list — no discount required.
- Meets the 1% rule at list price ($1k rent vs $105k).
- Recommended offer: $92k (12.0% below list) — sets the bar for market timing.
- Cap rate 9.3% vs local median 4.8% in Hope Mills — top-decile yield for the area; either an underpriced asset or a hidden risk that comps aren't pricing in. Stress-test before assuming the spread holds.
Location & tenants
- Location reads 67/100 on livability (#234 in NC) — a middle-class / working-renter tenant base. Strengths: cost of living A+, housing A+, health & safety B+; Watch: crime D-, amenities F, commute F.
- Cumberland County Schools (urban): math 32% / reading 41% proficiency, ranked #126 of 178 in NC (top 71%) — families likely to look elsewhere, expect single-tenant / working-renter base with shorter leases.
- Zoned schools: Ed V Baldwin Elementary (math 19% / reading 27%, grade F, #1,168 of 1,410 statewide, top 83%, 592 students, 100% FRL); Hope Mills Middle (math 27% / reading 34%, grade F, #331 of 475 statewide, top 70%, 514 students, 99% FRL); South View High (math 60% / reading 43%, grade D+, #299 of 535 statewide, top 56%, 1,502 students, 66% FRL) — zoned schools average 88% FRL vs 55% district-wide (34 pts higher); higher-poverty schools than district average — tighter screening recommended.
- Market conditions: Rents rising fast (+4.3%/yr); 319 active listings in the ZIP; 12 comparable units currently listed for rent nearby; rentals at typical pace (median 23d on market — plan ~3-4 weeks tenant-placement turnaround); 1,125 units permitted in Cumberland County in 2024 (104 in 5+ unit buildings).
Forward outlook
- Local home prices are declining (-3.0%/yr); year-one equity from $726 of loan paydown is wiped out by about $3k of value loss. Plan a longer hold.
- At projected returns (-3.0% appreciation + 4.3% rent growth), your $29k cash investment doubles in ~9 years — after that, you're playing with house money.
Negotiation context
- It's been on market 170 days — a 12% lower offer ($92k) is reasonable based on typical stale-listing flexibility.
- 2 sale attempts; this cycle's ask has dropped $10k (9%) from the opening price — seller is motivated, your offer sets the floor, not the list.
Risks & watch-outs
- Watch-outs: built in 1950 — expect roof / HVAC / electrical / plumbing capex.
- Climate carrying-cost: major wind risk, 78% chance of damaging wind over 30y; moderate wildfire risk; extreme-heat days projected 7→16/yr by 2055 (HVAC capex compounding) — expect insurance premiums to compound above CPI over the hold.
Questions for the listing agent
- It's been on market 170 days. Have you received any prior offers? Is the seller open to a 12% concession, seller financing, or rate buy-down credit?
- Built in 1950 — when were the roof, HVAC, electrical panel, plumbing, and water heater last replaced?
- Why hasn't it sold? Are there any deal-killer items the seller is aware of (foundation, flood, title, zoning, code violations)?
- Is there a deadline driving the sale (1031 exchange, divorce, estate, relocation)? That informs how much negotiation room exists.
- Schools are D-rated, which usually means shorter tenancies and higher turnover. Who's the typical renter profile here, and what's been the actual vacancy rate?
- Crime grade is D in this area — have there been break-ins, vandalism, or insurance claims at this property in the last 3 years? What carrier currently insures it and at what premium?
- What's the average days-on-market for RENTAL listings here right now (not sales)? A rising rental-DOM trend means longer vacancies and softer asking-rent achievability than the comps imply.
- What's the recent tenant-quality profile in this submarket — average credit score on applications, eviction rate, late-payment / NSF rate, and stable-employment percentage? A property-management company in the area should have these aggregated.
- How much new for-sale + rental construction is in the pipeline within 1–3 miles? Heavy new supply typically softens prices + rents 12–24 months out; constrained supply supports both.
Investment metrics
- 1% rule
- 1.19% ✓
- Cap rate
- 9.30%
- Cash-on-cash
- 10.76%
- DSCR
- 1.48
- GRM
- 7.0
CMA / ARV
- ARV (on-the-fly)
- $96,285
- Comps found
- 1
Show comp detail 1 sale within ~0.75 mi
| Address | Dist | Beds/Ba | Sqft | Sold | Price | $/sf | Match |
|---|---|---|---|---|---|---|---|
| 5426 5426 Pinecrest St St | 0.00mi | 2/1.0 | 946 (+3%) | 23mo | $99,000 | $105 | 75 |
Match score weights: distance 35% · size 25% · config 20% · recency 20%. Top-matched comps best support the ARV.
Projected returns pro-forma
-3.0% appreciation · 4.28% rent growth · sell at horizon
- IRR
- 1.2%
- Equity multiple
- 1.05×
- Total profit
- $1,423
- Equity at exit
- $15,656
- IRR
- 12.1%
- Equity multiple
- 2.01×
- Total profit
- $29,808
- Equity at exit
- $9,078
Cash invested: $29,400 (down + closing). Projections, not guarantees.
Landlord ↔ Tenant lean methodology
- Overall (STATE)
- 85 Strongly Landlord-Friendly
- State North Carolina
- 85 Strongly Landlord-Friendly · R+3
- County
- — inherits STATE
- City
- — inherits STATE
ZIP-level market 28348
- Home prices YoY
- -14.0%
- Rents YoY
- 4.3%
- Active inventory
- 319
- Price-to-rent
- 7.0×
Monthly cashflow live
- Estimated rent
- $1,252 high interval (Pro) →
- Mortgage (P&I)
- −$551
- Tax est. 1.5%
- −$131 /mo · $1,575/yr
- Insurance
- −$44
- HOA
- −$0
- Vacancy / Maint / Mgmt
- −$263
- Net cashflow
- $264
Break-even live
Sensitivity live
| Price | -10% $336 | -5% $300 | +0% $264 | +5% $227 | +10% $191 |
|---|---|---|---|---|---|
| Rent | -10% $165 | -5% $214 | +0% $264 | +5% $313 | +10% $362 |
| Rate | -1.0pp $316 | -0.5pp $290 | base $264 | +0.5pp $236 | +1.0pp $209 |
UW: 25.0% down · 7.5% · 30yr · 1.5% tax · 5.0% vac · 8.0% maint · 8.0% mgmt
Financing live
Cash to close
- Down payment
- $26,250
- Closing costs
- $3,150
- Reserves months
- —
- Total cash needed
- —
Loan-product check · same deal, 3 products live
Conventional
25% down · 7.5% · 30yr
- Down + closing
- —
- Monthly P&I
- —
- Monthly cashflow
- —
- DSCR
- —
- Eligible?
- —
Personal DTI + credit; lowest rate.
DSCR
20% down · 8.5% · 30yr
- Down + closing
- —
- Monthly P&I
- —
- Monthly cashflow
- —
- DSCR
- —
- Eligible?
- —
No personal income docs; deal must DSCR.
Hard money
10% down · 12.0% · 12mo
- Down + closing
- —
- Monthly P&I
- —
- Monthly cashflow
- —
- DSCR
- —
- Eligible?
- —
Short-term bridge; refi at stabilization.
Rent comps 12 comps
| Address | Beds | Baths | Sqft | Rent | $/sqft | DOM | Units | Dist |
|---|---|---|---|---|---|---|---|---|
| 4033 Professional Dr Unit 4033 Hope Mills, NC | 2.0 | 2.0 | 1050 | $1,095 | $1.04 | 25d | 1 | 0.21mi |
| 4079 Professional Dr Hope Mills, NC | 2.0 | 2.0 | 1050 | $1,095 | $1.04 | 25d | 1 | 0.25mi |
| 4065 Professional Dr Hope Mills, NC | 2.0 | 2.0 | 1050 | $1,095 | $1.04 | 22d | 1 | 0.26mi |
| 4065 Professional Dr Unit 4065 Hope Mills, NC | 2.0 | 2.0 | 1050 | $1,095 | $1.04 | 25d | 1 | 0.26mi |
| 3717 Damien Dr Hope Mills, NC | 2.0 | 2.0 | 975 | $1,280 | $1.31 | 15d | 3 | 0.27mi |
| 3916 Middle St Hope Mills, NC | 2.0 | 1.0 | 905 | $1,115 | $1.23 | 15d | 1 | 0.35mi |
| 5693A Archer Rd Hope Mills, NC | 2.0 | 1.5 | 874 | $1,100 | $1.26 | 15d | 1 | 0.63mi |
| 3519 Hill St Unit B Hope Mills, NC | 1.0 | 1.0 | 604 | $850 | $1.41 | 25d | 1 | 0.66mi |
| 3332 Kenmont Ln Unit E Hope Mills, NC | 2.0 | 2.5 | 1100 | $1,150 | $1.05 | 25d | 1 | 0.87mi |
| 1514 Aristo Pl Hope Mills, NC | 2.0 | 2.0 | 1000 | $1,050 | $1.05 | 15d | 1 | 1.36mi |
| 3636 Metric Dr Hope Mills, NC | 3.0 | 1.5 | 1100 | $1,400 | $1.27 | 15d | 1 | 1.42mi |
| 1055 Winnall LN Hope Mills, NC | 1.0–3.0 | 1.0–2.0 | 1132 | $1,762 | $1.56 | 15d | 20 | 1.43mi |
Listing history 23 events
-
2026-06-21days on market $105,000 Active 170 DOM
-
2026-06-18days on market $105,000 Active 167 DOM
-
2026-06-17days on market $105,000 Active 166 DOM
-
2026-06-16days on market $105,000 Active 165 DOM
-
2026-06-15days on market $105,000 Active 164 DOM
-
2026-06-14days on market $105,000 Active 162 DOM
-
2026-06-13days on market $105,000 Active 161 DOM
-
2026-06-10days on market $105,000 Active 159 DOM
-
2026-06-09days on market $105,000 Active 158 DOM
-
2026-06-08days on market $105,000 Active 157 DOM
-
2026-06-07days on market $105,000 Active 156 DOM
-
2026-06-03days on market $105,000 Active 152 DOM
-
2026-06-02days on market $105,000 Active 151 DOM
-
2026-06-01days on market $105,000 Active 150 DOM
-
2026-05-31days on market $105,000 Active 149 DOM
-
2026-05-30days on market $105,000 Active 148 DOM
-
2026-05-11price $105,000
-
2026-03-02price $107,000
-
2026-02-27price $112,500
-
2026-01-06status Active
-
2025-12-29status Pending
-
2025-12-26$115,000 Active
-
2025-12-23historical $115,000
ⓘ Source: listings_history table (triggers on properties + properties_extension) + one-shot
backfill from property_details.listing_events for pre-trigger history.
Climate risk First Street
- Flood 3/10 Moderate FEMA zone X (unshaded) · 20% chance over 30 yrs
- Wildfire 5/10 Major
- Heat 7/10 Severe 7 d/yr ≥106°F today · 16 d/yr by 30 yrs out
- Wind 7/10 Severe 78% chance of damaging wind over 30 yrs
- Air quality 1/10 Low 0 unhealthy d/yr today · 0 by 30 yrs out
Nearby sold comps map
Loading sold comps map…
Walkable amenities ~0.75 mi
Loading nearby amenities…
Taxation est. · year 1
- Rental income
- $15,025
- − Mortgage interest
- −$5,882
- − Property taxes
- −$1,575
- − Insurance
- −$525
- − Repairs & maintenance
- −$1,202
- − Management
- −$1,202
- − Depreciation
- −$3,055
- Taxable income
- $1,585
- Est. tax owed @ 24.0%
- −$380
- After-tax cash flow
- $2,782/yr
For passive investors: Depreciation is non-cash, so a rental often shows a tax loss while cash-flowing — sheltering income. Rental losses are passive: they offset passive income freely, and up to $25,000/yr can offset ordinary (W-2) income if you actively participate and your MAGI is under $100k (phasing out to $0 by $150k); unused losses carry forward. On sale, claimed depreciation is recaptured at up to 25%, and gains may owe capital-gains tax (a 1031 exchange can defer both). Figures are a year-1 estimate at your 24.0% rate — not tax advice; consult a CPA.
Condition & rehab AI · 12 photos
This two-bedroom home has average exterior and interior conditions, with minor repairs and maintenance needed. Fresh paint and landscaping improvements can significantly enhance its resale value.
Repairs flagged
- Minor roof — The roof appears aged, but there is no visible damage.
- Minor exterior siding — The siding shows some discoloration and minor damage.
- Minor paint — The paint appears faded in some areas.
- Minor landscaping — The landscaping is overgrown and in need of trimming.
Value-add opportunities
- Resale Paint the exterior — Fresh paint can significantly improve the curb appeal and resale value.
- Resale Trim the landscaping — A well-maintained yard can enhance the home's appeal and value.
- Rental Clean and service the HVAC system — A clean and functioning HVAC system is essential for tenant satisfaction and can prevent costly repairs.
Renovation cost estimate screening
| Repair item | Severity | Est. cost |
|---|---|---|
| roof · The roof appears aged, but there is no visible damage. | Minor | $500–3,000 |
| exterior siding · The siding shows some discoloration and minor damage. | Minor | $500–3,000 |
| paint · The paint appears faded in some areas. | Minor | $500–3,000 |
| landscaping · The landscaping is overgrown and in need of trimming. | Minor | $500–3,000 |
| Total estimated repair cost · 4 items | $2,000–12,000 |
Value-add ROI direction
- Resale Paint the exterior — Fresh paint can significantly improve the curb appeal and resale value. ↑
- Resale Trim the landscaping — A well-maintained yard can enhance the home's appeal and value. ↑
- Rental Clean and service the HVAC system — A clean and functioning HVAC system is essential for tenant satisfaction and can prevent costly repairs. ↑
ⓘ Cost ranges are severity-bucket heuristics (US national rule-of-thumb). Get contractor quotes + a written scope before underwriting a rehab budget.
Schools (NCES district)
- District
- Cumberland County Schools
- NCES district ID
- 3700011
- Math proficiency
- 32% ▼ -2.00%
- Reading proficiency
- 41% ▼ -1.00%
- Median HH income
- $44,168
- Composite
- 31.0/100
- National rank
- #6096
- State rank
- #126 of 178 in NC
Livability — Hope Mills
- Score
- 67/100
- State rank
- #234
- US rank
- #10761
Category grades
Schools grade is shown separately in the Schools card above.
Census & demographics
- Census place
- Hope Mills, NC
- County
- Cumberland County · 265,314 people
- City population
- 39,196
- Metro
- Fayetteville, NC
- Population (ZIP)
- 39,196
- Household income
- $66,129
- Rent vs Own
- Severe rent burden
- 746.0
Population outlook (Cumberland County) Hauer SSP2
- Today (2025)
- 330,855 people
- By 2030
- 333,523 · +0.8%
- By 2040
- 335,583 · +1.4%
- By 2050
- 335,325 · +1.4%
- By 2075
- 342,853 · +3.6%
- By 2100
- 340,698 · +3.0%
Race, ethnicity, and origin ACS 2023
- Neighborhood character
- Diverse neighborhood (Simpson 0.67)
- Race & ethnicity
- White 49% Black 27% Hispanic / Latino 13% Two or more races 11% Asian 2% Native American 2%
- Hispanic origin (detail)
- Mexican 4% Puerto Rican 5%
- Common ancestry
- Romanian 2% Lithuanian 1% Serbian 1%
- Foreign-born
- 5% · Canada, South Korea, Vietnam
- Languages at home
- 90% English-only · Spanish 8% Other Indo-European 1%
Political lean MEDSL · Cumberland
- 2024 margin
- D (+13.4) · D 56.1% · R 42.7% · Other 1.2%
- 2008→2024 swing
- -4.3pp toward R · 2008: 17.7pp · 2024: 13.4pp
- All cycles
- 2024: D+13.4 2020: D+16.6 2016: D+16.0 2012: D+19.7 2008: D+17.7
Not yet ingested
- Civics
- —
Market trends
- HPI YoY
- ▼ -37.14%
- Current HPI
- 228.3122
- Rent YoY
- ▲ 4.28%
- Metro
- Fayetteville, NC
- State GDP YoY
- ▲ 3.28%
- F500 in state
- 26
Industry mix (Fortune 500 HQ in NC)
| Industry | F500 HQs | Revenue |
|---|---|---|
| Financial Services | 2 | $213B |
|
||
| Retail | 2 | $95B |
|
||
| Industrial Conglomerate | 1 | $38B |
|
||
| Metals / Steel | 1 | $35B |
|
||
| Utilities | 1 | $30B |
|
||
| Industrial Machinery | 1 | $19B |
|
||
Price history
-8.7% since first listed7 events — show timeline
- 2026-05-11 Price Changed $105,000 LPRMLS
- 2026-03-02 Price Changed $107,000 LPRMLS
- 2026-02-27 Price Changed $112,500 LPRMLS
- 2026-01-06 Relisted — LPRMLS
- 2025-12-29 Pending — LPRMLS
- 2025-12-26 Listed $115,000 LPRMLS
- 2025-12-23 Coming Soon $115,000 LPRMLS
Cash-flow waterfall
monthlySold comps — $/sqft
last 12 mo · ≤1 miLoading sold comps…