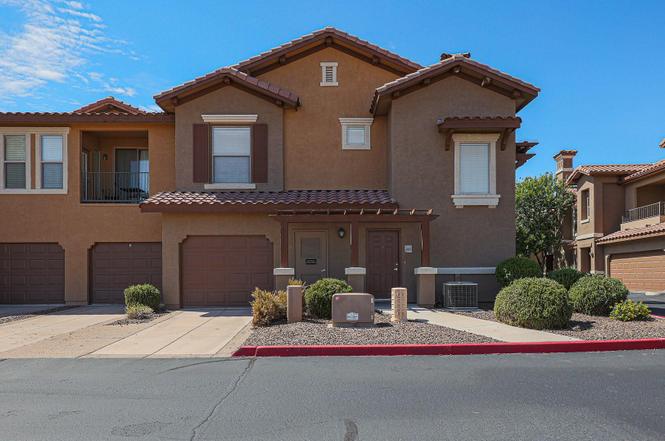
14250 W Wigwam Blvd #2625 · Litchfield Park, AZ
Flood risk 1/10 · Minimal
- FEMA flood zone
- X (shaded)
- Chance of flooding over 30 yrs
- 0.0%
- Est. flood insurance / yr
- $507 – $1,088
Fire risk 4/10 · Minor
- Est. fire insurance / yr
- $610 – $1,132
Heat risk 9/10 · Severe
- Hot days now (above 114°F)
- 7 days/yr
- Hot days in 30 yrs
- 19 days/yr
Wind risk 1/10 · Minimal
- Chance of severe wind over 30 yrs
- —
Air-quality risk 1/10 · Minimal
- Unhealthy air days now
- 0 days/yr
- Unhealthy air days in 30 yrs
- 0 days/yr
Risk factors via First Street. Map © Google.
Why this score? — see what drove the D grade
The composite is a weighted blend of 9 inputs, each scored 0–100. Each bar is that input's sub-score; the figure is the points it added to the 100-point composite (weight × sub-score).
- Cash flow +13.6/30.0
- ARV discount +7.5/15.0
- 1% rule +4.2/10.0
- DSCR +4.1/10.0
- Livability +3.6/5.0
- Rent growth +3.0/5.0
- Schools +2.8/10.0
- Condition / age +2.5/5.0
- Appreciation +0.0/10.0
$289,000
🖨 Deal sheet (PDF) 📄 Offer letter ✓ Due diligence
Listing remarks
Welcome to Renaissance Villas, a gated resort-style community in the heart of desirable Litchfield Park. This beautifully maintained 2-bedroom, 2-bath condo offers the perfect blend of comfort, convenience, and low-maintenance living. Unlike many condo floorplans, this home features a private attached garage with direct entry and no neighbors living above your main living space. Upstairs, you'll find a bright and open great room with vaulted ceilings, abundant natural light, and access to a private balcony--perfect for enjoying your morning coffee or relaxing after a day on the golf course. The split-bedroom floorplan provides privacy for owners and guests alike, while the spacious primary
Key facts
- Walk-in closet
- First-floor foyer
- $325 HOA
Tags
Property features AI
Finance
- Other: Lot size recorded by assessor; Building area source: Assessor
- HOA & community: Monthly association fee of $325.20; HOA covers roof repair and replacement, insurance, sewer, pest control, grounds maintenance, street maintenance, front yard maintenance, trash, water, and exterior maintenance; Community amenities include pool, gated access, community spa (heated), playground, biking/walking path, and fitness center
Exterior
- Parking: Covered parking (1 space); 1-car garage; Gated community access; Garage door opener; Direct garage access; Separate storage area; Common parking
- Security: Gated community
- Utilities: Private water company; Sewer connected (private sewer)
- Home design: Condominium townhouse; Attached property
- Construction: Stucco and wood frame construction; Painted exterior; Tile roof
- Exterior features: Balcony; Gravel/stone front; City-maintained road
Interior
- Kitchen: Built-in microwave; Refrigerator; Dishwasher; Garbage disposal; Laminate counters
- Bedrooms: 2 bedrooms (possible)
- Flooring: Carpet; Linoleum
- Bathrooms: 2 full bathrooms
- Heating & cooling: Electric heating; Central air conditioning
- Interior features: Double vanity; Upstairs living areas; Breakfast bar; Master bathroom with separate shower and tub; Laminate countertops; Dual-pane windows
- Laundry & utility: Inside laundry; Upstairs laundry
Neighborhood map
What this means for you Summary
Snapshot
- This is a 2-bed/3.0-bath condo listed at $289k.
Deal economics
- At list price, monthly cash flow is $13 ($160/yr) — positive.
- The deal already cash-flows at list — no discount required.
- To meet the 1% rule (rent ≥ 1% of price), the offer needs to be $266k (8.1% below list).
- Recommended offer: $266k (8.1% below list) — sets the bar for 1% rule.
- Cap rate 6.3% vs local median 3.2% in Litchfield Park — top-decile yield for the area; either an underpriced asset or a hidden risk that comps aren't pricing in. Stress-test before assuming the spread holds.
Location & tenants
- Location reads 71/100 on livability (#36 in AZ) — a middle-class / working-renter tenant base. Strengths: crime A+, employment A+, housing A+; Watch: amenities F, commute F, cost of living F.
- Agua Fria Union High School District (4289) (suburban): math 24% / reading 37% proficiency, ranked #99 of 249 in AZ (top 40%) — families likely to look elsewhere, expect single-tenant / working-renter base with shorter leases.
- Zoned schools: Millennium High School (math 39% / reading 55%, grade D-, #50 of 381 statewide, top 14%, 2,121 students, 21% FRL).
- Zoned-school proficiency averages 47% at this address vs 30% district-wide (+16 pts) — the actual schools serving this property are materially stronger than the Agua Fria Union High School District (4289) average implies; a family-tenant draw the district grade alone would hide.
- Market conditions: Rents rising (+1.9%/yr); 473 active listings in the ZIP; 9 comparable units currently listed for rent nearby; rentals leasing fast (median 0d on market — plan ~1-2 weeks tenant-placement turnaround); high-income renter base; 36,011 units permitted in Maricopa County in 2024 (12,801 in 5+ unit buildings).
Forward outlook
- Local home prices are declining (-3.0%/yr); year-one equity from $2k of loan paydown is wiped out by about $9k of value loss. Plan a longer hold.
- Maricopa County population projected at +38% by 2050 — long-run rental-demand tailwind backs the buy-and-hold thesis.
Negotiation context
- It's been on market 66 days — a 6% lower offer ($272k) is reasonable based on typical stale-listing flexibility.
- 9 sale attempts since 8y ago with the ask held roughly flat each time — persistent listings suggest the price (not the market) is what's stuck; bring a comps-based counter.
- Current owner paid $175k; list at $289k implies a 65% gain — meaningful room to come down on a strong offer.
Risks & watch-outs
- Climate carrying-cost: extreme-heat days projected 7→19/yr by 2055 (HVAC capex compounding) — expect insurance premiums to compound above CPI over the hold.
Questions for the listing agent
- It's been on market 66 days. Have you received any prior offers? Is the seller open to a 8% concession, seller financing, or rate buy-down credit?
- What does the HOA fee cover, when was the last increase, and are there any pending special assessments or reserve-fund shortfalls?
- Any open or pending special assessments — roof, HVAC, plumbing, elevator, façade? What's the per-unit balance and payoff schedule, and is the seller paying it off at close or rolling it to the buyer?
- Why hasn't it sold? Are there any deal-killer items the seller is aware of (foundation, flood, title, zoning, code violations)?
- Is there a deadline driving the sale (1031 exchange, divorce, estate, relocation)? That informs how much negotiation room exists.
- Schools are B-rated — typically a magnet for longer-tenancy family renters. What's the average tenant stay here, and is there a school-zone premium baked into asking?
- The area grade is low — what's the realistic commute time and amenity access for the typical tenant pool here? Any planned neighborhood developments (good or bad) we should know about?
- What's the average days-on-market for RENTAL listings here right now (not sales)? A rising rental-DOM trend means longer vacancies and softer asking-rent achievability than the comps imply.
- What's the recent tenant-quality profile in this submarket — average credit score on applications, eviction rate, late-payment / NSF rate, and stable-employment percentage? A property-management company in the area should have these aggregated.
- How much new apartment / multifamily construction is in the pipeline within 1–3 miles? Heavy new supply (>2% of stock underway) typically softens rents 12–24 months out; light construction supports rent growth.
Investment metrics
- 1% rule
- 0.92% ✗
- Cap rate
- 6.35%
- Cash-on-cash
- 0.20%
- DSCR
- 1.01
- GRM
- 9.1
CMA / ARV
No comps found within radius.
Projected returns pro-forma
-3.0% appreciation · 1.92% rent growth · sell at horizon
- IRR
- -17.2%
- Equity multiple
- 0.40×
- Total profit
- $-48,742
- Equity at exit
- $43,091
- IRR
- -11.4%
- Equity multiple
- 0.35×
- Total profit
- $-52,433
- Equity at exit
- $24,987
Cash invested: $80,920 (down + closing). Projections, not guarantees.
Landlord ↔ Tenant lean methodology
- Overall (STATE)
- 87 Strongly Landlord-Friendly
- State Arizona
- 87 Strongly Landlord-Friendly · R+3
- County
- — inherits STATE
- City
- — inherits STATE
ZIP-level market 85340
- Rents YoY
- 1.9%
- Active inventory
- 473
- Price-to-rent
- 9.1×
Monthly cashflow live
- Estimated rent
- $2,656 high interval (Pro) →
- Mortgage (P&I)
- −$1,516
- Tax from tax record
- −$124 /mo · $1,486/yr
- Insurance
- −$120
- HOA
- −$325
- Vacancy / Maint / Mgmt
- −$558
- Net cashflow
- $13
Break-even live
Sensitivity live
| Price | -10% $177 | -5% $95 | +0% $13 | +5% $-68 | +10% $-150 |
|---|---|---|---|---|---|
| Rent | -10% $-196 | -5% $-92 | +0% $13 | +5% $118 | +10% $223 |
| Rate | -1.0pp $159 | -0.5pp $87 | base $13 | +0.5pp $-62 | +1.0pp $-138 |
UW: 25.0% down · 7.5% · 30yr · 1.5% tax · 5.0% vac · 8.0% maint · 8.0% mgmt
Financing live
Cash to close
- Down payment
- $72,250
- Closing costs
- $8,670
- Reserves months
- —
- Total cash needed
- —
Loan-product check · same deal, 3 products live
Conventional
25% down · 7.5% · 30yr
- Down + closing
- —
- Monthly P&I
- —
- Monthly cashflow
- —
- DSCR
- —
- Eligible?
- —
Personal DTI + credit; lowest rate.
DSCR
20% down · 8.5% · 30yr
- Down + closing
- —
- Monthly P&I
- —
- Monthly cashflow
- —
- DSCR
- —
- Eligible?
- —
No personal income docs; deal must DSCR.
Hard money
10% down · 12.0% · 12mo
- Down + closing
- —
- Monthly P&I
- —
- Monthly cashflow
- —
- DSCR
- —
- Eligible?
- —
Short-term bridge; refi at stabilization.
Rent comps 9 comps
| Address | Beds | Baths | Sqft | Rent | $/sqft | DOM | Units | Dist |
|---|---|---|---|---|---|---|---|---|
| 14250 W Wigwam Blvd Litchfield Park, AZ | 1.0–2.0 | 1.0–2.0 | 1151 | $3,400 | $2.95 | 0d | 6 | 0.07mi |
| 200 S Old Litchfield Rd Litchfield Park, AZ | 2.0 | 1.0 | 925 | $1,622 | $1.75 | 16d | 2 | 0.44mi |
| 4175 N Falcon Dr Goodyear, AZ | 1.0–3.0 | 1.0–2.0 | 1064 | $1,874 | $1.76 | 0d | 31 | 1.08mi |
| 3923 N 151st Ave Goodyear, AZ | 2.0 | 2.0 | 1445 | $3,000 | $2.08 | 0d | 1 | 1.09mi |
| 2801 N Litchfield Rd Goodyear, AZ | 2.0 | 2.0 | 1156 | $1,972 | $1.71 | 26d | 2 | 1.18mi |
| 2801 N Litchfield Rd #26 Goodyear, AZ | 2.0 | 2.0 | 1265 | $2,295 | $1.81 | 0d | 1 | 1.23mi |
| 4200 N Falcon Dr Goodyear, AZ | 1.0–3.0 | 1.0–2.0 | 935 | $1,799 | $1.92 | 0d | 9 | 1.26mi |
| 3691 N 153rd Ln Goodyear, AZ | 2.0 | 2.0 | 1445 | $4,000 | $2.77 | 3d | 1 | 1.40mi |
| 15089 W Verde Ln Goodyear, AZ | 2.0 | 2.0 | 1450 | $2,200 | $1.52 | 14d | 1 | 1.42mi |
HOA detail condo
- Monthly dues
- $325 · $3,900/yr
- Likely covers
- security
- Assessments
- None detected in remarks — confirm with the listing agent.
Listing history 41 events
-
2026-06-21days on market $289,000 Active 66 DOM
-
2026-06-18days on market $289,000 Active 63 DOM
-
2026-06-17days on market $289,000 Active 62 DOM
-
2026-06-16days on market $289,000 Active 61 DOM
-
2026-06-16status $289,000 Active 60 DOM
-
2026-06-15days on market $289,000 Under Contract Accepting Backups 60 DOM
-
2026-06-13days on market $289,000 Under Contract Accepting Backups 58 DOM
-
2026-06-09days on market $289,000 Under Contract Accepting Backups 54 DOM
-
2026-06-08days on market $289,000 Under Contract Accepting Backups 53 DOM
-
2026-06-07days on market $289,000 Under Contract Accepting Backups 52 DOM
-
2026-06-04days on market $289,000 Under Contract Accepting Backups 49 DOM
-
2026-06-03days on market $289,000 Under Contract Accepting Backups 48 DOM
-
2026-06-02days on market $289,000 Under Contract Accepting Backups 47 DOM
-
2026-06-01days on market $289,000 Under Contract Accepting Backups 46 DOM
-
2026-05-31statusdays on market $289,000 Under Contract Accepting Backups 45 DOM
-
2026-04-19historical $1,850
-
2026-04-16$289,000 Active
-
2026-04-13$1,850
-
2026-04-12historical $1,850
-
2026-04-01$1,850
-
2026-03-26historical $1,850
-
2026-03-10$1,850
-
2026-03-09historical
-
2026-02-13price $295,000
-
2026-02-12status Active
-
2026-02-12historical
-
2026-01-03price $299,990
-
2025-09-15price $310,000
-
2025-08-21price $315,000
-
2025-08-11$325,000 Active
-
2023-03-07historical
-
2023-02-24price $313,500
-
2023-02-11price $314,000
-
2023-02-02status Active
-
2023-01-13status Pending
-
2023-01-03price $314,500
-
2022-10-08price $334,500
-
2022-09-28$339,000 Active
-
2018-05-11soldstatus $175,000 Closed
-
2018-04-15status Pending
-
2018-02-14$175,000 Active
ⓘ Source: listings_history table (triggers on properties + properties_extension) + one-shot
backfill from property_details.listing_events for pre-trigger history.
Tax reassessment forecast AZ · Resets to sale price
- Current annual tax
- $1,486 · $124/mo
- Projected year-2 tax
- $1,907 · $159/mo
- Expected delta
- +$421/yr (+$35/mo · 28.3%)
ⓘ Screening estimate from a state-policy table — verify with the county assessor before closing.
Climate risk First Street
- Flood 1/10 Low FEMA zone X (shaded) · 0% chance over 30 yrs
- Wildfire 4/10 Moderate
- Heat 9/10 Extreme 7 d/yr ≥114°F today · 19 d/yr by 30 yrs out
- Wind 1/10 Low
- Air quality 1/10 Low 0 unhealthy d/yr today · 0 by 30 yrs out
Nearby sold comps map
Loading sold comps map…
Walkable amenities ~0.75 mi
Loading nearby amenities…
Taxation est. · year 1
- Rental income
- $31,871
- − Mortgage interest
- −$16,188
- − Property taxes
- −$1,486
- − Insurance
- −$1,445
- − Repairs & maintenance
- −$2,550
- − Management
- −$2,550
- − HOA
- −$3,900
- − Depreciation
- −$8,407
- Taxable loss
- −$4,655
- Est. tax savings @ 24.0%
- +$1,117
- After-tax cash flow
- $1,277/yr
For passive investors: Depreciation is non-cash, so a rental often shows a tax loss while cash-flowing — sheltering income. Rental losses are passive: they offset passive income freely, and up to $25,000/yr can offset ordinary (W-2) income if you actively participate and your MAGI is under $100k (phasing out to $0 by $150k); unused losses carry forward. On sale, claimed depreciation is recaptured at up to 25%, and gains may owe capital-gains tax (a 1031 exchange can defer both). Figures are a year-1 estimate at your 24.0% rate — not tax advice; consult a CPA.
Schools (NCES district)
- District
- Agua Fria Union High School District (4289)
- NCES district ID
- 0400450
- Math proficiency
- 24% ▼ -32.00%
- Reading proficiency
- 37% ▼ -12.00%
- Median HH income
- $64,107
- Composite
- 27.92/100
- National rank
- #6865
- State rank
- #99 of 249 in AZ
Livability — Litchfield Park
- Score
- 71/100
- State rank
- #36
- US rank
- #6952
Category grades
Schools grade is shown separately in the Schools card above.
Census & demographics
- Census place
- Litchfield Park, AZ
- County
- Maricopa County · 4,537,380 people
- City population
- 40,919
- Metro
- Phoenix-Mesa-Chandler, AZ
- Population (ZIP)
- 40,919
- Household income
- $122,323
- Rent vs Own
- Severe rent burden
- 696.0
Population outlook (Maricopa County) Hauer SSP2
- Today (2025)
- 4,979,203 people
- By 2030
- 5,378,229 · +8.0%
- By 2040
- 6,156,598 · +23.6%
- By 2050
- 6,872,376 · +38.0%
- By 2075
- 8,401,270 · +68.7%
- By 2100
- 9,247,439 · +85.7%
Race, ethnicity, and origin ACS 2023
- Neighborhood character
- Diverse neighborhood (Simpson 0.64)
- Race & ethnicity
- White 48% Hispanic / Latino 35% Two or more races 19% Black 5% Asian 4% Native American 1%
- Hispanic origin (detail)
- Mexican 27%
- Common ancestry
- Romanian 2% Portuguese 2% Slovak 2%
- Foreign-born
- 12% · Canada, Vietnam, China
- Languages at home
- 78% English-only · Spanish 16% Other Indo-European 1%
Political lean MEDSL · Maricopa
- 2024 margin
- Toss-up / Even · D 47.7% · R 51.2% · Other 1.1%
- 2008→2024 swing
- +7.1pp toward D · 2008: -10.6pp · 2024: -3.5pp
- All cycles
- 2024: R+3.5 2020: D+2.2 2016: R+3.5 2012: R+12.0 2008: R+10.6
Not yet ingested
- Civics
- —
Market trends
- HPI YoY
- ▼ -322.29%
- Current HPI
- 279.2294
- Rent YoY
- ▲ 1.92%
- Metro
- Phoenix-Mesa-Chandler, AZ
- State GDP YoY
- ▲ 4.54%
- F500 in state
- 20
Industry mix (Fortune 500 HQ in AZ)
| Industry | F500 HQs | Revenue |
|---|---|---|
| Technology | 2 | $13B |
|
||
| Mining / Metals | 1 | $23B |
|
||
| Environmental Services | 1 | $16B |
|
||
| Metals / Steel | 1 | $14B |
|
||
| Technology Distribution | 1 | $9B |
|
||
| Homebuilding | 1 | $8B |
|
||
Price history
-98.9% since first listed26 events — show timeline
- 2026-04-19 Rental Removed $1,850 ZUMPER1
- 2026-04-16 Listed $289,000 ARMLS
- 2026-04-13 Listed for Rent $1,850 ZUMPER1
- 2026-04-12 Rental Removed $1,850 ARMLS
- 2026-04-01 Listed for Rent $1,850 ARMLS
- 2026-03-26 Rental Removed $1,850 ARMLS
- 2026-03-10 Listed for Rent $1,850 ARMLS
- 2026-03-09 Listing Removed — ARMLS
- 2026-02-13 Price Changed $295,000 ARMLS
- 2026-02-12 Relisted — ARMLS
- 2026-02-12 Listing Removed — ARMLS
- 2026-01-03 Price Changed $299,990 ARMLS
- 2025-09-15 Price Changed $310,000 ARMLS
- 2025-08-21 Price Changed $315,000 ARMLS
- 2025-08-11 Listed $325,000 ARMLS
- 2023-03-07 Listing Removed — ARMLS
- 2023-02-24 Price Changed $313,500 ARMLS
- 2023-02-11 Price Changed $314,000 ARMLS
- 2023-02-02 Relisted — ARMLS
- 2023-01-13 Pending — ARMLS
- 2023-01-03 Price Changed $314,500 ARMLS
- 2022-10-08 Price Changed $334,500 ARMLS
- 2022-09-28 Listed $339,000 ARMLS
- 2018-05-11 Sold (MLS) $175,000 ARMLS
- 2018-04-15 Pending — ARMLS
- 2018-02-14 Listed $175,000 ARMLS
Property tax history
+0.6%/yrLatest (2025): $1,486 · +5.7% YoY. Source: county tax records.
Cash-flow waterfall
monthlySold comps — $/sqft
last 12 mo · ≤1 miLoading sold comps…