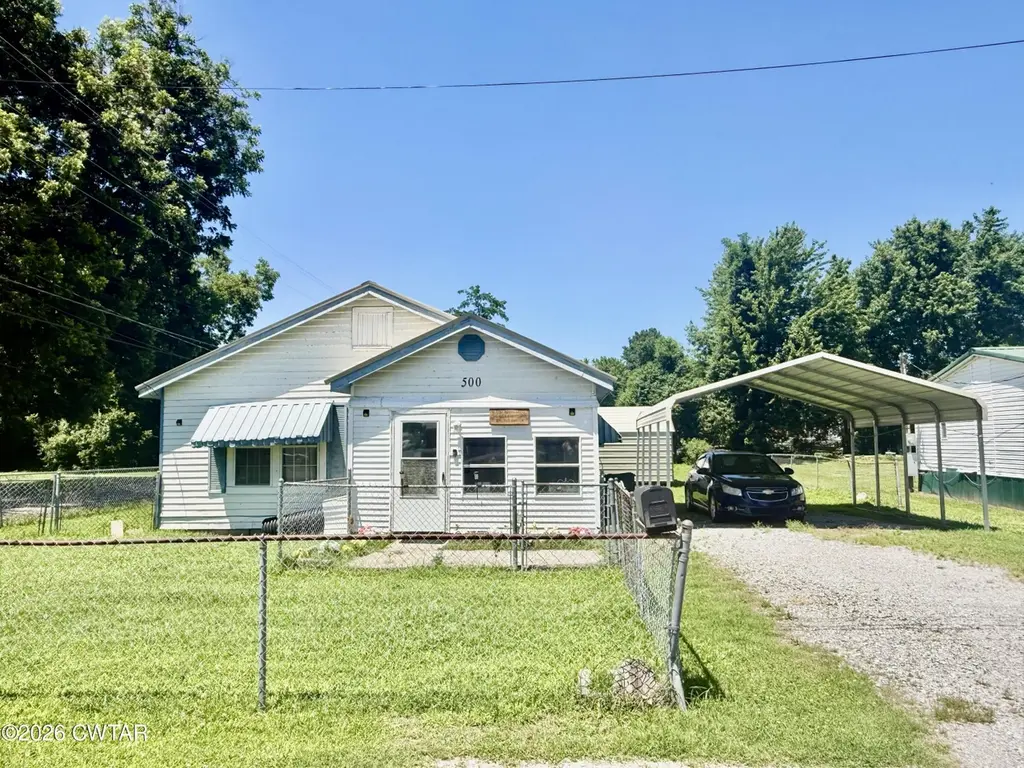
500 Hardison St · Ridgely, TN
Flood risk 1/10 · Minimal
- FEMA flood zone
- X
- Chance of flooding over 30 yrs
- 0.0%
- Est. flood insurance / yr
- $507 – $1,088
Fire risk 1/10 · Minimal
- Est. fire insurance / yr
- $949 – $1,763
Heat risk 6/10 · Moderate
- Hot days now (above 107°F)
- 7 days/yr
- Hot days in 30 yrs
- 21 days/yr
Wind risk 4/10 · Minor
- Chance of severe wind over 30 yrs
- 8.0%
Air-quality risk 1/10 · Minimal
- Unhealthy air days now
- 0 days/yr
- Unhealthy air days in 30 yrs
- 0 days/yr
Risk factors via First Street. Map © Google.
Why this score? — see what drove the C grade
The composite is a weighted blend of 9 inputs, each scored 0–100. Each bar is that input's sub-score; the figure is the points it added to the 100-point composite (weight × sub-score).
- Cash flow +20.1/30.0
- ARV discount +15.0/15.0
- DSCR +6.4/10.0
- 1% rule +5.3/10.0
- Appreciation +3.4/10.0
- Livability +3.0/5.0
- Rent growth +2.5/5.0
- Condition / age +2.2/5.0
- Schools +1.0/10.0
$94,900
🖨 Deal sheet 📄 Offer letter ✓ Due diligence
Key facts
- 9,583 sq ft lot
- Parking
- Built 1955
Property features AI
Exterior
- Parking: 1 parking space total; 1 covered carport space
- Utilities: Public water; Public sewer
- Home design: Single-family residence; One level / 1 story; Entry level on main floor
- Construction: Vinyl siding; Block and slab foundation; Metal roof; Built as single-story construction
- Exterior features: Level lot; Asphalt road access; Publicly maintained city street frontage; Metal roof
Interior
- Kitchen: Dishwasher; Electric range; Microwave
- Bedrooms: 2 main-level bedrooms
- Flooring: Laminate; Vinyl
- Bathrooms: 2 full bathrooms; 1 half bathroom; 2 main-level bathrooms
- Heating & cooling: Natural gas heating; Additional heating details noted in remarks; Wall and window cooling units
- Interior features: Dishwasher; Electric range; Microwave; Laminate flooring; Vinyl flooring
Neighborhood map
What this means for you Summary
Snapshot
- This is a 2-bed/2.5-bath single-family listed at $95k. Condition is rated fair.
Deal economics
- At list price, monthly cash flow is $119 ($1k/yr) — positive.
- The deal already cash-flows at list — no discount required.
- Meets the 1% rule at list price ($981 rent vs $95k).
Location & tenants
- Location reads 60/100 on livability (#272 in TN) — a middle-class / working-renter tenant base. Strengths: cost of living A+, housing A+, crime B; Watch: health & safety C-, schools F, amenities F.
- Lake County (rural): math 11% / reading 14% proficiency, ranked #135 of 139 in TN (top 97%) — low school quality limits family demand, transient renter base, plan for 1-2y turnover; 71% free/reduced lunch — lower-income household profile, screen leases tightly.
- Market conditions: 21 active listings in the ZIP; 3 units permitted in Lake County in 2024 (0 in 5+ unit buildings).
Forward outlook
- Local home prices are declining (-3.0%/yr); year-one equity from $656 of loan paydown is wiped out by about $3k of value loss. Plan a longer hold.
- Lake County population projected to shrink 8% by 2050 — rents likely to lag national; underwrite the cash flow, not the appreciation.
Negotiation context
- Only 14 days on market — expect competitive offers; lowballing is unlikely to land.
- 2 sale attempts with the ask held roughly flat each time — persistent listings suggest the price (not the market) is what's stuck; bring a comps-based counter.
Risks & watch-outs
- Watch-outs: built in 1955 — expect roof / HVAC / electrical / plumbing capex.
- Climate carrying-cost: extreme-heat days projected 7→21/yr by 2055 (HVAC capex compounding) — expect insurance premiums to compound above CPI over the hold.
Questions for the listing agent
- Have any recent inspections been done? Can we get a copy of the seller's disclosures and any deferred-maintenance estimates?
- Built in 1955 — when were the roof, HVAC, electrical panel, plumbing, and water heater last replaced?
- Is there a deadline driving the sale (1031 exchange, divorce, estate, relocation)? That informs how much negotiation room exists.
- Schools are F-rated, which usually means shorter tenancies and higher turnover. Who's the typical renter profile here, and what's been the actual vacancy rate?
- What's the average days-on-market for RENTAL listings here right now (not sales)? A rising rental-DOM trend means longer vacancies and softer asking-rent achievability than the comps imply.
- What's the recent tenant-quality profile in this submarket — average credit score on applications, eviction rate, late-payment / NSF rate, and stable-employment percentage? A property-management company in the area should have these aggregated.
- How much new for-sale + rental construction is in the pipeline within 1–3 miles? Heavy new supply typically softens prices + rents 12–24 months out; constrained supply supports both.
Investment metrics
- 1% rule
- 1.03% ✓
- Cap rate
- 7.80%
- Cash-on-cash
- 5.37%
- DSCR
- 1.24
- GRM
- 8.1
CMA / ARV
- ARV (on-the-fly)
- $120,522
- Comps found
- 7
Show comp detail 7 sales within ~0.75 mi
| Address | Dist | Beds/Ba | Sqft | Sold | Price | $/sf | Match |
|---|---|---|---|---|---|---|---|
| 529 Church St | 0.05mi | 3/2.0 (+1) | 1,226 (+8%) | 2mo | $119,900 | $98 | 76 |
| 217 North St | 0.18mi | 3/1.0 (+1) | 1,060 (-7%) | 1mo | $104,900 | $99 | 69 |
| 423 N College St | 0.17mi | 2/1.0 | 1,196 (+5%) | 21mo | $136,000 | $114 | 60 |
| 224 Kimberly Cv | 0.31mi | 3/2.0 (+1) | 1,296 (+14%) | 13mo | $137,000 | $106 | 44 |
| 122 Sand St | 0.53mi | 3/2.0 (+1) | 1,274 (+12%) | 7mo | $100,000 | $78 | 42 |
| 305 Monk Argo Rd | 0.62mi | 3/2.0 (+1) | 1,280 (+13%) | 4mo | $190,000 | $148 | 40 |
| 435 Monk Argo Rd | 0.74mi | 2/1.0 | 1,040 (-8%) | 9mo | $127,500 | $123 | 38 |
Match score weights: distance 35% · size 25% · config 20% · recency 20%. Top-matched comps best support the ARV.
Projected returns pro-forma
-3.0% appreciation · 3.0% rent growth · sell at horizon
- IRR
- -8.0%
- Equity multiple
- 0.71×
- Total profit
- $-7,786
- Equity at exit
- $14,150
- IRR
- 1.6%
- Equity multiple
- 1.11×
- Total profit
- $3,037
- Equity at exit
- $8,205
Cash invested: $26,572 (down + closing). Projections, not guarantees.
Landlord ↔ Tenant lean methodology
- Overall (STATE)
- 87 Strongly Landlord-Friendly
- State Tennessee
- 87 Strongly Landlord-Friendly · R+13
- County
- — inherits STATE
- City
- — inherits STATE
ZIP-level market 38080
- Home prices YoY
- -1.7%
- Active inventory
- 21
- Price-to-rent
- 8.1×
Monthly cashflow live
- Estimated rent
- $981 medium interval (Pro) →
- Mortgage (P&I)
- −$498
- Tax est. 1.5%
- −$119 /mo · $1,424/yr
- Insurance
- −$40
- HOA
- −$0
- Vacancy / Maint / Mgmt
- −$206
- Net cashflow
- $119
Break-even live
UW: 25.0% down · 7.5% · 30yr · 1.5% tax · 5.0% vac · 8.0% maint · 8.0% mgmt
Financing live
Cash to close
- Down payment
- $23,725
- Closing costs
- $2,847
- Reserves months
- —
- Total cash needed
- —
Loan-product check · same deal, 3 products live
Conventional
25% down · 7.5% · 30yr
- Down + closing
- —
- Monthly P&I
- —
- Monthly cashflow
- —
- DSCR
- —
- Eligible?
- —
Personal DTI + credit; lowest rate.
DSCR
20% down · 8.5% · 30yr
- Down + closing
- —
- Monthly P&I
- —
- Monthly cashflow
- —
- DSCR
- —
- Eligible?
- —
No personal income docs; deal must DSCR.
Hard money
10% down · 12.0% · 12mo
- Down + closing
- —
- Monthly P&I
- —
- Monthly cashflow
- —
- DSCR
- —
- Eligible?
- —
Short-term bridge; refi at stabilization.
Listing history 10 events
-
2026-06-18days on market $94,900 Active 14 DOM
-
2026-06-17days on market $94,900 Active 13 DOM
-
2026-06-16days on market $94,900 Active 12 DOM
-
2026-06-15days on market $94,900 Active 11 DOM
-
2026-06-13days on market $94,900 Active 9 DOM
-
2026-06-12days on market $94,900 Active 8 DOM
-
2026-06-09days on market $94,900 Active 5 DOM
-
2026-06-08days on market $94,900 Active 4 DOM
-
2026-06-08days on market $94,900 Active 3 DOM
-
2026-06-05$94,900 Active 1 DOM
ⓘ Source: listings_history table (triggers on properties + properties_extension) + one-shot
backfill from property_details.listing_events for pre-trigger history.
Climate risk First Street
- Flood 1/10 Low FEMA zone X · 0% chance over 30 yrs
- Wildfire 1/10 Low
- Heat 6/10 Major 7 d/yr ≥107°F today · 21 d/yr by 30 yrs out
- Wind 4/10 Moderate 8% chance of damaging wind over 30 yrs
- Air quality 1/10 Low 0 unhealthy d/yr today · 0 by 30 yrs out
Nearby sold comps map
Loading sold comps map…
Walkable amenities ~0.75 mi
Loading nearby amenities…
Taxation est. · year 1
- Rental income
- $11,769
- − Mortgage interest
- −$5,316
- − Property taxes
- −$1,424
- − Insurance
- −$474
- − Repairs & maintenance
- −$942
- − Management
- −$942
- − Depreciation
- −$2,761
- Taxable loss
- −$89
- Est. tax savings @ 24.0%
- +$21
- After-tax cash flow
- $1,449/yr
For passive investors: Depreciation is non-cash, so a rental often shows a tax loss while cash-flowing — sheltering income. Rental losses are passive: they offset passive income freely, and up to $25,000/yr can offset ordinary (W-2) income if you actively participate and your MAGI is under $100k (phasing out to $0 by $150k); unused losses carry forward. On sale, claimed depreciation is recaptured at up to 25%, and gains may owe capital-gains tax (a 1031 exchange can defer both). Figures are a year-1 estimate at your 24.0% rate — not tax advice; consult a CPA.
Condition & rehab AI · 2 photos
This single-family home requires significant exterior repairs and maintenance, including painting, landscaping, and HVAC upgrades. While it has potential, the current condition is holding it back from achieving its full value.
Repairs flagged
- Major siding — Significant wear and tear
- Major roof — Aged appearance
- Major HVAC/mechanicals — No visible units, likely outdated
- Major landscaping — Sparse and unkempt
Value-add opportunities
- Both paint exterior — Fresh paint can significantly improve curb appeal and value
- Both landscaping — A well-maintained yard can increase both resale and rental value
- Both HVAC upgrade — Modern HVAC can improve comfort and energy efficiency, boosting both resale and rental appeal
Renovation cost estimate screening
| Repair item | Severity | Est. cost |
|---|---|---|
| siding · Significant wear and tear | Major | $15,000–50,000 |
| roof · Aged appearance | Major | $15,000–50,000 |
| HVAC/mechanicals · No visible units, likely outdated | Major | $15,000–50,000 |
| landscaping · Sparse and unkempt | Major | $15,000–50,000 |
| Total estimated repair cost · 4 items | $60,000–200,000 |
Value-add ROI direction
- Both paint exterior — Fresh paint can significantly improve curb appeal and value ↑
- Both landscaping — A well-maintained yard can increase both resale and rental value ↑
- Both HVAC upgrade — Modern HVAC can improve comfort and energy efficiency, boosting both resale and rental appeal ↑
ⓘ Cost ranges are severity-bucket heuristics (US national rule-of-thumb). Get contractor quotes + a written scope before underwriting a rehab budget.
Schools (NCES district)
- District
- Lake County
- NCES district ID
- 4702280
- Math proficiency
- 11% ▼ -9.00%
- Reading proficiency
- 14% ▼ -9.00%
- Median HH income
- $29,058
- Composite
- 9.69/100
- National rank
- #9833
- State rank
- #135 of 139 in TN
Livability — Ridgely
- Score
- 60/100
- State rank
- #272
- US rank
- #19162
Category grades
Schools grade is shown separately in the Schools card above.
Census & demographics
- Census place
- Ridgely, TN
- Population (ZIP)
- 2,492
Population outlook (Lake County) Hauer SSP2
- Today (2025)
- 7,234 people
- By 2030
- 7,045 · -2.6%
- By 2040
- 6,848 · -5.3%
- By 2050
- 6,681 · -7.6%
- By 2075
- 5,629 · -22.2%
- By 2100
- 4,211 · -41.8%
Race, ethnicity, and origin ACS 2023
- Neighborhood character
- Predominantly White (71%)
- Race & ethnicity
- White 71% Black 17% Two or more races 11% Hispanic / Latino 5%
- Common ancestry
- Italian 1%
- Foreign-born
- 2% · Canada
- Languages at home
- 98% English-only · Spanish 2% French/Haitian/Cajun 1%
Political lean MEDSL · Lake
- 2024 margin
- Solid R (+54.9) · D 22.1% · R 77.0%
- 2008→2024 swing
- -48.1pp toward R · 2008: -6.7pp · 2024: -54.9pp
- All cycles
- 2024: R+54.9 2020: R+47.5 2016: R+39.6 2012: R+13.4 2008: R+6.7
Not yet ingested
- Civics
- —
Market trends
- HPI YoY
- ▼ -3.11%
- Current HPI
- 178.0147
- Rent YoY
- —
- Metro
- —
- State GDP YoY
- ▲ 2.78%
- F500 in state
- 22
Industry mix (Fortune 500 HQ in TN)
| Industry | F500 HQs | Revenue |
|---|---|---|
| Healthcare | 3 | $91B |
|
||
| Retail | 3 | $72B |
|
||
| Transportation / Logistics | 1 | $88B |
|
||
| Paper / Packaging | 1 | $19B |
|
||
| Insurance | 1 | $13B |
|
||
| Energy | 1 | $12B |
|
||
Price history
+0.0% since first listed2 events — show timeline
- 2026-06-04 Listed $94,900 CWTAR
- 2026-06-04 Listed $94,900 RRAR as distributed by MLS GRID
Cash-flow waterfall
monthlySold comps — $/sqft
last 12 mo · ≤1 miLoading sold comps…