60454 N Tranquility Rd · Lacombe, LA
Flood risk No data
- FEMA flood zone
- —
- Chance of flooding over 30 yrs
- —
- Est. flood insurance / yr
- —
Fire risk No data
- Est. fire insurance / yr
- —
Heat risk No data
- Hot days now (above threshold)
- —
- Hot days in 30 yrs
- —
Wind risk No data
- Chance of severe wind over 30 yrs
- —
Air-quality risk No data
- Unhealthy air days now
- —
- Unhealthy air days in 30 yrs
- —
Risk factors via First Street. Map © Google.
Why this score? — see what drove the B- grade
The composite is a weighted blend of 9 inputs, each scored 0–100. Each bar is that input's sub-score; the figure is the points it added to the 100-point composite (weight × sub-score).
- Cash flow +30.0/30.0
- 1% rule +10.0/10.0
- DSCR +10.0/10.0
- ARV discount +7.5/15.0
- Schools +4.3/10.0
- Livability +3.2/5.0
- Rent growth +2.5/5.0
- Condition / age +2.5/5.0
- Appreciation +0.0/10.0
$80,000
🖨 Deal sheet 📄 Offer letter ✓ Due diligence
Listing remarks MLS
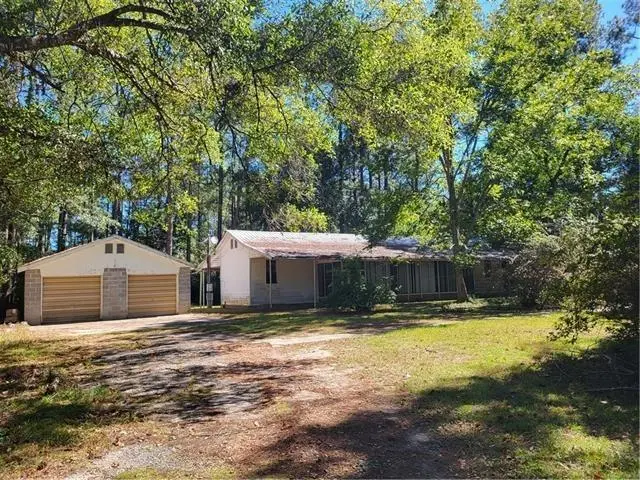
Investor opportunity! The mobile home is in disrepair but offers great potential for those looking to invest in a fixer-upper or build new. Beautiful and secluded, this 1.46 ac property has ton of potential. There is a 2 car concrete garage and another storage shed on the property. Please use caution when entering the home - floors are soft in some areas. Utilities will not be turned on for inspections. Sold AS IS, no exception, repairs, replacements. Property is a Succession property and is Subject to Court Approval.
Key facts
- 1.46 ac property
- Secluded
- Storage shed
Tags
Neighborhood map
What this means for you Summary
Snapshot
- This is a 2-bed/2.0-bath single-family listed at $80k.
Deal economics
- At list price, monthly cash flow is $709 ($9k/yr) — positive.
- The deal already cash-flows at list — no discount required.
- Meets the 1% rule at list price ($2k rent vs $80k).
- Recommended offer: $70k (12.0% below list) — sets the bar for market timing.
- Cap rate 16.9% vs local median 4.2% in Lacombe — top-decile yield for the area; either an underpriced asset or a hidden risk that comps aren't pricing in. Stress-test before assuming the spread holds.
Location & tenants
- Location reads 63/100 on livability (#188 in LA) — a middle-class / working-renter tenant base. Strengths: cost of living A+, housing A+, crime B; Watch: employment C-, amenities F, commute F.
- St. Tammany Parish (suburban): math 43% / reading 55% proficiency, ranked #11 of 98 in LA (top 11%) — families likely to look elsewhere, expect single-tenant / working-renter base with shorter leases.
- Market conditions: 219 active listings in the ZIP; 4 comparable units currently listed for rent nearby; rentals lingering (median 44d on market — plan ~5-8 weeks vacancy on turnover, expect pricing pressure); 75% of comp listings sitting > 30 days — soft ceiling on asking rent; 1,064 units permitted in St. Tammany Parish in 2024 (0 in 5+ unit buildings).
Forward outlook
- Local home prices are declining (-3.0%/yr); year-one equity from $553 of loan paydown is wiped out by about $2k of value loss. Plan a longer hold.
- St. Tammany County population projected at +27% by 2050 — long-run rental-demand tailwind backs the buy-and-hold thesis.
- At projected returns (-3.0% appreciation + 3.0% rent growth), your $22k cash investment doubles in ~4 years — after that, you're playing with house money.
Negotiation context
- It's been on market 127 days — a 12% lower offer ($70k) is reasonable based on typical stale-listing flexibility.
- 4 sale attempts since 2y ago with the ask held roughly flat each time — persistent listings suggest the price (not the market) is what's stuck; bring a comps-based counter.
Questions for the listing agent
- It's been on market 127 days. Have you received any prior offers? Is the seller open to a 12% concession, seller financing, or rate buy-down credit?
- Why hasn't it sold? Are there any deal-killer items the seller is aware of (foundation, flood, title, zoning, code violations)?
- Is there a deadline driving the sale (1031 exchange, divorce, estate, relocation)? That informs how much negotiation room exists.
- Schools are B-rated — typically a magnet for longer-tenancy family renters. What's the average tenant stay here, and is there a school-zone premium baked into asking?
- What's the average days-on-market for RENTAL listings here right now (not sales)? A rising rental-DOM trend means longer vacancies and softer asking-rent achievability than the comps imply.
- What's the recent tenant-quality profile in this submarket — average credit score on applications, eviction rate, late-payment / NSF rate, and stable-employment percentage? A property-management company in the area should have these aggregated.
- How much new for-sale + rental construction is in the pipeline within 1–3 miles? Heavy new supply typically softens prices + rents 12–24 months out; constrained supply supports both.
Investment metrics
- 1% rule
- 2.00% ✓
- Cap rate
- 16.93%
- Cash-on-cash
- 37.99%
- DSCR
- 2.69
- GRM
- 4.2
CMA / ARV
- ARV (median comp)
- $207,616
- List price
- $80,000
- Delta
- -61.47%
- Verdict
- UNDERPRICED
- Comps
- 20 within 1.0 mi
Show comp detail 3 sales within ~0.75 mi
| Address | Dist | Beds/Ba | Sqft | Sold | Price | $/sf | Match |
|---|---|---|---|---|---|---|---|
| 31219 May St | 0.18mi | 3/2.0 (+1) | 1,171 (-6%) | 1mo | $165,000 | $141 | 75 |
| 31201 Lydia St | 0.23mi | 3/2.0 (+1) | 1,283 (+3%) | 18mo | $190,000 | $148 | 65 |
| 31233 Lydia St | 0.25mi | 3/2.0 (+1) | 1,123 (-10%) | 13mo | $185,000 | $165 | 55 |
Match score weights: distance 35% · size 25% · config 20% · recency 20%. Top-matched comps best support the ARV.
Projected returns pro-forma
-3.0% appreciation · 3.0% rent growth · sell at horizon
- IRR
- 34.0%
- Equity multiple
- 2.44×
- Total profit
- $32,229
- Equity at exit
- $11,928
- IRR
- 40.9%
- Equity multiple
- 4.85×
- Total profit
- $86,323
- Equity at exit
- $6,917
Cash invested: $22,400 (down + closing). Projections, not guarantees.
Landlord ↔ Tenant lean methodology
- Overall (STATE)
- 90 Strongly Landlord-Friendly
- State Louisiana
- 90 Strongly Landlord-Friendly · R+12
- County
- — inherits STATE
- City
- — inherits STATE
ZIP-level market 70445
- Home prices YoY
- -24.4%
- Active inventory
- 219
- Price-to-rent
- 4.2×
Monthly cashflow live
- Estimated rent
- $1,598 medium interval (Pro) →
- Mortgage (P&I)
- −$420
- Tax est. 1.5%
- −$100 /mo · $1,200/yr
- Insurance
- −$33
- HOA
- −$0
- Vacancy / Maint / Mgmt
- −$335
- Net cashflow
- $709
Break-even live
UW: 25.0% down · 7.5% · 30yr · 1.5% tax · 5.0% vac · 8.0% maint · 8.0% mgmt
Financing live
Cash to close
- Down payment
- $20,000
- Closing costs
- $2,400
- Reserves months
- —
- Total cash needed
- —
Loan-product check · same deal, 3 products live
Conventional
25% down · 7.5% · 30yr
- Down + closing
- —
- Monthly P&I
- —
- Monthly cashflow
- —
- DSCR
- —
- Eligible?
- —
Personal DTI + credit; lowest rate.
DSCR
20% down · 8.5% · 30yr
- Down + closing
- —
- Monthly P&I
- —
- Monthly cashflow
- —
- DSCR
- —
- Eligible?
- —
No personal income docs; deal must DSCR.
Hard money
10% down · 12.0% · 12mo
- Down + closing
- —
- Monthly P&I
- —
- Monthly cashflow
- —
- DSCR
- —
- Eligible?
- —
Short-term bridge; refi at stabilization.
Rent comps 4 comps
| Address | Beds | Baths | Sqft | Rent | $/sqft | DOM | Units | Dist |
|---|---|---|---|---|---|---|---|---|
| 60309 W Spruce Ln Lacombe, LA | 3.0 | 2.0 | 1170 | $1,450 | $1.24 | 21d | 1 | 0.50mi |
| 61138 Jade St Lacombe, LA | 3.0 | 2.0 | 1500 | $1,700 | $1.13 | 43d | 1 | 1.33mi |
| 60407 Vermillion Dr Slidell, LA | 3.0 | 2.0 | 1460 | $1,700 | $1.16 | 43d | 1 | 1.49mi |
| 60399 Vermillon Dr Lacombe, LA | 3.0 | 2.0 | 1401 | $1,850 | $1.32 | 43d | 1 | 1.49mi |
Listing history 17 events
-
2026-06-18days on market $80,000 Active 127 DOM
-
2026-06-17days on market $80,000 Active 126 DOM
-
2026-06-16days on market $80,000 Active 125 DOM
-
2026-06-15days on market $80,000 Active 124 DOM
-
2026-06-13days on market $80,000 Active 122 DOM
-
2026-06-10days on market $80,000 Active 119 DOM
-
2026-06-09days on market $80,000 Active 118 DOM
-
2026-06-08days on market $80,000 Active 117 DOM
-
2026-06-07days on market $80,000 Active 116 DOM
-
2026-06-03days on market $80,000 Active 112 DOM
-
2026-06-02days on market $80,000 Active 111 DOM
-
2026-06-01days on market $80,000 Active 110 DOM
-
2026-05-31days on market $80,000 Active 109 DOM
-
2026-02-11$80,000 Active 524-char remark
Show marketing remark (523 chars)
Investor opportunity! The mobile home is in disrepair but offers great potential for those looking to invest in a fixer-upper or build new. Beautiful and secluded, this 1.46 ac property has ton of potential. There is a 2 car concrete garage and another storage shed on the property. Please use caution when entering the home - floors are soft in some areas. Utilities will not be turned on for inspections. Sold AS IS, no exception, repairs, replacements. Property is a Succession property and is Subject to Court Approval.
-
2026-02-11$80,000 Active 523-char remark
Show marketing remark (523 chars)
Investor opportunity! The mobile home is in disrepair but offers great potential for those looking to invest in a fixer-upper or build new. Beautiful and secluded, this 1.46 ac property has ton of potential. There is a 2 car concrete garage and another storage shed on the property. Please use caution when entering the home - floors are soft in some areas. Utilities will not be turned on for inspections. Sold AS IS, no exception, repairs, replacements. Property is a Succession property and is Subject to Court Approval.
-
2025-05-16$89,000 Active
-
2024-11-01$99,000 Active
ⓘ Source: listings_history table (triggers on properties + properties_extension) + one-shot
backfill from property_details.listing_events for pre-trigger history.
Nearby sold comps map
Loading sold comps map…
Walkable amenities ~0.75 mi
Loading nearby amenities…
Taxation est. · year 1
- Rental income
- $19,170
- − Mortgage interest
- −$4,481
- − Property taxes
- −$1,200
- − Insurance
- −$400
- − Repairs & maintenance
- −$1,534
- − Management
- −$1,534
- − Depreciation
- −$2,327
- Taxable income
- $7,694
- Est. tax owed @ 24.0%
- −$1,847
- After-tax cash flow
- $6,663/yr
For passive investors: Depreciation is non-cash, so a rental often shows a tax loss while cash-flowing — sheltering income. Rental losses are passive: they offset passive income freely, and up to $25,000/yr can offset ordinary (W-2) income if you actively participate and your MAGI is under $100k (phasing out to $0 by $150k); unused losses carry forward. On sale, claimed depreciation is recaptured at up to 25%, and gains may owe capital-gains tax (a 1031 exchange can defer both). Figures are a year-1 estimate at your 24.0% rate — not tax advice; consult a CPA.
Schools (NCES district)
- District
- St. Tammany Parish
- NCES district ID
- 2201650
- Math proficiency
- 43% ▼ -32.00%
- Reading proficiency
- 55% ▼ -26.00%
- Median HH income
- $61,752
- Composite
- 43.04/100
- National rank
- #3098
- State rank
- #11 of 98 in LA
Livability — Lacombe
- Score
- 63/100
- State rank
- #188
- US rank
- #15034
Category grades
Schools grade is shown separately in the Schools card above.
Census & demographics
- Population (ZIP)
- 9,421
Population outlook (St. Tammany County) Hauer SSP2
- Today (2025)
- 286,725 people
- By 2030
- 304,175 · +6.1%
- By 2040
- 336,203 · +17.3%
- By 2050
- 364,590 · +27.2%
- By 2075
- 433,362 · +51.1%
- By 2100
- 470,333 · +64.0%
Race, ethnicity, and origin ACS 2023
- Neighborhood character
- Diverse neighborhood (Simpson 0.61)
- Race & ethnicity
- White 56% Black 25% Two or more races 15% Hispanic / Latino 12% Asian 1%
- Hispanic origin (detail)
- Mexican 4%
- Common ancestry
- Lithuanian 13% Italian 2% Iranian 1%
- Foreign-born
- 3% · Canada
- Languages at home
- 91% English-only · Spanish 6% French/Haitian/Cajun 2% Other Indo-European 1%
Political lean MEDSL · St. Tammany
- 2024 margin
- Solid R (+43.8) · D 27.3% · R 71.1% · Other 1.6%
- 2008→2024 swing
- +9.6pp toward D · 2008: -53.4pp · 2024: -43.8pp
- All cycles
- 2024: R+43.8 2020: R+44.2 2016: R+50.8 2012: R+52.2 2008: R+53.4
Not yet ingested
- Civics
- —
Market trends
- HPI YoY
- ▼ -57.75%
- Current HPI
- 178.5418
- Rent YoY
- —
- Metro
- —
- State GDP YoY
- ▲ 3.29%
- F500 in state
- 10
Industry mix (Fortune 500 HQ in LA)
| Industry | F500 HQs | Revenue |
|---|---|---|
| Telecommunications | 2 | $23B |
|
||
| Utilities | 1 | $12B |
|
||
| Wholesale / Distribution | 1 | $5B |
|
||
| Advertising | 1 | $2B |
|
||
Price history
-19.2% since first listed4 events — show timeline
- 2026-02-11 Listed $80,000 AcadianaMLS
- 2026-02-11 Listed $80,000 GSREIN
- 2025-05-16 Listed $89,000 AcadianaMLS
- 2024-11-01 Listed $99,000 AcadianaMLS
Property tax history
-22.6%/yrLatest (2025): $39 · +0.0% YoY. Source: county tax records.
Cash-flow waterfall
monthlySold comps — $/sqft
last 12 mo · ≤1 miLoading sold comps…