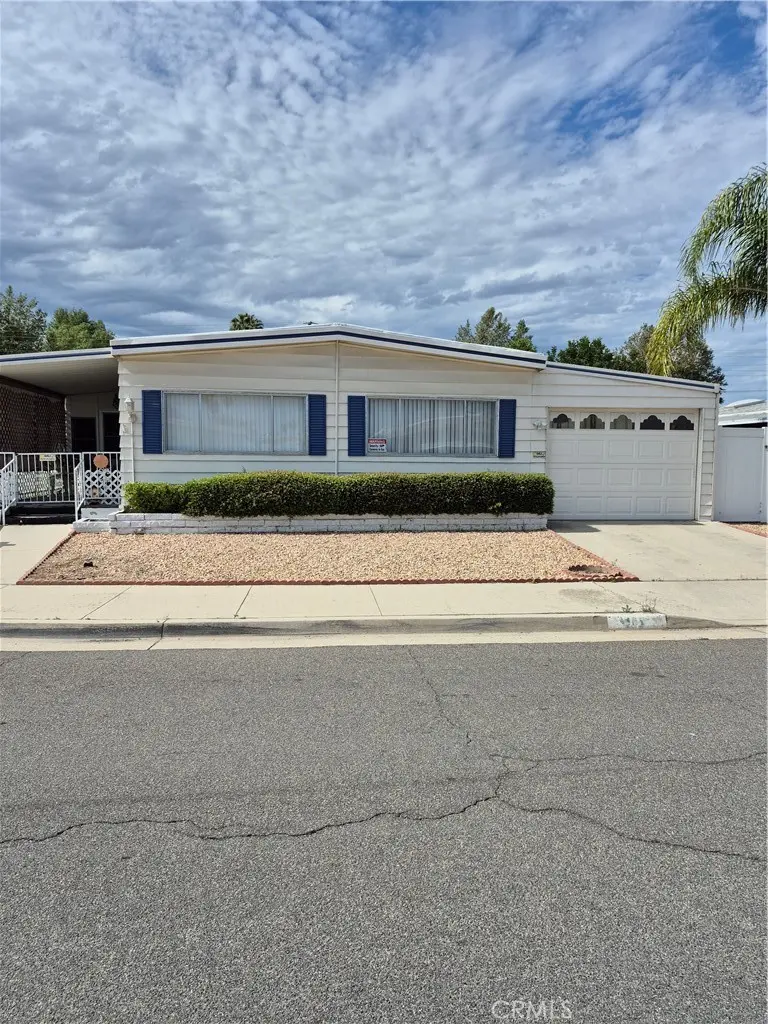
955 Camino Del Rancho · Hemet, CA
Flood risk 1/10 · Minimal
- FEMA flood zone
- X (shaded)
- Chance of flooding over 30 yrs
- 0.0%
- Est. flood insurance / yr
- $507 – $1,088
Fire risk 6/10 · Moderate
- Est. fire insurance / yr
- $659 – $1,223
Heat risk 7/10 · Major
- Hot days now (above 104°F)
- 6 days/yr
- Hot days in 30 yrs
- 18 days/yr
Wind risk 1/10 · Minimal
- Chance of severe wind over 30 yrs
- —
Air-quality risk 6/10 · Moderate
- Unhealthy air days now
- 9 days/yr
- Unhealthy air days in 30 yrs
- 11 days/yr
Risk factors via First Street. Map © Google.
Why this score? — see what drove the D+ grade
The composite is a weighted blend of 9 inputs, each scored 0–100. Each bar is that input's sub-score; the figure is the points it added to the 100-point composite (weight × sub-score).
- Cash flow +24.1/30.0
- DSCR +7.8/10.0
- 1% rule +6.1/10.0
- Rent growth +2.9/5.0
- Livability +2.6/5.0
- Schools +2.5/10.0
- Condition / age +2.5/5.0
- ARV discount +0.0/15.0
- Appreciation +0.0/10.0
$170,000
🖨 Deal sheet 📄 Offer letter ✓ Due diligence
Listing remarks MLS
GORGEOUS 2 BEDROOM 2 BATH HOME 'PRIDE OF OWNERSHIP' LOCATED AT SIERRA DAWN ESTATES. .. .. A 55+ COMMUNITY "YOU OWN THE LAND". ENJOY ALL THAT SIERRA DAWN HOA HAS TO OFFER. 4 CLUBHOUSES , 4 POOLS WITH HEATED SPAS. THIS HOME FEATURES 2 FULL BEDROOMS WITH 2 FULL BATHS. .. .BOTH BATHROOMS JUST RECENTLY UPGRADED. .. .BEAUTIFUL HARDWOOD FLOORING THROUGHOUT. SPACIOUS COVERED CARPORT WITH AUTOMATIC LIFT GARAGE DOOR ADDING A LITTLE EXTRA SECURITY FOR YOU AND YOUR FAMILY. LARGE LIVING ROOM WITH FORMAL DINING AREA. NEWER UPGRADED KITCHEN CABINETS WITH INDOOR WASHER AND DRYER CONVIENTLY LOCATED NEAR KITCHEN. ONE OF THE LARGEST LOTS OFFERED AT SIERRA DAWN ESTATES WITH ENCLOSED SCREENED IN PATIO AREA. TRULY ONE OF THE MOST BEAUTIFUL HOMES OFFERED AT SIERRA DAWN. }}}}}MASK ARE REQUIRED WHEN VIEWING PROPERTY{{{{{{{{{
Key facts
- 5,227 sq ft lot
- Garage
- Community pool
Property features AI
Finance
- Other: Street lighting, storm drains and sidewalks in the community; Access via paved city streets
- HOA & community: Part of Sierra Dawn Estates HOA; Semi-annual HOA fee; Senior community; Community amenities: clubhouse, pool, spa, gym/exercise room, sauna, card room, billiard room, pickleball, dog park, barbecue, pet rules
Exterior
- Parking: Carport (2 spaces); Garage with single door and front entry; Has parking
- Security: Smoke detector; Carbon monoxide detector(s)
- Utilities: Public (district) water; Public sewer; Natural gas connected; Electricity connected; Cable connected; Telephone in street; Sewer connected; Water connected
- Home design: North-facing; One story; Entry at front; Entry level 1; Turnkey condition; No common walls
- Construction: Pier jacks foundation; Other roof
- Exterior features: Manufactured house; Front and rear porches; Front porch on slab; Porch - rear; Shed; Community pool; Community spa; Masonry and vinyl fencing; Yard; Lot is level/flat; No landscaping
Interior
- Kitchen: Garbage disposal; Refrigerator; Gas range and gas oven; Gas water heater; Water heater unit; Dining area in kitchen; Formal dining room
- Bedrooms: Two main-level bedrooms; All bedrooms on one level
- Flooring: Vinyl flooring
- Bathrooms: Two full bathrooms; Bathtub; Shower; Shower in tub; Walk-in shower; Privacy toilet door
- Heating & cooling: Central cooling; Central furnace heating
- Interior features: Furnished; Ceiling fan; Storage space; Drapes/Curtains; Carbon monoxide detector(s); Smoke detector
- Laundry & utility: Inside laundry; Washer included; Dryer included; Washer hookup; Gas dryer hookup; Laundry in closet
Neighborhood map
What this means for you Summary
Snapshot
- This is a 2-bed/2.0-bath manufactured listed at $170k.
Deal economics
- At list price, monthly cash flow is $335 ($4k/yr) — positive.
- The deal already cash-flows at list — no discount required.
- Meets the 1% rule at list price ($2k rent vs $170k).
- Cap rate 8.7% vs local median 4.9% in Hemet — top-decile yield for the area; either an underpriced asset or a hidden risk that comps aren't pricing in. Stress-test before assuming the spread holds.
Location & tenants
- Location reads 51/100 on livability (#1,056 in CA) — a working-class tenant base; expect higher turnover. Strengths: housing A+; Watch: crime D+, schools F, amenities F.
- Hemet Unified (suburban): math 19% / reading 41% proficiency, ranked #360 of 517 in CA (top 70%) — families likely to look elsewhere, expect single-tenant / working-renter base with shorter leases; 66% free/reduced lunch — lower-income household profile, screen leases tightly.
- Market conditions: Rents rising (+1.8%/yr); 264 active listings in the ZIP; 40 comparable units currently listed for rent nearby; rentals at typical pace (median 22d on market — plan ~3-4 weeks tenant-placement turnaround); 9,195 units permitted in Riverside County in 2024 (1,512 in 5+ unit buildings).
- At $1,886/mo this rent would consume 46% of the median local household income ($49k/yr) (locally 2144% of renters already pay >50% of income on rent) — very limited rent-growth headroom before tenants either downsize or default.
Forward outlook
- Local home prices are declining (-3.0%/yr); year-one equity from $1k of loan paydown is wiped out by about $5k of value loss. Plan a longer hold.
- Riverside County population projected at +22% by 2050 — long-run rental-demand tailwind backs the buy-and-hold thesis.
Negotiation context
- Only 1 days on market — expect competitive offers; lowballing is unlikely to land.
- 3 sale attempts since 7y ago; this cycle's ask is 26% above the opening price — seller raised mid-cycle; expect resistance to lowballs.
Risks & watch-outs
- Climate carrying-cost: major wildfire risk; extreme-heat days projected 6→18/yr by 2055 (HVAC capex compounding) — expect insurance premiums to compound above CPI over the hold.
Questions for the listing agent
- Built in 1975 — when were the roof, HVAC, electrical panel, plumbing, and water heater last replaced?
- What does the HOA fee cover, when was the last increase, and are there any pending special assessments or reserve-fund shortfalls?
- Is there a deadline driving the sale (1031 exchange, divorce, estate, relocation)? That informs how much negotiation room exists.
- Schools are F-rated, which usually means shorter tenancies and higher turnover. Who's the typical renter profile here, and what's been the actual vacancy rate?
- Crime grade is D in this area — have there been break-ins, vandalism, or insurance claims at this property in the last 3 years? What carrier currently insures it and at what premium?
- The area grade is low — what's the realistic commute time and amenity access for the typical tenant pool here? Any planned neighborhood developments (good or bad) we should know about?
- What's the average days-on-market for RENTAL listings here right now (not sales)? A rising rental-DOM trend means longer vacancies and softer asking-rent achievability than the comps imply.
- What's the recent tenant-quality profile in this submarket — average credit score on applications, eviction rate, late-payment / NSF rate, and stable-employment percentage? A property-management company in the area should have these aggregated.
- How much new for-sale + rental construction is in the pipeline within 1–3 miles? Heavy new supply typically softens prices + rents 12–24 months out; constrained supply supports both.
Investment metrics
- 1% rule
- 1.11% ✓
- Cap rate
- 8.66%
- Cash-on-cash
- 8.44%
- DSCR
- 1.38
- GRM
- 7.5
CMA / ARV
- ARV (on-the-fly)
- $134,784
- Comps found
- 12
Show comp detail 12 sales within ~0.75 mi
| Address | Dist | Beds/Ba | Sqft | Sold | Price | $/sf | Match |
|---|---|---|---|---|---|---|---|
| 1167 Via Del Mesa | 0.15mi | 2/2.0 | 1,152 (0%) | 1mo | $135,000 | $117 | 93 |
| 1083 Via Del Mesa | 0.09mi | 2/2.0 | 1,200 (+4%) | 3mo | $149,900 | $125 | 86 |
| 1111 W Johnston Ave | 0.23mi | 2/2.0 | 1,200 (+4%) | 0mo | $135,000 | $113 | 82 |
| 711 San Mateo Cir | 0.45mi | 2/1.5 | 1,140 (-1%) | 4mo | $93,500 | $82 | 72 |
| 360 Santa Clara Cir | 0.47mi | 2/2.0 | 1,120 (-3%) | 3mo | $224,000 | $200 | 71 |
| 770 S Lyon | 0.58mi | 2/2.0 | 1,152 (0%) | 3mo | $78,900 | $68 | 70 |
| 190 Santa Lucia | 0.46mi | 2/2.0 | 1,040 (-10%) | 4mo | $179,000 | $172 | 59 |
| 220 San Carlos Dr | 0.43mi | 2/1.0 | 1,020 (-12%) | 2mo | $127,000 | $125 | 55 |
| 1760 Santiago | 0.69mi | 2/2.0 | 1,248 (+8%) | 0mo | $118,000 | $95 | 54 |
| 1455 S State St #111 | 0.60mi | 2/2.0 | 1,040 (-10%) | 3mo | $102,000 | $98 | 54 |
| 995 Santa Teresa Way | 0.57mi | 3/2.0 (+1) | 1,056 (-8%) | 3mo | $185,000 | $175 | 52 |
| 431 San Mateo Cir | 0.56mi | 3/2.0 (+1) | 1,040 (-10%) | 3mo | $118,000 | $113 | 50 |
Match score weights: distance 35% · size 25% · config 20% · recency 20%. Top-matched comps best support the ARV.
Projected returns pro-forma
-3.0% appreciation · 1.76% rent growth · sell at horizon
- IRR
- -4.9%
- Equity multiple
- 0.82×
- Total profit
- $-8,528
- Equity at exit
- $25,348
- IRR
- 3.3%
- Equity multiple
- 1.23×
- Total profit
- $10,799
- Equity at exit
- $14,698
Cash invested: $47,600 (down + closing). Projections, not guarantees.
Landlord ↔ Tenant lean methodology
- Overall (STATE)
- 18 Strongly Tenant-Friendly
- State California
- 18 Strongly Tenant-Friendly · D+13
- County
- — inherits STATE
- City
- — inherits STATE
ZIP-level market 92543
- Home prices YoY
- -26.7%
- Rents YoY
- 1.8%
- Active inventory
- 264
- Price-to-rent
- 7.5×
Monthly cashflow live
- Estimated rent
- $1,886 high interval (Pro) →
- Mortgage (P&I)
- −$891
- Tax from tax record
- −$162 /mo · $1,943/yr
- Insurance
- −$71
- HOA
- −$31
- Vacancy / Maint / Mgmt
- −$396
- Net cashflow
- $335
Break-even live
UW: 25.0% down · 7.5% · 30yr · 1.5% tax · 5.0% vac · 8.0% maint · 8.0% mgmt
Financing live
Cash to close
- Down payment
- $42,500
- Closing costs
- $5,100
- Reserves months
- —
- Total cash needed
- —
Loan-product check · same deal, 3 products live
Conventional
25% down · 7.5% · 30yr
- Down + closing
- —
- Monthly P&I
- —
- Monthly cashflow
- —
- DSCR
- —
- Eligible?
- —
Personal DTI + credit; lowest rate.
DSCR
20% down · 8.5% · 30yr
- Down + closing
- —
- Monthly P&I
- —
- Monthly cashflow
- —
- DSCR
- —
- Eligible?
- —
No personal income docs; deal must DSCR.
Hard money
10% down · 12.0% · 12mo
- Down + closing
- —
- Monthly P&I
- —
- Monthly cashflow
- —
- DSCR
- —
- Eligible?
- —
Short-term bridge; refi at stabilization.
Rent comps 40 comps
| Address | Beds | Baths | Sqft | Rent | $/sqft | DOM | Units | Dist |
|---|---|---|---|---|---|---|---|---|
| 893 S Palm Ave Hemet, CA | 2.0 | 2.0 | 720 | $1,375 | $1.91 | 5d | 1 | 0.23mi |
| 1025 S Gilbert St Hemet, CA | 1.0–2.0 | 1.0–2.0 | 890 | $2,320 | $2.61 | 2d | 8 | 0.23mi |
| 750 Santa Clara Cir Hemet, CA | 2.0 | 2.0 | 800 | $1,400 | $1.75 | 15d | 1 | 0.23mi |
| 1005 S Gilbert St Hemet, CA | 2.0 | 1.5 | 975 | $1,825 | $1.87 | 24d | 2 | 0.28mi |
| 120 Santa Lucia Dr Hemet, CA | 2.0 | 2.0 | 1197 | $1,600 | $1.34 | 43d | 1 | 0.42mi |
| 101 San Mateo Cir Hemet, CA | 2.0 | 2.0 | 1152 | $1,725 | $1.50 | 16d | 1 | 0.43mi |
| 876 W Whittier Ave Unit 878 Hemet, CA | 2.0 | 2.0 | 1127 | $2,150 | $1.91 | 24d | 1 | 0.47mi |
| 735 S Gilbert St Hemet, CA | 3.0 | 2.0 | 1202 | $2,400 | $2.00 | 43d | 1 | 0.50mi |
| 716 Robert Dr Hemet, CA | 3.0 | 2.0 | 1450 | $2,300 | $1.59 | 5d | 1 | 0.56mi |
| 611 S Palm Ave Unit K Hemet, CA | 2.0 | 2.0 | 1254 | $1,895 | $1.51 | 7d | 1 | 0.56mi |
| 1521 W Westmont Ave Hemet, CA | 2.0 | 2.0 | 1197 | $2,000 | $1.67 | 43d | 1 | 0.59mi |
| 390 Magnolia Cir Hemet, CA | 2.0 | 2.0 | 1038 | $2,400 | $2.31 | 4d | 1 | 0.73mi |
| 471 S Simpson Ave Unit D Hemet, CA | 2.0 | 2.0 | 900 | $1,750 | $1.94 | 43d | 1 | 0.74mi |
| 853 Douglas Ct Hemet, CA | 2.0 | 2.0 | 1148 | $1,850 | $1.61 | 4d | 1 | 0.75mi |
| 1461 W Mayberry Ave Hemet, CA | 2.0 | 2.0 | 1044 | $1,750 | $1.68 | 43d | 1 | 0.77mi |
| 860 Douglas Ct Hemet, CA | 2.0 | 2.0 | 1114 | $1,850 | $1.66 | 18d | 1 | 0.78mi |
| 1711 Pepper Tree Dr Hemet, CA | 2.0 | 2.0 | 864 | $1,675 | $1.94 | 22d | 1 | 0.78mi |
| 409 E Thornton Ave Hemet, CA | 2.0 | 1.0 | 970 | $1,912 | $1.97 | 2d | 2 | 0.78mi |
| 1955 Silver Oak Way Hemet, CA | 3.0 | 2.0 | 1318 | $2,250 | $1.71 | 43d | 1 | 0.80mi |
| 576 Montecito Ave Unit C Hemet, CA | 2.0 | 2.0 | 861 | $1,850 | $2.15 | 16d | 1 | 0.85mi |
| 471 Whitney Dr Hemet, CA | 2.0 | 2.0 | 1085 | $1,800 | $1.66 | 5d | 1 | 0.86mi |
| 1850 Amberwood Dr Hemet, CA | 2.0 | 2.0 | 1170 | $1,561 | $1.33 | 43d | 1 | 0.88mi |
| 640 Vista del Monte Hemet, CA | 3.0 | 2.0 | 1480 | $2,650 | $1.79 | 43d | 1 | 0.89mi |
| 363 S Gilbert St Unit B Hemet, CA | 3.0 | 2.0 | 1200 | $1,900 | $1.58 | 14d | 1 | 0.89mi |
| 363 S Gilbert St Hemet, CA | 3.0 | 2.0 | 1200 | $1,900 | $1.58 | 4d | 1 | 0.89mi |
| 678 Monterey Pl Hemet, CA | 2.0 | 2.0 | 1047 | $1,995 | $1.91 | 43d | 1 | 0.90mi |
| 700 Johnston Ave Unit 708 Hemet, CA | 2.0 | 1.0 | 1000 | $1,600 | $1.60 | 7d | 1 | 0.96mi |
| 683 Jonquil St Hemet, CA | 3.0 | 2.0 | 1150 | $2,448 | $2.13 | 24d | 1 | 1.07mi |
| 2098 W Acacia Ave Hemet, CA | 1.0–3.0 | 1.0–2.0 | 895 | $2,035 | $2.27 | 1d | 1 | 1.20mi |
| 1354 Jasmine Way Hemet, CA | 2.0 | 2.0 | 1440 | $1,650 | $1.15 | 43d | 1 | 1.23mi |
| 2403 W Acacia Ave Hemet, CA | 2.0 | 2.0 | 910 | $1,995 | $2.19 | 7d | 1 | 1.30mi |
| 1315 W Latham Ave Hemet, CA | 3.0 | 2.5 | 1340 | $2,550 | $1.90 | 43d | 1 | 1.30mi |
| 165 N Hamilton Ave Unit 4 Hemet, CA | 1.0 | 1.0 | 768 | $1,525 | $1.99 | 22d | 1 | 1.31mi |
| 165 N Hamilton Ave Unit 3 Hemet, CA | 1.0 | 1.0 | 768 | $1,450 | $1.89 | 5d | 1 | 1.31mi |
| 2469 W Acacia Ave Hemet, CA | 2.0 | 2.0 | 910 | $1,750 | $1.92 | 24d | 1 | 1.31mi |
| 733 S San Jacinto St Unit B Hemet, CA | 2.0 | 1.0 | 1000 | $1,500 | $1.50 | 24d | 1 | 1.32mi |
| 1287 Olive Tree Ln Unit D Hemet, CA | 2.0 | 1.0 | 995 | $1,599 | $1.61 | 43d | 1 | 1.39mi |
| 1287 Olive Tree Ln Unit C Hemet, CA | 2.0 | 1.0 | 995 | $1,495 | $1.50 | 24d | 1 | 1.39mi |
| 26454 S San Jacinto St Hemet, CA | 3.0 | 1.0 | 800 | $1,795 | $2.24 | 3d | 1 | 1.41mi |
| 26452 S San Jacinto St Hemet, CA | 3.0 | 1.0 | 800 | $1,795 | $2.24 | 3d | 1 | 1.41mi |
HOA detail
- Monthly dues
- $31 · $372/yr
- Likely covers
- poolsecurity
Listing history 7 events
-
2026-06-18statusdays on market $170,000 Active 1 DOM
-
2026-06-18days on market $170,000 Coming Soon 5 DOM
-
2026-06-17days on market $170,000 Coming Soon 4 DOM
-
2026-06-16days on market $170,000 Coming Soon 3 DOM
-
2026-06-15days on market $170,000 Coming Soon 2 DOM
-
2026-06-13remarks 699-char remark
-
2026-06-13$170,000 Coming Soon 1 DOM
ⓘ Source: listings_history table (triggers on properties + properties_extension) + one-shot
backfill from property_details.listing_events for pre-trigger history.
Tax reassessment forecast CA · Resets to sale price
- Current annual tax
- $1,943 · $162/mo
- Projected year-2 tax
- $1,943 · $162/mo
- Expected delta
- $0/yr ($0/mo · 0.0%)
ⓘ Screening estimate from a state-policy table — verify with the county assessor before closing.
Climate risk First Street
- Flood 1/10 Low FEMA zone X (shaded) · 0% chance over 30 yrs
- Wildfire 6/10 Major
- Heat 7/10 Severe 6 d/yr ≥104°F today · 18 d/yr by 30 yrs out
- Wind 1/10 Low
- Air quality 6/10 Major 9 unhealthy d/yr today · 11 by 30 yrs out
Nearby sold comps map
Loading sold comps map…
Walkable amenities ~0.75 mi
Loading nearby amenities…
Taxation est. · year 1
- Rental income
- $22,635
- − Mortgage interest
- −$9,523
- − Property taxes
- −$1,943
- − Insurance
- −$850
- − Repairs & maintenance
- −$1,811
- − Management
- −$1,811
- − HOA
- −$372
- − Depreciation
- −$4,945
- Taxable income
- $1,380
- Est. tax owed @ 24.0%
- −$331
- After-tax cash flow
- $3,687/yr
For passive investors: Depreciation is non-cash, so a rental often shows a tax loss while cash-flowing — sheltering income. Rental losses are passive: they offset passive income freely, and up to $25,000/yr can offset ordinary (W-2) income if you actively participate and your MAGI is under $100k (phasing out to $0 by $150k); unused losses carry forward. On sale, claimed depreciation is recaptured at up to 25%, and gains may owe capital-gains tax (a 1031 exchange can defer both). Figures are a year-1 estimate at your 24.0% rate — not tax advice; consult a CPA.
Schools (NCES district)
- District
- Hemet Unified
- NCES district ID
- 0616920
- Math proficiency
- 19% ▼ -3.00%
- Reading proficiency
- 41% ▲ 4.00%
- Median HH income
- $39,962
- Composite
- 25.16/100
- National rank
- #7517
- State rank
- #360 of 517 in CA
Livability — Hemet
- Score
- 51/100
- State rank
- #1056
- US rank
- #25208
Category grades
Schools grade is shown separately in the Schools card above.
Census & demographics
- Census place
- Hemet, CA
- County
- Riverside County · 2,287,001 people
- City population
- 137,670
- Metro
- Riverside-San Bernardino-Ontario, CA
- Population (ZIP)
- 39,937
- Household income
- $49,396
- Rent vs Own
- Severe rent burden
- 2144.0
Population outlook (Riverside County) Hauer SSP2
- Today (2025)
- 2,664,475 people
- By 2030
- 2,802,692 · +5.2%
- By 2040
- 3,050,904 · +14.5%
- By 2050
- 3,256,783 · +22.2%
- By 2075
- 3,655,058 · +37.2%
- By 2100
- 3,766,594 · +41.4%
Race, ethnicity, and origin ACS 2023
- Neighborhood character
- Diverse neighborhood (Simpson 0.61)
- Race & ethnicity
- Hispanic / Latino 54% White 30% Two or more races 18% Black 10% Native American 2% Asian 2%
- Hispanic origin (detail)
- Mexican 48% Puerto Rican 1%
- Common ancestry
- Slovak 1% Romanian 1% Portuguese 1%
- Foreign-born
- 21% · Canada
- Languages at home
- 59% English-only · Spanish 38% Arabic 1% Tagalog/Filipino 1%
Political lean MEDSL · Riverside
- 2024 margin
- Toss-up / Even · D 48.0% · R 49.3% · Other 2.6%
- 2008→2024 swing
- -3.6pp toward R · 2008: 2.3pp · 2024: -1.3pp
- All cycles
- 2024: R+1.3 2020: D+8.0 2016: D+4.3 2012: R+0.4 2008: D+2.3
Not yet ingested
- Civics
- —
Market trends
- HPI YoY
- ▼ -147.46%
- Current HPI
- 405.1277
- Rent YoY
- ▲ 1.76%
- Metro
- Riverside-San Bernardino-Ontario, CA
- State GDP YoY
- ▲ 3.21%
- F500 in state
- 116
Industry mix (Fortune 500 HQ in CA)
| Industry | F500 HQs | Revenue |
|---|---|---|
| Technology | 27 | $1,492B |
|
||
| Financial Services | 3 | $174B |
|
||
| Retail | 3 | $44B |
|
||
| Insurance | 3 | $26B |
|
||
| Media / Entertainment | 2 | $115B |
|
||
| Pharmaceuticals / Biotech | 2 | $62B |
|
||
Price history
+655.6% since first listed12 events — show timeline
- 2026-06-13 Coming Soon $170,000 CRMLS
- 2022-02-01 Sold (Public Records) $77,500 Public Records
- 2022-02-01 Sold (MLS) $155,000 CRMLS
- 2022-01-13 Pending — CRMLS
- 2022-01-05 Listed $134,900 CRMLS
- 2019-10-28 Sold (MLS) $78,200 CRMLS
- 2019-10-07 Pending — CRMLS
- 2019-10-04 Price Changed $84,500 CRMLS
- 2019-09-24 Relisted — CRMLS
- 2019-09-09 Pending — CRMLS
- 2019-09-03 Listed $99,000 CRMLS
- 2013-12-16 Sold (Public Records) $22,500 Public Records
Property tax history
+9.2%/yrLatest (2025): $1,943 · +2.0% YoY. Source: county tax records.
Cash-flow waterfall
monthlySold comps — $/sqft
last 12 mo · ≤1 miLoading sold comps…