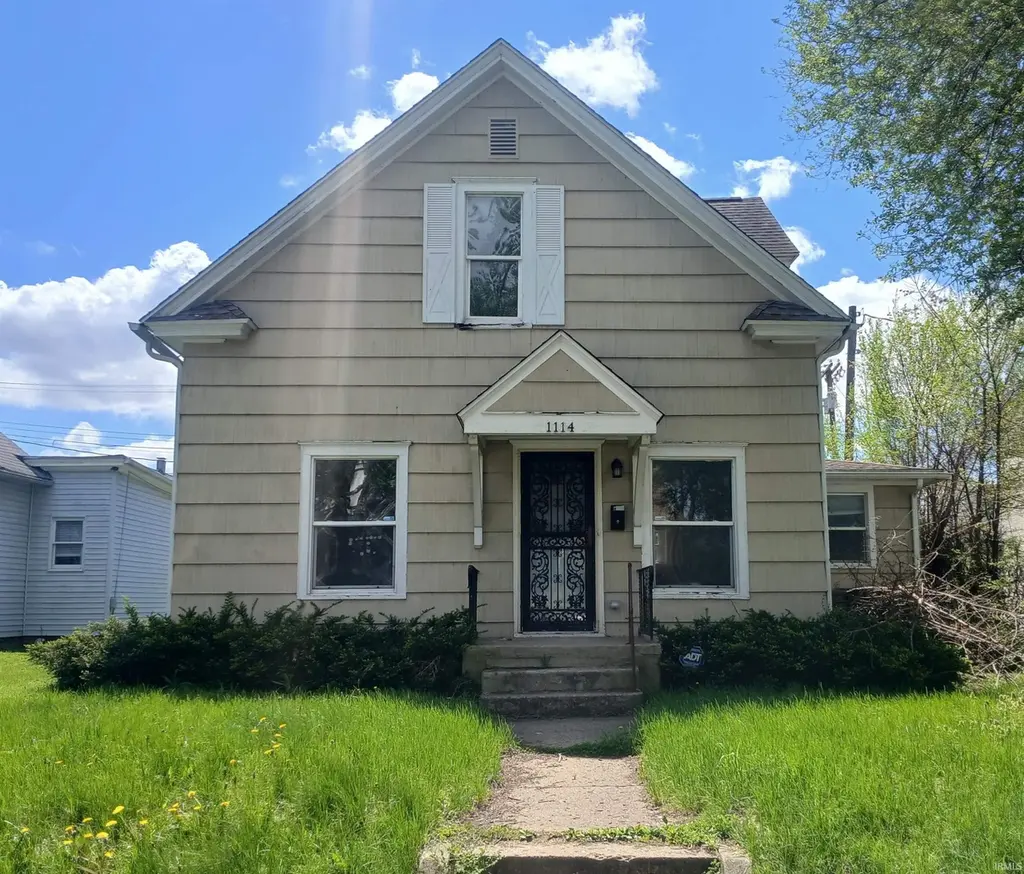
1114 E Bowman St · South Bend, IN
Flood risk 1/10 · Minimal
- FEMA flood zone
- X (unshaded)
- Chance of flooding over 30 yrs
- 0.0%
- Est. flood insurance / yr
- $473 – $860
Fire risk 1/10 · Minimal
- Est. fire insurance / yr
- $717 – $1,331
Heat risk 3/10 · Minor
- Hot days now (above 99°F)
- 7 days/yr
- Hot days in 30 yrs
- 16 days/yr
Wind risk 2/10 · Minimal
- Chance of severe wind over 30 yrs
- —
Air-quality risk 3/10 · Minor
- Unhealthy air days now
- 2 days/yr
- Unhealthy air days in 30 yrs
- 3 days/yr
Risk factors via First Street. Map © Google.
Why this score? — see what drove the B+ grade
The composite is a weighted blend of 9 inputs, each scored 0–100. Each bar is that input's sub-score; the figure is the points it added to the 100-point composite (weight × sub-score).
- Cash flow +30.0/30.0
- ARV discount +15.0/15.0
- 1% rule +10.0/10.0
- DSCR +10.0/10.0
- Rent growth +3.5/5.0
- Livability +3.2/5.0
- Condition / age +2.5/5.0
- Schools +1.4/10.0
- Appreciation +0.0/10.0
$99,000
🖨 Deal sheet 📄 Offer letter ✓ Due diligence
Listing remarks
Welcome home to this charming residence full of character! With 4 bedrooms and 2 bathrooms you have plenty of room to stretch your legs! This place boasts of a brand-new furnace, and a 2-year-old hot water heater. The roof is also in great shape and there are many new updates throughout! All appliances are included. There is a large 2 car detached garage with electric and an attached storage shed. With tons of storage, you don't want to miss out on this one.
Key facts
- Tons of storage
- Great shape roof
- Brand new furnace
Tags
Property features AI
Finance
- Other: Taxes listed (amount withheld from details)
Exterior
- Parking: Detached 2-car garage
- Utilities: Public water; Public sewer
- Home design: Single-family site-built home; 2 stories
- Construction: Built with other/unspecified construction materials
- Exterior features: Lot dimensions approximately 40' x 120'; Lot listed as other features
Interior
- Bedrooms: Bedrooms located on varied levels
- Bathrooms: 1 full bathroom; 1 half bathroom; One main-level bathroom
- Heating & cooling: Natural gas heating; Window cooling unit(s)
- Interior features: Full basement; Total of 10 rooms
- Laundry & utility: Laundry in lower level
Neighborhood map
What this means for you Summary
Snapshot
- This is a 4-bed/1.5-bath single-family listed at $99k.
Deal economics
- At list price, monthly cash flow is $2k ($20k/yr) — positive.
- The deal already cash-flows at list — no discount required.
- Meets the 1% rule at list price ($3k rent vs $99k).
- Recommended offer: $96k (3.0% below list) — sets the bar for market timing.
- Cap rate 26.3% vs local median 4.4% in South Bend — top-decile yield for the area; either an underpriced asset or a hidden risk that comps aren't pricing in. Stress-test before assuming the spread holds.
Location & tenants
- Location reads 64/100 on livability (#365 in IN) — a middle-class / working-renter tenant base. Strengths: cost of living A+, housing A+, health & safety A+; Watch: amenities D, employment D, crime F.
- South Bend Community School Corporation (urban): math 12% / reading 21% proficiency, ranked #284 of 301 in IN (top 94%) — low school quality limits family demand, transient renter base, plan for 1-2y turnover; 66% free/reduced lunch — lower-income household profile, screen leases tightly.
- Zoned schools: Lincoln Elementary School (math 7% / reading 6%, grade F, #964 of 994 statewide, top 97%, 467 students, 86% FRL); Riley High School (math 19% / reading 46%, grade F, #293 of 369 statewide, top 80%, 992 students, 67% FRL).
- Market conditions: Rents rising fast (+4.1%/yr); 77 active listings in the ZIP; 2 comparable units currently listed for rent nearby; lower-income renter base — watch delinquency; 754 units permitted in St. Joseph County in 2024 (460 in 5+ unit buildings).
- At $2,994/mo this rent would consume 84% of the median local household income ($43k/yr) (locally 545% of renters already pay >50% of income on rent) — very limited rent-growth headroom before tenants either downsize or default.
Forward outlook
- Local home prices are declining (-3.0%/yr); year-one equity from $684 of loan paydown is wiped out by about $3k of value loss. Plan a longer hold.
- At projected returns (-3.0% appreciation + 4.1% rent growth), your $28k cash investment doubles in ~2 years — after that, you're playing with house money.
Negotiation context
- It's been on market 45 days — a 3% lower offer ($96k) is reasonable based on typical stale-listing flexibility.
- 5 sale attempts since 11y ago; this cycle's ask has dropped $26k (21%) from the opening price — seller is motivated, your offer sets the floor, not the list.
- Current owner paid $60k; list at $99k implies a 65% gain — meaningful room to come down on a strong offer.
Risks & watch-outs
- Watch-outs: built in 1900 — expect roof / HVAC / electrical / plumbing capex.
Questions for the listing agent
- It's been on market 45 days. Have you received any prior offers? Is the seller open to a 3% concession, seller financing, or rate buy-down credit?
- Built in 1900 — when were the roof, HVAC, electrical panel, plumbing, and water heater last replaced?
- Is there a deadline driving the sale (1031 exchange, divorce, estate, relocation)? That informs how much negotiation room exists.
- Schools are F-rated, which usually means shorter tenancies and higher turnover. Who's the typical renter profile here, and what's been the actual vacancy rate?
- Crime grade is F in this area — have there been break-ins, vandalism, or insurance claims at this property in the last 3 years? What carrier currently insures it and at what premium?
- What's the average days-on-market for RENTAL listings here right now (not sales)? A rising rental-DOM trend means longer vacancies and softer asking-rent achievability than the comps imply.
- What's the recent tenant-quality profile in this submarket — average credit score on applications, eviction rate, late-payment / NSF rate, and stable-employment percentage? A property-management company in the area should have these aggregated.
- How much new for-sale + rental construction is in the pipeline within 1–3 miles? Heavy new supply typically softens prices + rents 12–24 months out; constrained supply supports both.
Investment metrics
- 1% rule
- 3.02% ✓
- Cap rate
- 26.28%
- Cash-on-cash
- 71.38%
- DSCR
- 4.18
- GRM
- 2.8
CMA / ARV
- ARV (median comp)
- $160,087
- List price
- $99,000
- Delta
- -38.16%
- Verdict
- UNDERPRICED
- Comps
- 20 within 1.0 mi
Show comp detail 12 sales within ~0.75 mi
| Address | Dist | Beds/Ba | Sqft | Sold | Price | $/sf | Match |
|---|---|---|---|---|---|---|---|
| 1123 E Eckman St | 0.47mi | 4/1.5 | 2,365 (-3%) | 6mo | $370,000 | $156 | 68 |
| 2510 Miami St | 0.32mi | 3/1.5 (-1) | 2,210 (-9%) | 4mo | $255,000 | $115 | 61 |
| 1164 Lincoln Way | 0.54mi | 4/2.5 | 2,328 (-4%) | 5mo | $160,000 | $69 | 60 |
| 546 Altgeld St | 0.50mi | 4/3.0 | 2,448 (+1%) | 13mo | $250,000 | $102 | 59 |
| 1328 E Dubail Ave | 0.38mi | 4/2.0 | 2,243 (-8%) | 15mo | $162,000 | $72 | 55 |
| 761 Roland Ct | 0.68mi | 3/2.5 (-1) | 2,476 (+2%) | 5mo | $299,000 | $121 | 52 |
| 2814 Miami St | 0.57mi | 4/3.0 | 2,568 (+6%) | 9mo | $325,000 | $127 | 50 |
| 1640 E Bowman St | 0.60mi | 3/2.0 (-1) | 2,216 (-9%) | 2mo | $189,900 | $86 | 49 |
| 1202 E Victoria St | 0.34mi | 3/1.5 (-1) | 2,116 (-13%) | 13mo | $226,000 | $107 | 46 |
| 1321 E Victoria St | 0.38mi | 3/1.5 (-1) | 2,069 (-15%) | 8mo | $217,000 | $105 | 46 |
| 506 E Fairview Ave | 0.64mi | 3/1.5 (-1) | 2,164 (-11%) | 1mo | $195,500 | $90 | 46 |
| 214 E Donald St | 0.67mi | 5/3.0 (+1) | 2,099 (-14%) | 13mo | $175,000 | $83 | 24 |
Match score weights: distance 35% · size 25% · config 20% · recency 20%. Top-matched comps best support the ARV.
Projected returns pro-forma
-3.0% appreciation · 4.08% rent growth · sell at horizon
- IRR
- 72.3%
- Equity multiple
- 4.33×
- Total profit
- $92,335
- Equity at exit
- $14,761
- IRR
- 76.5%
- Equity multiple
- 9.29×
- Total profit
- $229,697
- Equity at exit
- $8,560
Cash invested: $27,720 (down + closing). Projections, not guarantees.
Landlord ↔ Tenant lean methodology
- Overall (STATE)
- 90 Strongly Landlord-Friendly
- State Indiana
- 90 Strongly Landlord-Friendly · R+11
- County
- — inherits STATE
- City
- — inherits STATE
ZIP-level market 46613
- Home prices YoY
- -7.2%
- Rents YoY
- 4.1%
- Active inventory
- 77
- Price-to-rent
- 2.8×
Monthly cashflow live
- Estimated rent
- $2,994 medium interval (Pro) →
- Mortgage (P&I)
- −$519
- Tax from tax record
- −$156 /mo · $1,874/yr
- Insurance
- −$41
- HOA
- −$0
- Vacancy / Maint / Mgmt
- −$629
- Net cashflow
- $1,649
Break-even live
UW: 25.0% down · 7.5% · 30yr · 1.5% tax · 5.0% vac · 8.0% maint · 8.0% mgmt
Financing live
Cash to close
- Down payment
- $24,750
- Closing costs
- $2,970
- Reserves months
- —
- Total cash needed
- —
Loan-product check · same deal, 3 products live
Conventional
25% down · 7.5% · 30yr
- Down + closing
- —
- Monthly P&I
- —
- Monthly cashflow
- —
- DSCR
- —
- Eligible?
- —
Personal DTI + credit; lowest rate.
DSCR
20% down · 8.5% · 30yr
- Down + closing
- —
- Monthly P&I
- —
- Monthly cashflow
- —
- DSCR
- —
- Eligible?
- —
No personal income docs; deal must DSCR.
Hard money
10% down · 12.0% · 12mo
- Down + closing
- —
- Monthly P&I
- —
- Monthly cashflow
- —
- DSCR
- —
- Eligible?
- —
Short-term bridge; refi at stabilization.
Rent comps 2 comps
| Address | Beds | Baths | Sqft | Rent | $/sqft | DOM | Units | Dist |
|---|---|---|---|---|---|---|---|---|
| 114 Altgeld St South Bend, IN | 3.0 | 2.0 | 1680 | $1,399 | $0.83 | 43d | 1 | 0.83mi |
| 3406 Whitcomb Ave South Bend, IN | 4.0 | 3.0 | 1665 | $7,887 | $4.74 | 43d | 1 | 1.20mi |
Listing history 14 events
-
2026-06-18days on market $99,000 Active 45 DOM
-
2026-06-18status $99,000 Active 44 DOM
-
2026-06-07statusdays on market $99,000 Pending 44 DOM
-
2026-06-03pricedays on market $99,000 Active 41 DOM
-
2026-06-02days on market $105,000 Active 40 DOM
-
2026-06-01days on market $105,000 Active 39 DOM
-
2026-05-31days on market $105,000 Active 38 DOM
-
2026-05-30days on market $105,000 Active 37 DOM
-
2026-05-06price $115,000 462-char remark
-
2026-04-23$125,000 Active 462-char remark
-
2020-06-30soldstatus $59,900
-
2020-03-05$55,900
-
2016-03-21$59,000
-
2015-09-09$69,500
ⓘ Source: listings_history table (triggers on properties + properties_extension) + one-shot
backfill from property_details.listing_events for pre-trigger history.
Tax reassessment forecast IN · Partial reset (capped growth)
- Current annual tax
- $1,874 · $156/mo
- Projected year-2 tax
- $1,874 · $156/mo
- Expected delta
- $0/yr ($0/mo · 0.0%)
ⓘ Screening estimate from a state-policy table — verify with the county assessor before closing.
Climate risk First Street
- Flood 1/10 Low FEMA zone X (unshaded) · 0% chance over 30 yrs
- Wildfire 1/10 Low
- Heat 3/10 Moderate 7 d/yr ≥99°F today · 16 d/yr by 30 yrs out
- Wind 2/10 Low
- Air quality 3/10 Moderate 2 unhealthy d/yr today · 3 by 30 yrs out
Nearby sold comps map
Loading sold comps map…
Walkable amenities ~0.75 mi
Loading nearby amenities…
Taxation est. · year 1
- Rental income
- $35,933
- − Mortgage interest
- −$5,546
- − Property taxes
- −$1,874
- − Insurance
- −$495
- − Repairs & maintenance
- −$2,875
- − Management
- −$2,875
- − Depreciation
- −$2,880
- Taxable income
- $19,389
- Est. tax owed @ 24.0%
- −$4,653
- After-tax cash flow
- $15,134/yr
For passive investors: Depreciation is non-cash, so a rental often shows a tax loss while cash-flowing — sheltering income. Rental losses are passive: they offset passive income freely, and up to $25,000/yr can offset ordinary (W-2) income if you actively participate and your MAGI is under $100k (phasing out to $0 by $150k); unused losses carry forward. On sale, claimed depreciation is recaptured at up to 25%, and gains may owe capital-gains tax (a 1031 exchange can defer both). Figures are a year-1 estimate at your 24.0% rate — not tax advice; consult a CPA.
Schools (NCES district)
- District
- South Bend Community School Corporation
- NCES district ID
- 1810290
- Math proficiency
- 12% ▼ -10.00%
- Reading proficiency
- 21% ▼ -6.00%
- Median HH income
- $41,935
- Composite
- 14.21/100
- National rank
- #9452
- State rank
- #284 of 301 in IN
Livability — South Bend
- Score
- 64/100
- State rank
- #365
- US rank
- #13730
Category grades
Schools grade is shown separately in the Schools card above.
Census & demographics
- Census place
- South Bend, IN
- County
- Saint Joseph County · 189,048 people
- City population
- 99,767
- Metro
- South Bend-Mishawaka, IN-MI
- Population (ZIP)
- 12,279
- Household income
- $42,537
- Rent vs Own
- Severe rent burden
- 545.0
Population outlook (St. Joseph County) Hauer SSP2
- Today (2025)
- 273,186 people
- By 2030
- 273,594 · +0.1%
- By 2040
- 271,641 · -0.6%
- By 2050
- 269,187 · -1.5%
- By 2075
- 263,136 · -3.7%
- By 2100
- 245,659 · -10.1%
Race, ethnicity, and origin ACS 2023
- Neighborhood character
- Highly diverse neighborhood (Simpson 0.72)
- Race & ethnicity
- White 41% Hispanic / Latino 24% Black 23% Two or more races 22% Asian 2% Native American 1%
- Hispanic origin (detail)
- Mexican 22%
- Common ancestry
- Romanian 4% Italian 1% Slovak 1%
- Foreign-born
- 9% · Canada, Philippines
- Languages at home
- 81% English-only · Spanish 17% Other Asian/Pacific 1%
Political lean MEDSL · St. Joseph
- 2024 margin
- Toss-up / Even · D 50.0% · R 48.5% · Other 1.5%
- 2008→2024 swing
- -15.6pp toward R · 2008: 17.1pp · 2024: 1.5pp
- All cycles
- 2024: D+1.5 2020: D+5.8 2016: D+0.2 2012: D+3.5 2008: D+17.1
Not yet ingested
- Civics
- —
Market trends
- HPI YoY
- ▼ -20.88%
- Current HPI
- 270.0303
- Rent YoY
- ▲ 4.08%
- Metro
- South Bend-Mishawaka, IN-MI
- State GDP YoY
- ▲ 2.90%
- F500 in state
- 18
Industry mix (Fortune 500 HQ in IN)
| Industry | F500 HQs | Revenue |
|---|---|---|
| Industrial Machinery | 2 | $37B |
|
||
| Healthcare | 1 | $177B |
|
||
| Pharmaceuticals | 1 | $45B |
|
||
| Metals / Steel | 1 | $18B |
|
||
| Agriculture | 1 | $17B |
|
||
| Packaging | 1 | $12B |
|
||
Price history
+42.4% since first listed10 events — show timeline
- 2026-06-17 Relisted — IRMLS
- 2026-06-06 Pending — IRMLS
- 2026-06-03 Price Changed $99,000 IRMLS
- 2026-05-23 Price Changed $105,000 IRMLS
- 2026-05-06 Price Changed $115,000 IRMLS
- 2026-04-23 Listed $125,000 IRMLS
- 2020-06-30 Sold (MLS) $59,900 IRMLS
- 2020-03-05 Listed $55,900 IRMLS
- 2016-03-21 Listed $59,000 IRMLS
- 2015-09-09 Listed $69,500 IRMLS
Property tax history
+8.6%/yrLatest (2025): $1,874 · +16.3% YoY. Source: county tax records.
Cash-flow waterfall
monthlySold comps — $/sqft
last 12 mo · ≤1 miLoading sold comps…