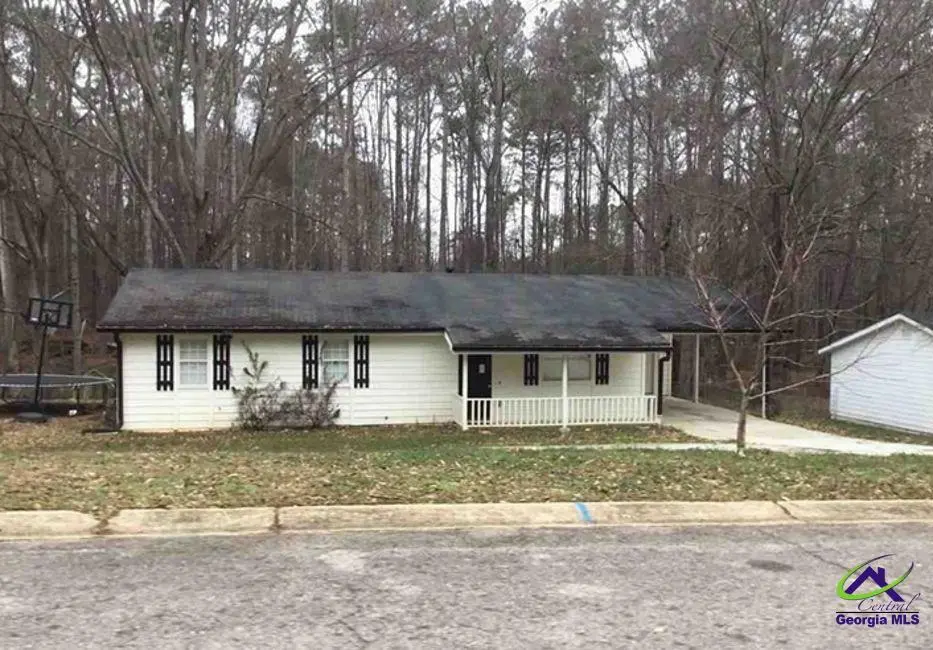
314 SE Morris Dr · Conyers, GA
Flood risk 7/10 · Major
- FEMA flood zone
- X (unshaded)
- Chance of flooding over 30 yrs
- 0.99%
- Est. flood insurance / yr
- $507 – $1,088
Fire risk 1/10 · Minimal
- Est. fire insurance / yr
- $963 – $1,789
Heat risk 6/10 · Moderate
- Hot days now (above 105°F)
- 7 days/yr
- Hot days in 30 yrs
- 18 days/yr
Wind risk 6/10 · Moderate
- Chance of severe wind over 30 yrs
- 27.0%
Air-quality risk 4/10 · Minor
- Unhealthy air days now
- 5 days/yr
- Unhealthy air days in 30 yrs
- 7 days/yr
Risk factors via First Street. Map © Google.
Why this score? — see what drove the B grade
The composite is a weighted blend of 9 inputs, each scored 0–100. Each bar is that input's sub-score; the figure is the points it added to the 100-point composite (weight × sub-score).
- Cash flow +27.3/30.0
- ARV discount +15.0/15.0
- DSCR +9.5/10.0
- 1% rule +8.4/10.0
- Rent growth +3.5/5.0
- Livability +3.4/5.0
- Condition / age +2.5/5.0
- Schools +1.9/10.0
- Appreciation +0.0/10.0
$136,400
🖨 Deal sheet 📄 Offer letter ✓ Due diligence
Listing remarks MLS
Offers to be placed on Xome.com. Interior inspections are not available, do not trespass! Forward all inquiries and questions to Xome Customer Service. NO REPRESENTATION TO VALIDITY OF INFORMATION IS MADE, BUYER TO VERIFY ALL INFORMATION WHERIN.
Key facts
- 0.27 acre lot
- Garage
- Built 1985
Neighborhood map
What this means for you Summary
Snapshot
- This is a 3-bed/2.0-bath single-family listed at $136k.
Deal economics
- At list price, monthly cash flow is $329 ($4k/yr) — positive.
- The deal already cash-flows at list — no discount required.
- Meets the 1% rule at list price ($2k rent vs $136k).
- Recommended offer: $128k (6.0% below list) — sets the bar for market timing.
- Cap rate 9.8% vs local median 4.4% in Conyers — top-decile yield for the area; either an underpriced asset or a hidden risk that comps aren't pricing in. Stress-test before assuming the spread holds.
Location & tenants
- Location reads 67/100 on livability (#167 in GA) — a middle-class / working-renter tenant base. Strengths: cost of living A+, housing A+; Watch: schools D+, crime D, amenities D.
- Rockdale County (suburban): math 14% / reading 29% proficiency, ranked #136 of 174 in GA (top 78%) — low school quality limits family demand, transient renter base, plan for 1-2y turnover.
- Market conditions: Rents rising fast (+4.2%/yr); 386 active listings in the ZIP; 15 comparable units currently listed for rent nearby; rentals leasing fast (median 13d on market — plan ~1-2 weeks tenant-placement turnaround); solid renter incomes; 483 units permitted in Rockdale County in 2024 (0 in 5+ unit buildings).
Forward outlook
- Local home prices are declining (-3.0%/yr); year-one equity from $943 of loan paydown is wiped out by about $4k of value loss. Plan a longer hold.
- Rockdale County population projected at +29% by 2050 — long-run rental-demand tailwind backs the buy-and-hold thesis.
- At projected returns (-3.0% appreciation + 4.2% rent growth), your $38k cash investment doubles in ~9 years — after that, you're playing with house money.
Negotiation context
- It's been on market 61 days — a 6% lower offer ($128k) is reasonable based on typical stale-listing flexibility.
- 8 sale attempts since 4y ago with the ask held roughly flat each time — persistent listings suggest the price (not the market) is what's stuck; bring a comps-based counter.
Risks & watch-outs
- Watch-outs: flood insurance adds $66/mo.
- Climate carrying-cost: major flood risk; major wind risk, 27% chance of damaging wind over 30y; extreme-heat days projected 7→18/yr by 2055 (HVAC capex compounding) — expect insurance premiums to compound above CPI over the hold.
Questions for the listing agent
- It's been on market 61 days. Have you received any prior offers? Is the seller open to a 6% concession, seller financing, or rate buy-down credit?
- What's the actual annual flood-insurance premium (NFIP or private), and is the property in a SFHA with mandatory coverage?
- Why hasn't it sold? Are there any deal-killer items the seller is aware of (foundation, flood, title, zoning, code violations)?
- Is there a deadline driving the sale (1031 exchange, divorce, estate, relocation)? That informs how much negotiation room exists.
- Schools are D-rated, which usually means shorter tenancies and higher turnover. Who's the typical renter profile here, and what's been the actual vacancy rate?
- Crime grade is D in this area — have there been break-ins, vandalism, or insurance claims at this property in the last 3 years? What carrier currently insures it and at what premium?
- What's the average days-on-market for RENTAL listings here right now (not sales)? A rising rental-DOM trend means longer vacancies and softer asking-rent achievability than the comps imply.
- What's the recent tenant-quality profile in this submarket — average credit score on applications, eviction rate, late-payment / NSF rate, and stable-employment percentage? A property-management company in the area should have these aggregated.
- How much new for-sale + rental construction is in the pipeline within 1–3 miles? Heavy new supply typically softens prices + rents 12–24 months out; constrained supply supports both.
Investment metrics
- 1% rule
- 1.34% ✓
- Cap rate
- 9.78%
- Cash-on-cash
- 12.44%
- DSCR
- 1.55
- GRM
- 6.2
CMA / ARV
- ARV (median comp)
- $242,518
- List price
- $136,400
- Delta
- -43.76%
- Verdict
- UNDERPRICED
- Comps
- 20 within 1.0 mi
Show comp detail 12 sales within ~0.75 mi
| Address | Dist | Beds/Ba | Sqft | Sold | Price | $/sf | Match |
|---|---|---|---|---|---|---|---|
| 2631 Rolling Hills Way | 0.44mi | 3/2.0 | 1,178 (+2%) | 1mo | $205,000 | $174 | 75 |
| 1627 Cherry Hill Ct SW | 0.40mi | 3/2.0 | 1,195 (+4%) | 4mo | $215,000 | $180 | 72 |
| 340 Windsor Walk | 0.31mi | 3/2.0 | 1,244 (+8%) | 2mo | $220,000 | $177 | 71 |
| 1598 Cherry Hill Ln SW | 0.44mi | 3/2.0 | 1,118 (-3%) | 4mo | $190,000 | $170 | 71 |
| 1651 Rolling Hills Trl SE | 0.41mi | 3/2.0 | 1,219 (+6%) | 1mo | $121,600 | $100 | 70 |
| 1530 Pin Oak Ln SE | 0.42mi | 3/2.0 | 1,205 (+4%) | 5mo | $165,500 | $137 | 69 |
| 1590 SW Cherry Hill Ln | 0.43mi | 3/2.0 | 1,113 (-4%) | 12mo | $237,000 | $213 | 64 |
| 170 Old Mill Trl SW | 0.42mi | 3/2.0 | 1,260 (+9%) | 3mo | $226,400 | $180 | 62 |
| 1655 Cherry Hill Rd SW | 0.43mi | 3/2.0 | 1,234 (+7%) | 8mo | $218,000 | $177 | 62 |
| 1624 Sugarmaple Ln SW | 0.42mi | 3/2.0 | 1,052 (-9%) | 8mo | $185,000 | $176 | 59 |
| 1461 Cherry Hill Rd SW | 0.66mi | 3/2.0 | 1,245 (+8%) | 6mo | $215,000 | $173 | 51 |
| 1700 Mccollum Rd SW | 0.59mi | 3/1.0 | 1,000 (-13%) | 12mo | $200,000 | $200 | 36 |
Match score weights: distance 35% · size 25% · config 20% · recency 20%. Top-matched comps best support the ARV.
Projected returns pro-forma
-3.0% appreciation · 4.16% rent growth · sell at horizon
- IRR
- 0.8%
- Equity multiple
- 1.03×
- Total profit
- $1,180
- Equity at exit
- $20,338
- IRR
- 11.8%
- Equity multiple
- 1.99×
- Total profit
- $37,681
- Equity at exit
- $11,793
Cash invested: $38,192 (down + closing). Projections, not guarantees.
Landlord ↔ Tenant lean methodology
- Overall (STATE)
- 90 Strongly Landlord-Friendly
- State Georgia
- 90 Strongly Landlord-Friendly · R+3
- County
- — inherits STATE
- City
- — inherits STATE
ZIP-level market 30094
- Rents YoY
- 4.2%
- Active inventory
- 386
- Price-to-rent
- 6.2×
Monthly cashflow live
- Estimated rent
- $1,831 high interval (Pro) →
- Mortgage (P&I)
- −$715
- Tax from tax record
- −$279 /mo · $3,343/yr
- Insurance
- −$57
- Flood insurance flood zone
- −$66 /mo · $798/yr
- HOA
- −$0
- Vacancy / Maint / Mgmt
- −$385
- Net cashflow
- $329
Break-even live
UW: 25.0% down · 7.5% · 30yr · 1.5% tax · 5.0% vac · 8.0% maint · 8.0% mgmt
Financing live
Cash to close
- Down payment
- $34,100
- Closing costs
- $4,092
- Reserves months
- —
- Total cash needed
- —
Loan-product check · same deal, 3 products live
Conventional
25% down · 7.5% · 30yr
- Down + closing
- —
- Monthly P&I
- —
- Monthly cashflow
- —
- DSCR
- —
- Eligible?
- —
Personal DTI + credit; lowest rate.
DSCR
20% down · 8.5% · 30yr
- Down + closing
- —
- Monthly P&I
- —
- Monthly cashflow
- —
- DSCR
- —
- Eligible?
- —
No personal income docs; deal must DSCR.
Hard money
10% down · 12.0% · 12mo
- Down + closing
- —
- Monthly P&I
- —
- Monthly cashflow
- —
- DSCR
- —
- Eligible?
- —
Short-term bridge; refi at stabilization.
Rent comps 15 comps
| Address | Beds | Baths | Sqft | Rent | $/sqft | DOM | Units | Dist |
|---|---|---|---|---|---|---|---|---|
| 288 Morris Dr SE Conyers, GA | 3.0 | 2.0 | 1251 | $1,731 | $1.38 | 12d | 1 | 0.07mi |
| 325 Morris Ct SE Conyers, GA | 3.0 | 2.0 | 1256 | $1,770 | $1.41 | 43d | 1 | 0.16mi |
| 359 Cindy Dr SE Conyers, GA | 3.0 | 1.0 | 1265 | $1,326 | $1.05 | 43d | 1 | 0.26mi |
| 1576 Cherry Hill Ct SW Conyers, GA | 3.0 | 2.0 | 1392 | $1,450 | $1.04 | 20d | 1 | 0.28mi |
| 337 Windsor Walk SE Conyers, GA | 3.0 | 2.0 | 1247 | $1,695 | $1.36 | 12d | 1 | 0.35mi |
| 411 Cindy Dr SE Conyers, GA | 3.0 | 2.0 | 1424 | $1,830 | $1.29 | 1d | 1 | 0.38mi |
| 2641 Rolling Hills Way SE Conyers, GA | 3.0 | 2.0 | 1452 | $1,791 | $1.23 | 12d | 1 | 0.48mi |
| 1616 Cherry Hill Rd SW Conyers, GA | 3.0 | 2.0 | 1250 | $1,639 | $1.31 | 2d | 1 | 0.54mi |
| 2511 Nugget Dr SW Conyers, GA | 3.0 | 2.0 | 1311 | $1,755 | $1.34 | 22d | 1 | 0.59mi |
| 1477 Cherry Hill Rd SW Conyers, GA | 3.0 | 2.0 | 1396 | $1,725 | $1.24 | 24d | 1 | 0.69mi |
| 1825 Parker Rd SE Conyers, GA | 1.0–3.0 | 1.0–2.0 | 1111 | $1,895 | $1.71 | 1d | 18 | 1.14mi |
| 2365 Highway 20 SE Conyers, GA | 1.0–2.0 | 1.0–2.0 | 984 | $1,730 | $1.76 | 1d | 7 | 1.20mi |
| 661 Greenview Ave SE Conyers, GA | 3.0 | 2.0 | 1393 | $1,700 | $1.22 | 24d | 1 | 1.30mi |
| 619 Lakeridge Cir SE Conyers, GA | 3.0 | 2.0 | 1350 | $1,545 | $1.14 | 20d | 1 | 1.43mi |
| 595 Lakeridge Cir SE Conyers, GA | 3.0 | 2.0 | 1304 | $1,656 | $1.27 | 5d | 1 | 1.49mi |
Listing history 38 events
-
2026-06-18days on market $136,400 Active 61 DOM
-
2026-06-17days on market $136,400 Active 60 DOM
-
2026-06-16days on market $136,400 Active 59 DOM
-
2026-06-15days on market $136,400 Active 58 DOM
-
2026-06-13days on market $136,400 Active 56 DOM
-
2026-06-09days on market $136,400 Active 52 DOM
-
2026-06-08days on market $136,400 Active 51 DOM
-
2026-06-07days on market $136,400 Active 50 DOM
-
2026-06-04days on market $136,400 Active 47 DOM
-
2026-06-03days on market $136,400 Active 46 DOM
-
2026-06-02days on market $136,400 Active 45 DOM
-
2026-06-01days on market $136,400 Active 44 DOM
-
2026-05-31days on market $136,400 Active 43 DOM
-
2026-04-17$136,400 Active 245-char remark
Show marketing remark (245 chars)
Offers to be placed on Xome.com. Interior inspections are not available, do not trespass! Forward all inquiries and questions to Xome Customer Service. NO REPRESENTATION TO VALIDITY OF INFORMATION IS MADE, BUYER TO VERIFY ALL INFORMATION WHERIN.
-
2024-10-31historical
-
2024-10-31historical
-
2024-09-19status Active
-
2024-09-11historical
-
2024-09-11historical
-
2024-08-19price $249,900
-
2024-08-19price $249,900
-
2024-07-25$259,900 Active
-
2024-07-25$249,900 New
-
2024-07-25$259,900 New
-
2023-06-23soldstatus $235,000
-
2023-06-22soldstatus $235,000 Closed
-
2023-06-06status Pending
-
2023-05-26status Active
-
2023-05-23status Pending
-
2023-05-09price $235,000
-
2023-05-09$325,000 Active
-
2022-11-04soldstatus $95,000
-
2022-10-21soldstatus $105,000 Closed
-
2022-07-28status Pending
-
2022-07-14$100,000 Active
-
2004-11-23soldstatus $69,865
-
1995-01-23soldstatus $35,000
-
1993-02-25soldstatus $59,900
ⓘ Source: listings_history table (triggers on properties + properties_extension) + one-shot
backfill from property_details.listing_events for pre-trigger history.
Tax reassessment forecast GA · Resets to sale price
- Current annual tax
- $3,343 · $279/mo
- Projected year-2 tax
- $3,343 · $279/mo
- Expected delta
- $0/yr ($0/mo · 0.0%)
ⓘ Screening estimate from a state-policy table — verify with the county assessor before closing.
Climate risk First Street
- Flood 7/10 Severe FEMA zone X (unshaded) · 99% chance over 30 yrs
- Wildfire 1/10 Low
- Heat 6/10 Major 7 d/yr ≥105°F today · 18 d/yr by 30 yrs out
- Wind 6/10 Major 27% chance of damaging wind over 30 yrs
- Air quality 4/10 Moderate 5 unhealthy d/yr today · 7 by 30 yrs out
Nearby sold comps map
Loading sold comps map…
Walkable amenities ~0.75 mi
Loading nearby amenities…
Taxation est. · year 1
- Rental income
- $21,974
- − Mortgage interest
- −$7,641
- − Property taxes
- −$3,343
- − Insurance
- −$1,480
- − Repairs & maintenance
- −$1,758
- − Management
- −$1,758
- − Depreciation
- −$3,968
- Taxable income
- $2,028
- Est. tax owed @ 24.0%
- −$487
- After-tax cash flow
- $3,467/yr
For passive investors: Depreciation is non-cash, so a rental often shows a tax loss while cash-flowing — sheltering income. Rental losses are passive: they offset passive income freely, and up to $25,000/yr can offset ordinary (W-2) income if you actively participate and your MAGI is under $100k (phasing out to $0 by $150k); unused losses carry forward. On sale, claimed depreciation is recaptured at up to 25%, and gains may owe capital-gains tax (a 1031 exchange can defer both). Figures are a year-1 estimate at your 24.0% rate — not tax advice; consult a CPA.
Schools (NCES district)
- District
- Rockdale County
- NCES district ID
- 1304410
- Math proficiency
- 14% ▼ -17.00%
- Reading proficiency
- 29% ▼ -11.00%
- Median HH income
- $53,325
- Composite
- 19.42/100
- National rank
- #8776
- State rank
- #136 of 174 in GA
Livability — Conyers
- Score
- 67/100
- State rank
- #167
- US rank
- #10533
Category grades
Schools grade is shown separately in the Schools card above.
Census & demographics
- County
- Rockdale County · 96,534 people
- City population
- 96,534
- Metro
- Atlanta-Sandy Springs-Alpharetta, GA
- Population (ZIP)
- 33,731
- Household income
- $88,530
- Rent vs Own
- Severe rent burden
- 549.0
Population outlook (Rockdale County) Hauer SSP2
- Today (2025)
- 99,145 people
- By 2030
- 104,558 · +5.5%
- By 2040
- 116,100 · +17.1%
- By 2050
- 127,827 · +28.9%
- By 2075
- 159,113 · +60.5%
- By 2100
- 181,178 · +82.7%
Race, ethnicity, and origin ACS 2023
- Neighborhood character
- Diverse neighborhood (Simpson 0.60)
- Race & ethnicity
- Black 56% White 29% Two or more races 9% Hispanic / Latino 7% Asian 1%
- Hispanic origin (detail)
- Mexican 4% Puerto Rican 1%
- Common ancestry
- Hispanic 1% Serbian 1% Slovak 1%
- Foreign-born
- 7% · Canada
- Languages at home
- 91% English-only · Spanish 5% French/Haitian/Cajun 1%
Political lean MEDSL · Rockdale
- 2024 margin
- Solid D (+47.5) · D 73.4% · R 25.9%
- 2008→2024 swing
- +37.9pp toward D · 2008: 9.6pp · 2024: 47.5pp
- All cycles
- 2024: D+47.5 2020: D+40.8 2016: D+25.9 2012: D+16.4 2008: D+9.6
Not yet ingested
- Civics
- —
Market trends
- HPI YoY
- ▼ -168.06%
- Current HPI
- 205.627
- Rent YoY
- ▲ 4.16%
- Metro
- Atlanta-Sandy Springs-Alpharetta, GA
- State GDP YoY
- ▲ 2.66%
- F500 in state
- 28
Industry mix (Fortune 500 HQ in GA)
| Industry | F500 HQs | Revenue |
|---|---|---|
| Paper / Packaging | 2 | $29B |
|
||
| Retail | 1 | $160B |
|
||
| Transportation / Logistics | 1 | $91B |
|
||
| Airlines | 1 | $62B |
|
||
| Consumer Goods | 1 | $47B |
|
||
| Utilities | 1 | $25B |
|
||
Price history
+127.7% since first listed25 events — show timeline
- 2026-04-17 Listed $136,400 CGMLS
- 2024-10-31 Listing Removed — GAMLS
- 2024-10-31 Listing Removed — FMLS
- 2024-09-19 Relisted — FMLS
- 2024-09-11 Listing Removed — GAMLS
- 2024-09-11 Listing Removed — FMLS
- 2024-08-19 Price Changed $249,900 FMLS
- 2024-08-19 Price Changed $249,900 GAMLS
- 2024-07-25 Listed $259,900 GAMLS
- 2024-07-25 Listed $249,900 GAMLS
- 2024-07-25 Listed $259,900 FMLS
- 2023-06-23 Sold (Public Records) $235,000 Public Records
- 2023-06-22 Sold (MLS) $235,000 FMLS
- 2023-06-06 Pending — FMLS
- 2023-05-26 Relisted — FMLS
- 2023-05-23 Pending — FMLS
- 2023-05-09 Price Changed $235,000 FMLS
- 2023-05-09 Listed $325,000 FMLS
- 2022-11-04 Sold (Public Records) $95,000 Public Records
- 2022-10-21 Sold (MLS) $105,000 FMLS
- 2022-07-28 Pending — FMLS
- 2022-07-14 Listed $100,000 FMLS
- 2004-11-23 Sold (Public Records) $69,865 Public Records
- 1995-01-23 Sold (Public Records) $35,000 Public Records
- 1993-02-25 Sold (Public Records) $59,900 Public Records
Property tax history
+11.6%/yrLatest (2025): $3,343 · +5.4% YoY. Source: county tax records.
Cash-flow waterfall
monthlySold comps — $/sqft
last 12 mo · ≤1 miLoading sold comps…