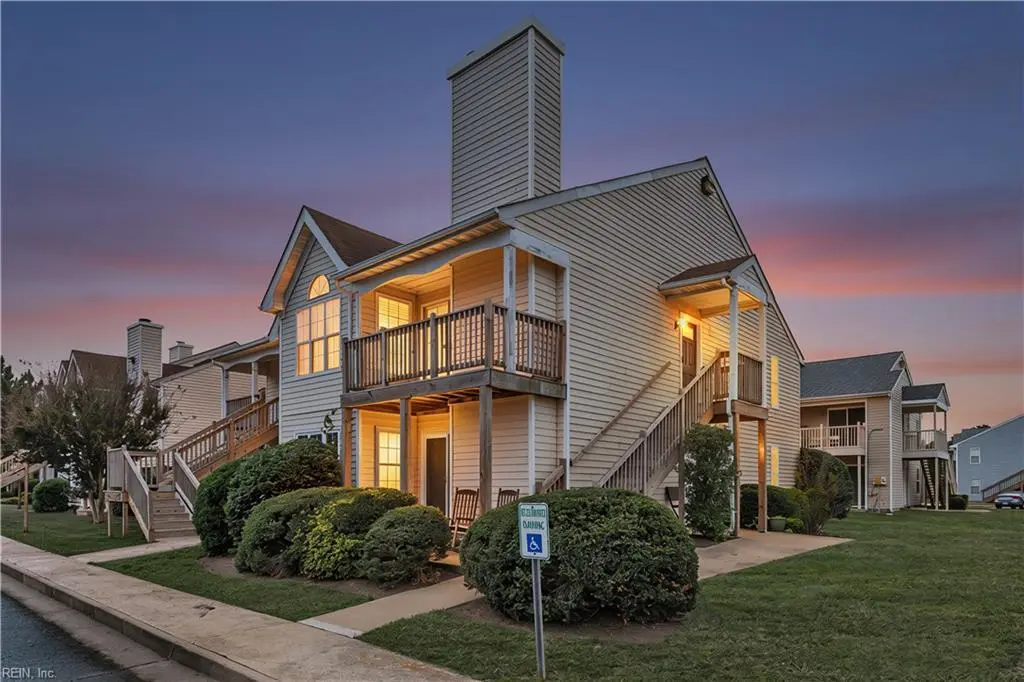
3423 Norfeld Ct · Virginia Beach, VA
Flood risk 1/10 · Minimal
- FEMA flood zone
- X (unshaded)
- Chance of flooding over 30 yrs
- 0.0%
- Est. flood insurance / yr
- $507 – $1,088
Fire risk 1/10 · Minimal
- Est. fire insurance / yr
- $666 – $1,236
Heat risk 9/10 · Severe
- Hot days now (above 104°F)
- 7 days/yr
- Hot days in 30 yrs
- 16 days/yr
Wind risk 8/10 · Major
- Chance of severe wind over 30 yrs
- 98.0%
Air-quality risk 3/10 · Minor
- Unhealthy air days now
- 2 days/yr
- Unhealthy air days in 30 yrs
- 4 days/yr
Risk factors via First Street. Map © Google.
Why this score? — see what drove the D grade
The composite is a weighted blend of 9 inputs, each scored 0–100. Each bar is that input's sub-score; the figure is the points it added to the 100-point composite (weight × sub-score).
- Cash flow +9.9/30.0
- ARV discount +7.5/15.0
- Schools +6.4/10.0
- Rent growth +4.9/5.0
- 1% rule +4.8/10.0
- Livability +4.2/5.0
- DSCR +2.8/10.0
- Condition / age +2.5/5.0
- Appreciation +0.0/10.0
$199,000
🖨 Deal sheet (PDF) 📄 Offer letter ✓ Due diligence
Listing remarks
Come see this charming 2-bedroom condo in Cameron Crossing and enjoy the ease of low-maintenance living! Conveniently located near area attractions, the ODU Virginia Beach campus, TCC, shopping, dining, and with easy access to major highways for commuting. Inside, you’ll find sleek LVP flooring throughout, creating a modern and cohesive feel. Whether you’re searching for your first home or looking to expand your investment portfolio, this condo offers a fantastic opportunity in a convenient location.
Key facts
- $393 HOA
- Parking
- Built 1986
Property features AI
Finance
- HOA & community: Has HOA; Condo association fee $350 monthly; POA fee $43 monthly; Association management company: Associate Community Group
Exterior
- Parking: Assigned/reserved parking space (1)
- Utilities: City/County water; City/County sewer; Electric water heater; Electric power available
- Home design: Attached condo; Lo-rise style; 2 stories; Unit on level 2 with 1 living level; Slab foundation
- Construction: Vinyl siding; Asphalt shingle roof
- Exterior features: Patio; Balcony; Attic
Interior
- Kitchen: Electric range; Dishwasher; Disposal; Refrigerator; Breakfast area
- Bedrooms: Master bedroom; Additional bedroom; No bedroom and full bathroom on first floor
- Flooring: Laminate
- Bathrooms: 2 full bathrooms
- Heating & cooling: Heat pump heating; Central air conditioning; Heat pump cooling
- Interior features: Cathedral ceiling; Skylights; Ceiling fan; Walk-in closet; One fireplace
- Laundry & utility: Washer and dryer; Washer hookup; Dryer hookup; Utility room
Neighborhood map
What this means for you Summary
Snapshot
- This is a 2-bed/2.0-bath condo listed at $199k.
Deal economics
- At list price, monthly cash flow is $-123 ($-1k/yr) — negative.
- To cash-flow at today's rent, offer at most $177k (10.9% below list).
- To meet the 1% rule (rent ≥ 1% of price), the offer needs to be $196k (1.5% below list).
- Recommended offer: $177k (10.9% below list) — sets the bar for cash-flow.
- Cap rate 5.6% vs local median 3.5% in Virginia Beach — top-decile yield for the area; either an underpriced asset or a hidden risk that comps aren't pricing in. Stress-test before assuming the spread holds.
Location & tenants
- Location reads 83/100 on livability (#38 in VA, #880 nationally) — a professional / high-income tenant draw. Strengths: amenities A+, employment A+, housing A+; Watch: cost of living C-, commute F.
- Va Beach City Public School District (urban): math 69% / reading 78% proficiency, ranked #10 of 131 in VA (top 8%) — strong family-tenant draw, lease renewals of 3-5y typical.
- Zoned schools: Landstown Elementary (math 69% / reading 79%, grade A, #248 of 1,108 statewide, top 23%, 676 students, 44% FRL); Landstown Middle (math 64% / reading 81%, grade A, #61 of 342 statewide, top 18%, 1,278 students, 41% FRL); Green Run High (math 64% / reading 69%, grade B, #195 of 319 statewide, top 62%, 1,517 students, 69% FRL) — zoned schools average 51% FRL vs 28% district-wide (23 pts higher); higher-poverty schools than district average — tighter screening recommended.
- Market conditions: Rents rising fast (+9.7%/yr); 104 active listings in the ZIP; 34 comparable units currently listed for rent nearby; rentals at typical pace (median 19d on market — plan ~3-4 weeks tenant-placement turnaround); solid renter incomes; 666 units permitted in Virginia Beach city in 2024 (347 in 5+ unit buildings).
Forward outlook
- Local home prices are declining (-3.0%/yr); year-one equity from $1k of loan paydown is wiped out by about $6k of value loss. Plan a longer hold.
- Virginia Beach County population projected at +6% by 2050 — modest demand growth; plan on rents tracking national, not racing it.
Negotiation context
- It's been on market 21 days — a 2% lower offer ($196k) is reasonable based on typical stale-listing flexibility.
- Current owner paid $75k; list at $199k implies a 165% gain — meaningful room to come down on a strong offer.
Risks & watch-outs
- Watch-outs: HOA is 20% of rent.
- Climate carrying-cost: severe wind risk, 98% chance of damaging wind over 30y; extreme-heat days projected 7→16/yr by 2055 (HVAC capex compounding) — expect insurance premiums to compound above CPI over the hold.
Questions for the listing agent
- What do current leases actually rent for vs. the listed asking? Can we see a recent rent roll and the last 12 months of T-12 income?
- What does the HOA fee cover, when was the last increase, and are there any pending special assessments or reserve-fund shortfalls?
- Any open or pending special assessments — roof, HVAC, plumbing, elevator, façade? What's the per-unit balance and payoff schedule, and is the seller paying it off at close or rolling it to the buyer?
- Is there a deadline driving the sale (1031 exchange, divorce, estate, relocation)? That informs how much negotiation room exists.
- Schools are A-rated — typically a magnet for longer-tenancy family renters. What's the average tenant stay here, and is there a school-zone premium baked into asking?
- The area grade is low — what's the realistic commute time and amenity access for the typical tenant pool here? Any planned neighborhood developments (good or bad) we should know about?
- What's the average days-on-market for RENTAL listings here right now (not sales)? A rising rental-DOM trend means longer vacancies and softer asking-rent achievability than the comps imply.
- What's the recent tenant-quality profile in this submarket — average credit score on applications, eviction rate, late-payment / NSF rate, and stable-employment percentage? A property-management company in the area should have these aggregated.
- How much new apartment / multifamily construction is in the pipeline within 1–3 miles? Heavy new supply (>2% of stock underway) typically softens rents 12–24 months out; light construction supports rent growth.
Investment metrics
- 1% rule
- 0.98% ✗
- Cap rate
- 5.55%
- Cash-on-cash
- -2.65%
- DSCR
- 0.88
- GRM
- 8.5
CMA / ARV
No comps found within radius.
Projected returns pro-forma
-3.0% appreciation · 8.0% rent growth · sell at horizon
- IRR
- -14.0%
- Equity multiple
- 0.47×
- Total profit
- $-29,523
- Equity at exit
- $29,672
- IRR
- 2.4%
- Equity multiple
- 1.22×
- Total profit
- $12,182
- Equity at exit
- $17,206
Cash invested: $55,720 (down + closing). Projections, not guarantees.
Landlord ↔ Tenant lean methodology
- Overall (STATE)
- 55 Moderately Landlord-Leaning
- State Virginia
- 55 Moderately Landlord-Leaning · D+2
- County
- — inherits STATE
- City
- — inherits STATE
ZIP-level market 23453
- Home prices YoY
- -13.4%
- Rents YoY
- 9.7%
- Active inventory
- 104
- Price-to-rent
- 8.5×
Monthly cashflow live
- Estimated rent
- $1,959 high interval (Pro) →
- Mortgage (P&I)
- −$1,044
- Tax from tax record
- −$152 /mo · $1,819/yr
- Insurance
- −$83
- HOA
- −$393
- Vacancy / Maint / Mgmt
- −$411
- Net cashflow
- $-123
Break-even live
Sensitivity live
| Price | -10% $-10 | -5% $-67 | +0% $-123 | +5% $-179 | +10% $-236 |
|---|---|---|---|---|---|
| Rent | -10% $-278 | -5% $-201 | +0% $-123 | +5% $-46 | +10% $32 |
| Rate | -1.0pp $-23 | -0.5pp $-73 | base $-123 | +0.5pp $-175 | +1.0pp $-227 |
UW: 25.0% down · 7.5% · 30yr · 1.5% tax · 5.0% vac · 8.0% maint · 8.0% mgmt
Financing live
Cash to close
- Down payment
- $49,750
- Closing costs
- $5,970
- Reserves months
- —
- Total cash needed
- —
Loan-product check · same deal, 3 products live
Conventional
25% down · 7.5% · 30yr
- Down + closing
- —
- Monthly P&I
- —
- Monthly cashflow
- —
- DSCR
- —
- Eligible?
- —
Personal DTI + credit; lowest rate.
DSCR
20% down · 8.5% · 30yr
- Down + closing
- —
- Monthly P&I
- —
- Monthly cashflow
- —
- DSCR
- —
- Eligible?
- —
No personal income docs; deal must DSCR.
Hard money
10% down · 12.0% · 12mo
- Down + closing
- —
- Monthly P&I
- —
- Monthly cashflow
- —
- DSCR
- —
- Eligible?
- —
Short-term bridge; refi at stabilization.
Rent comps 34 comps
| Address | Beds | Baths | Sqft | Rent | $/sqft | DOM | Units | Dist |
|---|---|---|---|---|---|---|---|---|
| 3702 Canadian Arch Virginia Beach, VA | 2.0 | 1.5 | 1100 | $1,700 | $1.55 | 6d | 1 | 0.12mi |
| 1404 Wendfield Dr Virginia Beach, VA | 3.0 | 1.5 | 1344 | $2,000 | $1.49 | 6d | 1 | 0.40mi |
| 1404 Wendfield Dr #102 Virginia Beach, VA | 3.0 | 1.5 | 1344 | $2,000 | $1.49 | 25d | 1 | 0.40mi |
| 1404 Wendfield Dr #102 Virginia Beach, VA | 3.0 | 1.5 | 1344 | $2,000 | $1.49 | 6d | 1 | 0.40mi |
| 1401 Wendfield Dr #103 Virginia Beach, VA | 3.0 | 1.5 | 1344 | $1,850 | $1.38 | 22d | 1 | 0.40mi |
| 1434 Peony Arch Virginia Beach, VA | 3.0 | 2.0 | 1407 | $2,600 | $1.85 | 25d | 1 | 0.41mi |
| 3500 Irvington Ct Virginia Beach, VA | 2.0 | 2.0 | 999 | $2,000 | $2.00 | 25d | 1 | 0.46mi |
| 3528 Dublin Ct Virginia Beach, VA | 2.0 | 1.0 | 752 | $1,700 | $2.26 | 14d | 1 | 0.48mi |
| 3521 Sierra Arch Virginia Beach, VA | 3.0 | 1.5 | 1420 | $1,650 | $1.16 | 25d | 1 | 0.48mi |
| 1744 River Rock Arch Virginia Beach, VA | 3.0 | 2.0 | 1456 | $2,495 | $1.71 | 19d | 1 | 0.49mi |
| 1785 River Rock Arch Virginia Beach, VA | 3.0 | 2.0 | 1438 | $2,350 | $1.63 | 16d | 1 | 0.54mi |
| 3517 Plum Cres Virginia Beach, VA | 3.0 | 2.0 | 1450 | $2,200 | $1.52 | 14d | 1 | 0.69mi |
| 1301 Pine Cone Cir Virginia Beach, VA | 1.0–3.0 | 1.0–2.0 | 827 | $1,874 | $2.26 | 3d | 13 | 0.73mi |
| 3638 Windmill Dr Virginia Beach, VA | 2.0 | 1.0 | 934 | $1,695 | $1.81 | 12d | 1 | 0.78mi |
| 3500 Green Garden Cir Virginia Beach, VA | 2.0 | 1.0 | 980 | $1,685 | $1.72 | 25d | 1 | 0.79mi |
| 1728 Vankar Dr #104 Virginia Beach, VA | 2.0 | 2.0 | 1293 | $2,495 | $1.93 | 9d | 1 | 0.81mi |
| 1728 Vankar Dr #307 Virginia Beach, VA | 2.0 | 2.0 | 1316 | $2,500 | $1.90 | 19d | 1 | 0.81mi |
| 3480 Landstown Ct Virginia Beach, VA | 3.0 | 2.0 | 1359 | $2,495 | $1.84 | 19d | 1 | 0.85mi |
| 3560 Windmill Dr Virginia Beach, VA | 3.0 | 1.5 | 1080 | $2,100 | $1.94 | 25d | 1 | 0.89mi |
| 1257 Green Cedar Ln Virginia Beach, VA | 2.0 | 1.5 | 950 | $1,725 | $1.82 | 9d | 1 | 0.92mi |
| 3849 Clarendon Way Unit 1 Virginia Beach, VA | 2.0 | 2.5 | 1349 | $2,200 | $1.63 | 14d | 1 | 0.93mi |
| 3304 Weeping Willow Ln Virginia Beach, VA | 3.0 | 1.5 | 1254 | $1,750 | $1.40 | 25d | 1 | 1.01mi |
| 1752 Halesworth Ln Virginia Beach, VA | 2.0 | 2.5 | 1324 | $2,190 | $1.65 | 25d | 1 | 1.02mi |
| 1752 Halesworth Ln Unit 1 Virginia Beach, VA | 2.0 | 2.5 | 1329 | $2,200 | $1.66 | 25d | 1 | 1.02mi |
| 1240 White Birch Ln Virginia Beach, VA | 3.0 | 1.5 | 1254 | $1,950 | $1.56 | 19d | 1 | 1.04mi |
| 1232 White Birch Ln Virginia Beach, VA | 3.0 | 2.0 | 1254 | $2,095 | $1.67 | 25d | 1 | 1.04mi |
| 4156 Clarendon Way Virginia Beach, VA | 2.0 | 2.5 | 1329 | $2,400 | $1.81 | 25d | 1 | 1.10mi |
| 1027 Tivoli Cres Virginia Beach, VA | 1.0–2.0 | 1.0 | 787 | $1,573 | $2.00 | 25d | 1 | 1.21mi |
| 3745 Edenberry Ct Virginia Beach, VA | 1.0 | 1.0 | 920 | $1,699 | $1.85 | 3d | 1 | 1.36mi |
| 3745 Edenberry Ct Virginia Beach, VA | 2.0 | 2.0 | 1044 | $1,899 | $1.82 | 6d | 1 | 1.36mi |
| 713 Willow Lake Cir Virginia Beach, VA | 1.0–2.0 | 1.0–2.0 | 1041 | $2,475 | $2.38 | 25d | 1 | 1.38mi |
| 2009 Inverrary Ct Virginia Beach, VA | 3.0 | 2.5 | 1500 | $2,440 | $1.63 | 14d | 1 | 1.42mi |
| 846 Crashaw St Virginia Beach, VA | 2.0 | 2.0 | 1346 | $1,895 | $1.41 | 16d | 1 | 1.45mi |
| 1400 Dewitt Way Virginia Beach, VA | 2.0–3.0 | 2.0–2.5 | 1212 | $1,700 | $1.40 | 25d | 1 | 1.47mi |
HOA detail condo
- Monthly dues
- $393 · $4,716/yr
- Assessments
- None detected in remarks — confirm with the listing agent.
Listing history 17 events
-
2026-06-21days on market $199,000 Active 21 DOM
-
2026-06-18days on market $199,000 Active 18 DOM
-
2026-06-17days on market $199,000 Active 17 DOM
-
2026-06-16days on market $199,000 Active 16 DOM
-
2026-06-15days on market $199,000 Active 15 DOM
-
2026-06-13pricedays on market $199,000 Active 13 DOM
-
2026-06-09days on market $205,000 Active 9 DOM
-
2026-06-08days on market $205,000 Active 8 DOM
-
2026-06-07days on market $205,000 Active 7 DOM
-
2026-06-03days on market $205,000 Active 3 DOM
-
2026-06-02days on market $205,000 Active 2 DOM
-
2026-06-01statusdays on market $205,000 Active 1 DOM
-
2026-05-31days on market $205,000 Coming Soon 3 DOM
-
2026-05-28historical $205,000
-
2012-06-22soldstatus $75,000
-
2006-01-24soldstatus $135,000
-
2002-05-29soldstatus $96,000
ⓘ Source: listings_history table (triggers on properties + properties_extension) + one-shot
backfill from property_details.listing_events for pre-trigger history.
Tax reassessment forecast VA · Resets to sale price
- Current annual tax
- $1,819 · $152/mo
- Projected year-2 tax
- $1,819 · $152/mo
- Expected delta
- $0/yr ($0/mo · 0.0%)
ⓘ Screening estimate from a state-policy table — verify with the county assessor before closing.
Climate risk First Street
- Flood 1/10 Low FEMA zone X (unshaded) · 0% chance over 30 yrs
- Wildfire 1/10 Low
- Heat 9/10 Extreme 7 d/yr ≥104°F today · 16 d/yr by 30 yrs out
- Wind 8/10 Severe 98% chance of damaging wind over 30 yrs
- Air quality 3/10 Moderate 2 unhealthy d/yr today · 4 by 30 yrs out
Nearby sold comps map
Loading sold comps map…
Walkable amenities ~0.75 mi
Loading nearby amenities…
Taxation est. · year 1
- Rental income
- $23,513
- − Mortgage interest
- −$11,147
- − Property taxes
- −$1,819
- − Insurance
- −$995
- − Repairs & maintenance
- −$1,881
- − Management
- −$1,881
- − HOA
- −$4,716
- − Depreciation
- −$5,789
- Taxable loss
- −$4,715
- Est. tax savings @ 24.0%
- +$1,132
- After-tax cash flow
- $-346/yr
For passive investors: Depreciation is non-cash, so a rental often shows a tax loss while cash-flowing — sheltering income. Rental losses are passive: they offset passive income freely, and up to $25,000/yr can offset ordinary (W-2) income if you actively participate and your MAGI is under $100k (phasing out to $0 by $150k); unused losses carry forward. On sale, claimed depreciation is recaptured at up to 25%, and gains may owe capital-gains tax (a 1031 exchange can defer both). Figures are a year-1 estimate at your 24.0% rate — not tax advice; consult a CPA.
Schools (NCES district)
- District
- Va Beach City Public School District
- NCES district ID
- 5103840
- Math proficiency
- 69% ▼ -19.00%
- Reading proficiency
- 78% ▼ -7.00%
- Median HH income
- $66,452
- Composite
- 63.81/100
- National rank
- #594
- State rank
- #10 of 131 in VA
Livability — Virginia Beach
- Score
- 83/100
- State rank
- #38
- US rank
- #880
Category grades
Schools grade is shown separately in the Schools card above.
Census & demographics
- Census place
- Virginia Beach, VA
- County
- Virginia Beach City · 448,227 people
- City population
- 448,227
- Metro
- Virginia Beach-Norfolk-Newport News, VA-NC
- Population (ZIP)
- 34,482
- Household income
- $93,838
- Rent vs Own
- Severe rent burden
- 799.0
Population outlook (Virginia Beach County) Hauer SSP2
- Today (2025)
- 480,401 people
- By 2030
- 491,221 · +2.3%
- By 2040
- 504,882 · +5.1%
- By 2050
- 508,847 · +5.9%
- By 2075
- 504,831 · +5.1%
- By 2100
- 465,867 · -3.0%
Race, ethnicity, and origin ACS 2023
- Neighborhood character
- Highly diverse neighborhood (Simpson 0.72)
- Race & ethnicity
- White 46% Black 22% Two or more races 14% Asian 12% Hispanic / Latino 10%
- Hispanic origin (detail)
- Mexican 2% Puerto Rican 3%
- Common ancestry
- Slovak 2% Romanian 2% Italian 1%
- Foreign-born
- 11% · Canada, China, Vietnam
- Languages at home
- 84% English-only · Tagalog/Filipino 6% Spanish 5% Other Indo-European 1%
Political lean MEDSL · Virginia Beach
- 2024 margin
- Toss-up / Even · D 50.7% · R 48.0% · Other 1.3%
- 2008→2024 swing
- +3.4pp toward D · 2008: -0.7pp · 2024: 2.6pp
- All cycles
- 2024: D+2.6 2020: D+5.4 2016: R+4.5 2012: R+2.5 2008: R+0.7
Not yet ingested
- Civics
- —
Market trends
- HPI YoY
- ▼ -52.96%
- Current HPI
- 341.8757
- Rent YoY
- ▲ 9.69%
- Metro
- Virginia Beach-Norfolk-Newport News, VA-NC
- State GDP YoY
- ▲ 2.40%
- F500 in state
- 50
Industry mix (Fortune 500 HQ in VA)
| Industry | F500 HQs | Revenue |
|---|---|---|
| Aerospace / Defense | 4 | $236B |
|
||
| Technology / Defense | 3 | $32B |
|
||
| Financial Services | 2 | $176B |
|
||
| Utilities | 2 | $27B |
|
||
| Insurance | 2 | $25B |
|
||
| Technology | 2 | $15B |
|
||
Price history
+113.5% since first listed4 events — show timeline
- 2026-05-28 Coming Soon $205,000 REINMLS
- 2012-06-22 Sold (Public Records) $75,000 Public Records
- 2006-01-24 Sold (Public Records) $135,000 Public Records
- 2002-05-29 Sold (Public Records) $96,000 Public Records
Property tax history
+5.2%/yrLatest (2025): $1,819 · +4.6% YoY. Source: county tax records.
Cash-flow waterfall
monthlySold comps — $/sqft
last 12 mo · ≤1 miLoading sold comps…