801 Harmony Rd · Auburn, WV
Flood risk 10/10 · Severe
- FEMA flood zone
- X (unshaded)
- Chance of flooding over 30 yrs
- 0.99%
- Est. flood insurance / yr
- $507 – $1,088
Fire risk 3/10 · Minor
- Est. fire insurance / yr
- $787 – $1,461
Heat risk 4/10 · Minor
- Hot days now (above 98°F)
- 7 days/yr
- Hot days in 30 yrs
- 18 days/yr
Wind risk 1/10 · Minimal
- Chance of severe wind over 30 yrs
- 1.0%
Air-quality risk 2/10 · Minimal
- Unhealthy air days now
- 0 days/yr
- Unhealthy air days in 30 yrs
- 1 days/yr
Risk factors via First Street. Map © Google.
Why this score? — see what drove the C- grade
The composite is a weighted blend of 9 inputs, each scored 0–100. Each bar is that input's sub-score; the figure is the points it added to the 100-point composite (weight × sub-score).
- Cash flow +15.0/30.0
- Appreciation +7.8/10.0
- ARV discount +7.5/15.0
- 1% rule +5.0/10.0
- DSCR +5.0/10.0
- Schools +2.8/10.0
- Livability +2.6/5.0
- Rent growth +2.5/5.0
- Condition / age +2.5/5.0
$12,900
🖨 Deal sheet (PDF) 📄 Offer letter ✓ Due diligence
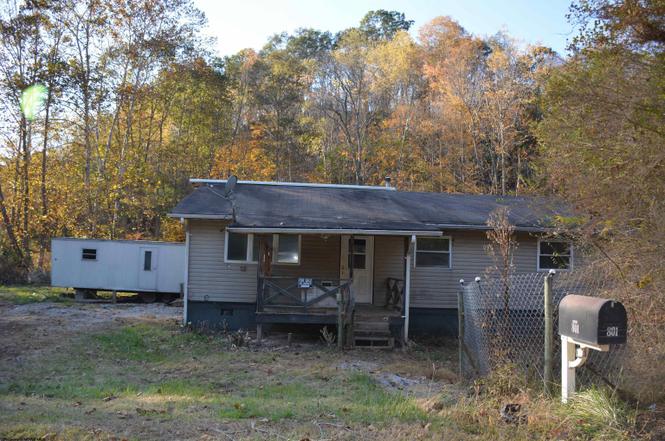
Listing remarks
Home with a built on Mobile Home. Barn and other outbuildings all on over an acre of land along a creek. * Agents-please see agent remarks for submitting offers.
Key facts
- Barn
- Acre of land
- Outbuildings
Tags
Property features AI
Exterior
- Parking: Off-street parking; On-street parking
- Utilities: Private well water
- Home design: Single-family detached residence; One-story; Residential property
- Construction: Frame construction; Shingle roof
- Exterior features: Porch; Cleared lot; Barn(s); Frontage on a stream/creek
Interior
- Bathrooms: 1 full bathroom
- Interior features: 5 total rooms
Neighborhood map
What this means for you Summary
Snapshot
- This is a 3-bed/1.0-bath single-family listed at $13k.
Deal economics
- At list price, monthly cash flow is $655 ($8k/yr) — positive.
- The deal already cash-flows at list — no discount required.
- Meets the 1% rule at list price ($1k rent vs $13k).
- Recommended offer: $12k (9.0% below list) — sets the bar for market timing.
Location & tenants
- Location reads 51/100 on livability (#317 in WV) — a working-class tenant base; expect higher turnover. Strengths: cost of living A+; Watch: health & safety C-, crime D+, amenities F.
- Doddridge County Schools (rural): math 26% / reading 41% proficiency, ranked #20 of 55 in WV (top 36%) — families likely to look elsewhere, expect single-tenant / working-renter base with shorter leases.
- Zoned schools: Doddridge County Elementary School (math 37% / reading 32%, grade F, #148 of 377 statewide, top 49%, 300 students, 0% FRL); Doddridge County Middle School (math 23% / reading 45%, grade F, #36 of 109 statewide, top 35%, 328 students, 0% FRL); Doddridge County High School (math 22% / reading 42%, grade F, #55 of 110 statewide, top 59%, 327 students, 0% FRL) — zoned schools average 0% FRL vs 47% district-wide (47 pts lower); this property's tenant base skews higher-income than the district average.
- Market conditions: 6 active listings in the ZIP.
Forward outlook
- In year one you build about $812 of equity ($89 loan paydown + $723 appreciation (5.6% local appreciation)).
- Doddridge County population projected at +9% by 2050 — modest demand growth; plan on rents tracking national, not racing it.
- At projected returns (5.6% appreciation + 3.0% rent growth), your $4k cash investment doubles in ~1 year — after that, you're playing with house money.
Negotiation context
- It's been on market 107 days — a 9% lower offer ($12k) is reasonable based on typical stale-listing flexibility.
- 2 sale attempts; this cycle's ask has dropped $34k (72%) from the opening price — seller is motivated, your offer sets the floor, not the list.
Risks & watch-outs
- Watch-outs: flood insurance adds $66/mo.
- Climate carrying-cost: severe flood risk — expect insurance premiums to compound above CPI over the hold.
Questions for the listing agent
- It's been on market 107 days. Have you received any prior offers? Is the seller open to a 9% concession, seller financing, or rate buy-down credit?
- What's the actual annual flood-insurance premium (NFIP or private), and is the property in a SFHA with mandatory coverage?
- Why hasn't it sold? Are there any deal-killer items the seller is aware of (foundation, flood, title, zoning, code violations)?
- Is there a deadline driving the sale (1031 exchange, divorce, estate, relocation)? That informs how much negotiation room exists.
- Schools are F-rated, which usually means shorter tenancies and higher turnover. Who's the typical renter profile here, and what's been the actual vacancy rate?
- Crime grade is D in this area — have there been break-ins, vandalism, or insurance claims at this property in the last 3 years? What carrier currently insures it and at what premium?
- What's the average days-on-market for RENTAL listings here right now (not sales)? A rising rental-DOM trend means longer vacancies and softer asking-rent achievability than the comps imply.
- What's the recent tenant-quality profile in this submarket — average credit score on applications, eviction rate, late-payment / NSF rate, and stable-employment percentage? A property-management company in the area should have these aggregated.
- How much new for-sale + rental construction is in the pipeline within 1–3 miles? Heavy new supply typically softens prices + rents 12–24 months out; constrained supply supports both.
Investment metrics
- 1% rule
- 7.95% ✓
- Cap rate
- 73.41%
- Cash-on-cash
- 239.70%
- DSCR
- 11.67
- GRM
- 1.0
CMA / ARV
No comps found within radius.
Projected returns pro-forma
5.61% appreciation · 3.0% rent growth · sell at horizon
- IRR
- —
- Equity multiple
- 13.51×
- Total profit
- $45,203
- Equity at exit
- $7,792
- IRR
- —
- Equity multiple
- 28.82×
- Total profit
- $100,492
- Equity at exit
- $13,864
Cash invested: $3,612 (down + closing). Projections, not guarantees.
Landlord ↔ Tenant lean methodology
- Overall (STATE)
- 83 Strongly Landlord-Friendly
- State West Virginia
- 83 Strongly Landlord-Friendly · R+22
- County
- — inherits STATE
- City
- — inherits STATE
ZIP-level market 26456
- Home prices YoY
- 2.4%
- Active inventory
- 6
- Price-to-rent
- 1.0×
Monthly cashflow live
- Estimated rent
- $1,026 medium interval (Pro) →
- Mortgage (P&I)
- −$68
- Tax est. 1.5%
- −$16 /mo · $194/yr
- Insurance
- −$5
- Flood insurance flood zone
- −$66 /mo · $798/yr
- HOA
- −$0
- Vacancy / Maint / Mgmt
- −$215
- Net cashflow
- $655
Break-even live
Sensitivity live
| Price | -10% $664 | -5% $660 | +0% $655 | +5% $651 | +10% $646 |
|---|---|---|---|---|---|
| Rent | -10% $574 | -5% $615 | +0% $655 | +5% $696 | +10% $736 |
| Rate | -1.0pp $662 | -0.5pp $658 | base $655 | +0.5pp $652 | +1.0pp $648 |
UW: 25.0% down · 7.5% · 30yr · 1.5% tax · 5.0% vac · 8.0% maint · 8.0% mgmt
Financing live
Cash to close
- Down payment
- $3,225
- Closing costs
- $387
- Reserves months
- —
- Total cash needed
- —
Loan-product check · same deal, 3 products live
Conventional
25% down · 7.5% · 30yr
- Down + closing
- —
- Monthly P&I
- —
- Monthly cashflow
- —
- DSCR
- —
- Eligible?
- —
Personal DTI + credit; lowest rate.
DSCR
20% down · 8.5% · 30yr
- Down + closing
- —
- Monthly P&I
- —
- Monthly cashflow
- —
- DSCR
- —
- Eligible?
- —
No personal income docs; deal must DSCR.
Hard money
10% down · 12.0% · 12mo
- Down + closing
- —
- Monthly P&I
- —
- Monthly cashflow
- —
- DSCR
- —
- Eligible?
- —
Short-term bridge; refi at stabilization.
Listing history 5 events
-
2026-05-15status Pending
-
2026-04-27status Active
-
2026-04-27price $12,900
-
2026-03-09price $37,900
-
2025-12-26$46,900 Active
ⓘ Source: listings_history table (triggers on properties + properties_extension) + one-shot
backfill from property_details.listing_events for pre-trigger history.
Climate risk First Street
- Flood 10/10 Extreme FEMA zone X (unshaded) · 99% chance over 30 yrs
- Wildfire 3/10 Moderate
- Heat 4/10 Moderate 7 d/yr ≥98°F today · 18 d/yr by 30 yrs out
- Wind 1/10 Low 100% chance of damaging wind over 30 yrs
- Air quality 2/10 Low 0 unhealthy d/yr today · 1 by 30 yrs out
Nearby sold comps map
Loading sold comps map…
Walkable amenities ~0.75 mi
Loading nearby amenities…
Taxation est. · year 1
- Rental income
- $12,314
- − Mortgage interest
- −$723
- − Property taxes
- −$194
- − Insurance
- −$862
- − Repairs & maintenance
- −$985
- − Management
- −$985
- − Depreciation
- −$375
- Taxable income
- $8,190
- Est. tax owed @ 24.0%
- −$1,966
- After-tax cash flow
- $5,895/yr
For passive investors: Depreciation is non-cash, so a rental often shows a tax loss while cash-flowing — sheltering income. Rental losses are passive: they offset passive income freely, and up to $25,000/yr can offset ordinary (W-2) income if you actively participate and your MAGI is under $100k (phasing out to $0 by $150k); unused losses carry forward. On sale, claimed depreciation is recaptured at up to 25%, and gains may owe capital-gains tax (a 1031 exchange can defer both). Figures are a year-1 estimate at your 24.0% rate — not tax advice; consult a CPA.
Schools (NCES district)
- District
- Doddridge County Schools
- NCES district ID
- 5400270
- Math proficiency
- 26% ▼ -15.00%
- Reading proficiency
- 41% ▼ -7.00%
- Median HH income
- $37,046
- Composite
- 27.81/100
- National rank
- #6888
- State rank
- #20 of 55 in WV
Livability — Auburn
- Score
- 51/100
- State rank
- #317
- US rank
- #25228
Category grades
Schools grade is shown separately in the Schools card above.
Census & demographics
- Population (ZIP)
- 3,258
Population outlook (Doddridge County) Hauer SSP2
- Today (2025)
- 9,087 people
- By 2030
- 9,333 · +2.7%
- By 2040
- 9,735 · +7.1%
- By 2050
- 9,916 · +9.1%
- By 2075
- 9,896 · +8.9%
- By 2100
- 8,410 · -7.5%
Race, ethnicity, and origin ACS 2023
- Neighborhood character
- Predominantly White (95%)
- Race & ethnicity
- White 95% Two or more races 3% Black 2%
- Common ancestry
- Slovak 8% Lithuanian 4% Italian 2%
- Foreign-born
- 2% · Vietnam, Canada
- Languages at home
- 98% English-only · Vietnamese 1% German/W. Germanic 1%
Political lean MEDSL · Doddridge
- 2024 margin
- Solid R (+73.3) · D 12.7% · R 86.0% · Other 1.4%
- 2008→2024 swing
- -24.2pp toward R · 2008: -49.1pp · 2024: -73.3pp
- All cycles
- 2024: R+73.3 2020: R+70.4 2016: R+70.3 2012: R+56.0 2008: R+49.1
Not yet ingested
- Civics
- —
Market trends
- HPI YoY
- ▲ 5.61%
- Current HPI
- 244.3907
- Rent YoY
- —
- Metro
- —
- State GDP YoY
- —
- F500 in state
- 0
Price history
-72.5% since first listed5 events — show timeline
- 2026-05-15 Pending — NCWVREIN
- 2026-04-27 Relisted — NCWVREIN
- 2026-04-27 Price Changed $12,900 NCWVREIN
- 2026-03-09 Price Changed $37,900 NCWVREIN
- 2025-12-26 Listed $46,900 NCWVREIN
Cash-flow waterfall
monthlySold comps — $/sqft
last 12 mo · ≤1 miLoading sold comps…