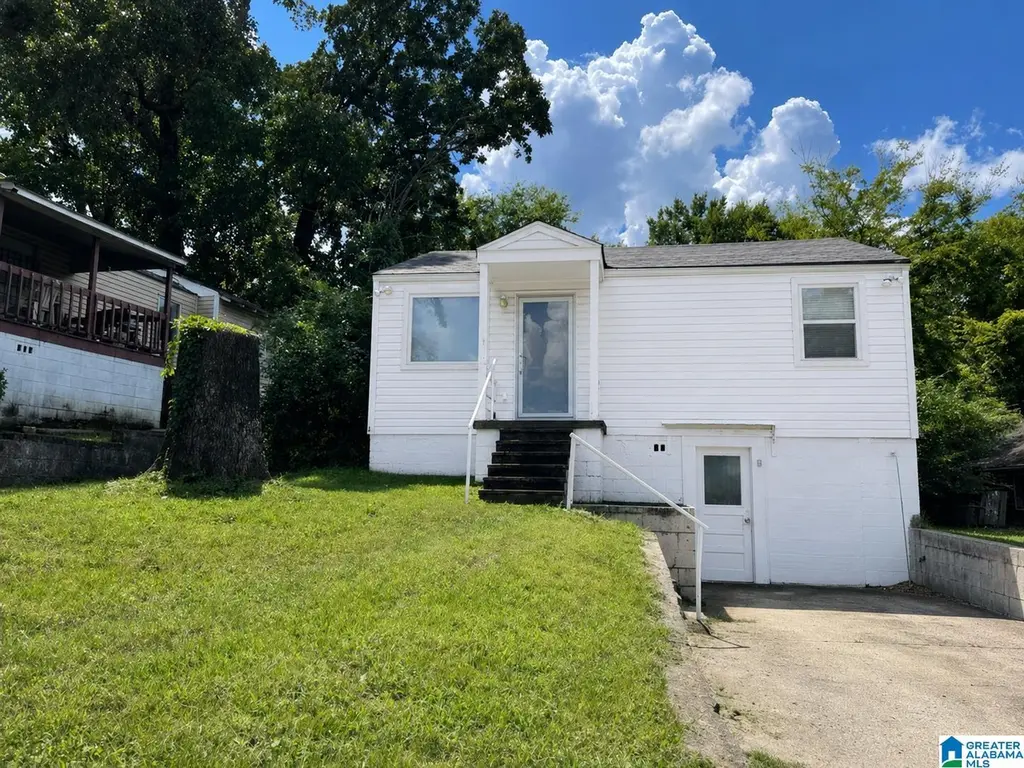
533 Seminole Cir · Fairfield, AL
Flood risk 1/10 · Minimal
- FEMA flood zone
- X (unshaded)
- Chance of flooding over 30 yrs
- 0.0%
- Est. flood insurance / yr
- $473 – $860
Fire risk 1/10 · Minimal
- Est. fire insurance / yr
- $916 – $1,700
Heat risk 6/10 · Moderate
- Hot days now (above 108°F)
- 7 days/yr
- Hot days in 30 yrs
- 18 days/yr
Wind risk 6/10 · Moderate
- Chance of severe wind over 30 yrs
- 27.0%
Air-quality risk 4/10 · Minor
- Unhealthy air days now
- 5 days/yr
- Unhealthy air days in 30 yrs
- 5 days/yr
Risk factors via First Street. Map © Google.
Why this score? — see what drove the C+ grade
The composite is a weighted blend of 9 inputs, each scored 0–100. Each bar is that input's sub-score; the figure is the points it added to the 100-point composite (weight × sub-score).
- Cash flow +24.3/30.0
- ARV discount +12.7/15.0
- DSCR +7.9/10.0
- 1% rule +6.3/10.0
- Livability +3.2/5.0
- Rent growth +2.5/5.0
- Condition / age +2.5/5.0
- Schools +0.7/10.0
- Appreciation +0.0/10.0
$79,000
🖨 Deal sheet 📄 Offer letter ✓ Due diligence
Listing remarks
Charming all-electric home with several major updates already completed! Roof, water heater, windows, plumbing, and electrical systems were all updated approximately 6 years ago, offering added peace of mind for the new owner. HVAC has been well maintained with A/C serviced in 2025, and the furnace is approximately 5 years old. Interior features beautiful new hardwood flooring installed in 2026, adding warmth and modern appeal throughout the home. Property is being sold AS IS, making it a great opportunity for homeowners or investors alike. Buyer to verify all items of importance, including schools, square footage, and utilities. Seller may consider minor repairs.
Key facts
- All electric home
- Updated windows
- Updated water heater
Tags
Property features AI
Finance
- HOA & community: No association fees noted
Exterior
- Parking: Driveway parking
- Utilities: Public water; Connected sewer; Unknown internet service availability; Electric water heater
- Home design: Existing structure; Basement foundation
- Construction: Wood siding exterior
- Exterior features: No pool, patio, decks, or garden/patio; Not waterfront; Lot size approximately 0.17 acres
Interior
- Kitchen: Laminate countertops
- Bedrooms: Two bedrooms on main level
- Flooring: Hardwood and tile flooring
- Bathrooms: One full bathroom with tub/shower combo
- Heating & cooling: Central electric heating; Central electric cooling
- Interior features: Smooth ceilings; Some finished basement area; Partial basement with unfinished areas and concrete block construction; Attic with pull-down access; No additional listed interior features
- Laundry & utility: Main-level laundry with floor drain; Electric dryer hookup; Electric water heater
Neighborhood map
What this means for you Summary
Snapshot
- This is a 2-bed/1.0-bath single-family listed at $79k.
Deal economics
- At list price, monthly cash flow is $160 ($2k/yr) — positive.
- The deal already cash-flows at list — no discount required.
- Meets the 1% rule at list price ($893 rent vs $79k).
- Recommended offer: $77k (3.0% below list) — sets the bar for market timing.
Location & tenants
- Location reads 64/100 on livability (#160 in AL) — a middle-class / working-renter tenant base. Strengths: commute A+, cost of living A+, housing A+; Watch: crime D+, amenities F, employment F.
- Fairfield City (suburban): math 2% / reading 15% proficiency, ranked #125 of 129 in AL (top 97%) — low school quality limits family demand, transient renter base, plan for 1-2y turnover; 84% free/reduced lunch — lower-income household profile, screen leases tightly.
- Zoned schools: Glen Oaks Elementary School (math 2% / reading 17%, grade F, #568 of 627 statewide, top 94%, 324 students, 70% FRL).
- Market conditions: 52 active listings in the ZIP; 6 comparable units currently listed for rent nearby; rentals lingering (median 44d on market — plan ~5-8 weeks vacancy on turnover, expect pricing pressure); 67% of comp listings sitting > 30 days — soft ceiling on asking rent; 2,114 units permitted in Jefferson County in 2024 (556 in 5+ unit buildings).
Forward outlook
- Local home prices are declining (-3.0%/yr); year-one equity from $546 of loan paydown is wiped out by about $2k of value loss. Plan a longer hold.
- Jefferson County population projected to shrink 4% by 2050 — rents likely to lag national; underwrite the cash flow, not the appreciation.
Negotiation context
- It's been on market 39 days — a 3% lower offer ($77k) is reasonable based on typical stale-listing flexibility.
Risks & watch-outs
- Watch-outs: built in 1948 — expect roof / HVAC / electrical / plumbing capex.
- Climate carrying-cost: major wind risk, 27% chance of damaging wind over 30y; extreme-heat days projected 7→18/yr by 2055 (HVAC capex compounding) — expect insurance premiums to compound above CPI over the hold.
Questions for the listing agent
- It's been on market 39 days. Have you received any prior offers? Is the seller open to a 3% concession, seller financing, or rate buy-down credit?
- Built in 1948 — when were the roof, HVAC, electrical panel, plumbing, and water heater last replaced?
- Is there a deadline driving the sale (1031 exchange, divorce, estate, relocation)? That informs how much negotiation room exists.
- Schools are F-rated, which usually means shorter tenancies and higher turnover. Who's the typical renter profile here, and what's been the actual vacancy rate?
- Crime grade is D in this area — have there been break-ins, vandalism, or insurance claims at this property in the last 3 years? What carrier currently insures it and at what premium?
- What's the average days-on-market for RENTAL listings here right now (not sales)? A rising rental-DOM trend means longer vacancies and softer asking-rent achievability than the comps imply.
- What's the recent tenant-quality profile in this submarket — average credit score on applications, eviction rate, late-payment / NSF rate, and stable-employment percentage? A property-management company in the area should have these aggregated.
- How much new for-sale + rental construction is in the pipeline within 1–3 miles? Heavy new supply typically softens prices + rents 12–24 months out; constrained supply supports both.
Investment metrics
- 1% rule
- 1.13% ✓
- Cap rate
- 8.72%
- Cash-on-cash
- 8.66%
- DSCR
- 1.39
- GRM
- 7.4
CMA / ARV
- ARV (median comp)
- $89,307
- List price
- $79,000
- Delta
- -11.54%
- Verdict
- UNDERPRICED
- Comps
- 20 within 1.0 mi
Show comp detail 2 sales within ~0.75 mi
| Address | Dist | Beds/Ba | Sqft | Sold | Price | $/sf | Match |
|---|---|---|---|---|---|---|---|
| 6605 Tensaw Ct | 0.10mi | 2/1.0 | 672 (0%) | 7mo | $86,000 | $128 | 90 |
| 129 61st St | 0.47mi | 2/1.0 | 756 (+12%) | 11mo | $19,000 | $25 | 48 |
Match score weights: distance 35% · size 25% · config 20% · recency 20%. Top-matched comps best support the ARV.
Projected returns pro-forma
-3.0% appreciation · 3.0% rent growth · sell at horizon
- IRR
- -3.2%
- Equity multiple
- 0.88×
- Total profit
- $-2,626
- Equity at exit
- $11,779
- IRR
- 6.6%
- Equity multiple
- 1.49×
- Total profit
- $10,853
- Equity at exit
- $6,830
Cash invested: $22,120 (down + closing). Projections, not guarantees.
Landlord ↔ Tenant lean methodology
- Overall (STATE)
- 90 Strongly Landlord-Friendly
- State Alabama
- 90 Strongly Landlord-Friendly · R+15
- County
- — inherits STATE
- City
- — inherits STATE
ZIP-level market 35064
- Home prices YoY
- -28.8%
- Active inventory
- 52
- Price-to-rent
- 7.4×
Monthly cashflow live
- Estimated rent
- $893 high interval (Pro) →
- Mortgage (P&I)
- −$414
- Tax est. 1.5%
- −$99 /mo · $1,185/yr
- Insurance
- −$33
- HOA
- −$0
- Vacancy / Maint / Mgmt
- −$188
- Net cashflow
- $160
Break-even live
UW: 25.0% down · 7.5% · 30yr · 1.5% tax · 5.0% vac · 8.0% maint · 8.0% mgmt
Financing live
Cash to close
- Down payment
- $19,750
- Closing costs
- $2,370
- Reserves months
- —
- Total cash needed
- —
Loan-product check · same deal, 3 products live
Conventional
25% down · 7.5% · 30yr
- Down + closing
- —
- Monthly P&I
- —
- Monthly cashflow
- —
- DSCR
- —
- Eligible?
- —
Personal DTI + credit; lowest rate.
DSCR
20% down · 8.5% · 30yr
- Down + closing
- —
- Monthly P&I
- —
- Monthly cashflow
- —
- DSCR
- —
- Eligible?
- —
No personal income docs; deal must DSCR.
Hard money
10% down · 12.0% · 12mo
- Down + closing
- —
- Monthly P&I
- —
- Monthly cashflow
- —
- DSCR
- —
- Eligible?
- —
Short-term bridge; refi at stabilization.
Rent comps 6 comps
| Address | Beds | Baths | Sqft | Rent | $/sqft | DOM | Units | Dist |
|---|---|---|---|---|---|---|---|---|
| 125 Jerry Coleman St Fairfield, AL | 2.0 | 1.0 | 715 | $725 | $1.01 | 43d | 1 | 0.42mi |
| 412 Fairfax Dr Unit 432-13 Fairfield, AL | 1.0 | 1.0 | 555 | $775 | $1.40 | 10d | 1 | 0.95mi |
| 1317 Woodward Rd Birmingham, AL | 2.0 | 1.0 | 672 | $800 | $1.19 | 1d | 1 | 1.32mi |
| 5712 Monte Sano Rd Birmingham, AL | 2.0 | 1.0 | 700 | $900 | $1.29 | 43d | 1 | 1.34mi |
| 1045 57th St Birmingham, AL | 1.0 | 1.0 | 700 | $775 | $1.11 | 43d | 1 | 1.43mi |
| 5710 Monte Sano Dr Birmingham, AL | 2.0 | 1.0 | 700 | $950 | $1.36 | 43d | 1 | 1.46mi |
Listing history 15 events
-
2026-06-18days on market $79,000 Active 39 DOM
-
2026-06-17days on market $79,000 Active 38 DOM
-
2026-06-16days on market $79,000 Active 37 DOM
-
2026-06-15days on market $79,000 Active 36 DOM
-
2026-06-13days on market $79,000 Active 34 DOM
-
2026-06-10days on market $79,000 Active 31 DOM
-
2026-06-09days on market $79,000 Active 30 DOM
-
2026-06-08days on market $79,000 Active 29 DOM
-
2026-06-07days on market $79,000 Active 28 DOM
-
2026-06-03days on market $79,000 Active 24 DOM
-
2026-06-02days on market $79,000 Active 23 DOM
-
2026-06-01days on market $79,000 Active 22 DOM
-
2026-05-31days on market $79,000 Active 21 DOM
-
2026-05-10$79,000 Active 664-char remark
-
2016-09-21price $6,000
ⓘ Source: listings_history table (triggers on properties + properties_extension) + one-shot
backfill from property_details.listing_events for pre-trigger history.
Climate risk First Street
- Flood 1/10 Low FEMA zone X (unshaded) · 0% chance over 30 yrs
- Wildfire 1/10 Low
- Heat 6/10 Major 7 d/yr ≥108°F today · 18 d/yr by 30 yrs out
- Wind 6/10 Major 27% chance of damaging wind over 30 yrs
- Air quality 4/10 Moderate 5 unhealthy d/yr today · 5 by 30 yrs out
Nearby sold comps map
Loading sold comps map…
Walkable amenities ~0.75 mi
Loading nearby amenities…
Taxation est. · year 1
- Rental income
- $10,716
- − Mortgage interest
- −$4,425
- − Property taxes
- −$1,185
- − Insurance
- −$395
- − Repairs & maintenance
- −$857
- − Management
- −$857
- − Depreciation
- −$2,298
- Taxable income
- $698
- Est. tax owed @ 24.0%
- −$168
- After-tax cash flow
- $1,747/yr
For passive investors: Depreciation is non-cash, so a rental often shows a tax loss while cash-flowing — sheltering income. Rental losses are passive: they offset passive income freely, and up to $25,000/yr can offset ordinary (W-2) income if you actively participate and your MAGI is under $100k (phasing out to $0 by $150k); unused losses carry forward. On sale, claimed depreciation is recaptured at up to 25%, and gains may owe capital-gains tax (a 1031 exchange can defer both). Figures are a year-1 estimate at your 24.0% rate — not tax advice; consult a CPA.
Schools (NCES district)
- District
- Fairfield City
- NCES district ID
- 0101440
- Math proficiency
- 2% ▼ -18.00%
- Reading proficiency
- 15% ▼ -4.00%
- Median HH income
- $35,288
- Composite
- 6.92/100
- National rank
- #9974
- State rank
- #125 of 129 in AL
Livability — Fairfield
- Score
- 64/100
- State rank
- #160
- US rank
- #14390
Category grades
Schools grade is shown separately in the Schools card above.
Census & demographics
- Census place
- Fairfield, AL
- County
- Jefferson County · 527,445 people
- City population
- 9,872
- Metro
- Birmingham-Hoover, AL
- Population (ZIP)
- 9,872
- Household income
- $48,692
- Rent vs Own
- Severe rent burden
- 784.0
Population outlook (Jefferson County) Hauer SSP2
- Today (2025)
- 669,185 people
- By 2030
- 669,694 · +0.1%
- By 2040
- 661,388 · -1.2%
- By 2050
- 643,086 · -3.9%
- By 2075
- 577,267 · -13.7%
- By 2100
- 474,758 · -29.1%
Race, ethnicity, and origin ACS 2023
- Neighborhood character
- Predominantly Black (91%)
- Race & ethnicity
- Black 91% White 7% Two or more races 2%
- Foreign-born
- 1% · Canada
- Languages at home
- 99% English-only · Spanish 1%
Political lean MEDSL · Jefferson
- 2024 margin
- D (+10.4) · D 54.6% · R 44.2% · Other 1.2%
- 2008→2024 swing
- +5.4pp toward D · 2008: 5.1pp · 2024: 10.4pp
- All cycles
- 2024: D+10.4 2020: D+13.2 2016: D+7.2 2012: D+6.0 2008: D+5.1
Not yet ingested
- Civics
- —
Market trends
- HPI YoY
- ▼ -50.47%
- Current HPI
- 124.7012
- Rent YoY
- —
- Metro
- Birmingham-Hoover, AL
- State GDP YoY
- ▲ 2.94%
- F500 in state
- 4
Industry mix (Fortune 500 HQ in AL)
| Industry | F500 HQs | Revenue |
|---|---|---|
| Financial Services | 1 | $8B |
|
||
| Healthcare | 1 | $5B |
|
||
Price history
+1216.7% since first listed2 events — show timeline
- 2026-05-10 Listed $79,000 Greater Alabama MLS
- 2016-09-21 Price Changed $6,000 Greater Alabama MLS
Cash-flow waterfall
monthlySold comps — $/sqft
last 12 mo · ≤1 miLoading sold comps…