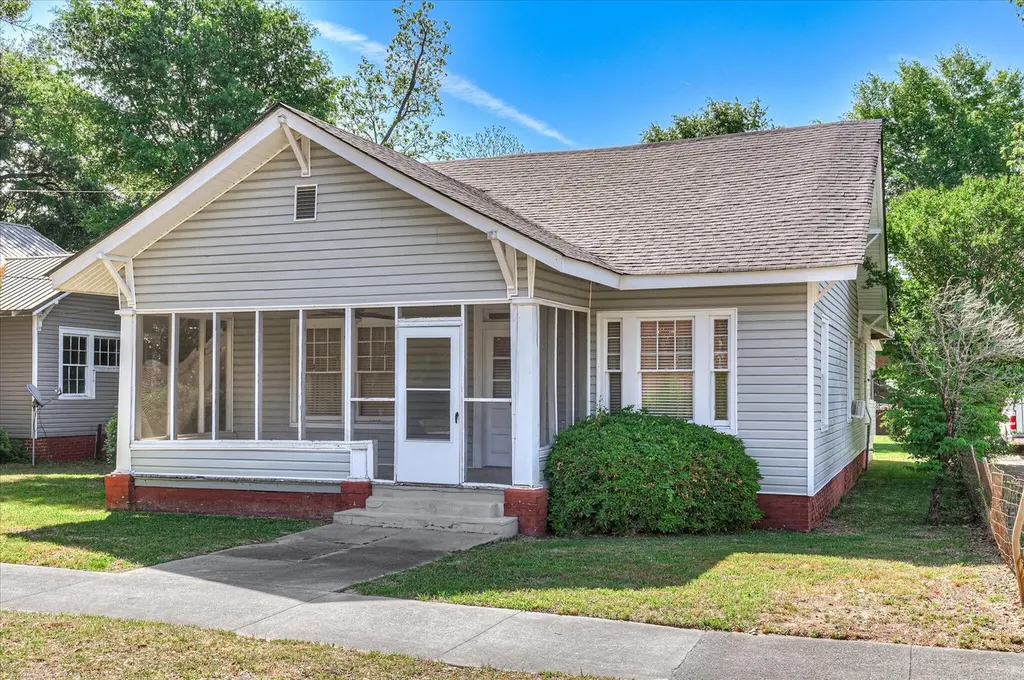
110 E 8th St · Waynesboro, GA
Flood risk 1/10 · Minimal
- FEMA flood zone
- X (unshaded)
- Chance of flooding over 30 yrs
- 0.0%
- Est. flood insurance / yr
- $507 – $1,088
Fire risk 3/10 · Minor
- Est. fire insurance / yr
- $963 – $1,789
Heat risk 8/10 · Major
- Hot days now (above 107°F)
- 7 days/yr
- Hot days in 30 yrs
- 18 days/yr
Wind risk 7/10 · Major
- Chance of severe wind over 30 yrs
- 78.0%
Air-quality risk 2/10 · Minimal
- Unhealthy air days now
- 2 days/yr
- Unhealthy air days in 30 yrs
- 2 days/yr
Risk factors via First Street. Map © Google.
Why this score? — see what drove the B- grade
The composite is a weighted blend of 9 inputs, each scored 0–100. Each bar is that input's sub-score; the figure is the points it added to the 100-point composite (weight × sub-score).
- Cash flow +28.2/30.0
- ARV discount +15.0/15.0
- DSCR +10.0/10.0
- 1% rule +6.6/10.0
- Livability +3.2/5.0
- Rent growth +2.5/5.0
- Condition / age +2.5/5.0
- Schools +1.5/10.0
- Appreciation +0.0/10.0
$115,000
🖨 Deal sheet (PDF) 📄 Offer letter ✓ Due diligence
Listing remarks
Circa-1920 cottage located in the heart of Waynesboro's historc distict. .. With approximately 1,397 square feet, this 2-bedroom, 1 bathroom home has large living and dining rooms, high ceilings, four decorative fireplaces and original wood flooring. Excellent potential as a residence, office space and more. Zoned C-1. Situated on 0.24-acre lot. Property to be sold as-is. No seller disclosure available.
Key facts
- 0.24 acre lot
- Built 1920
Neighborhood map
What this means for you Summary
Snapshot
- This is a 3-bed/2.0-bath single-family listed at $115k.
Deal economics
- At list price, monthly cash flow is $364 ($4k/yr) — positive.
- The deal already cash-flows at list — no discount required.
- Meets the 1% rule at list price ($1k rent vs $115k).
- Cap rate 10.1% vs local median 3.3% in Waynesboro — top-decile yield for the area; either an underpriced asset or a hidden risk that comps aren't pricing in. Stress-test before assuming the spread holds.
Location & tenants
- Location reads 65/100 on livability (#221 in GA) — a middle-class / working-renter tenant base. Strengths: cost of living A+, housing A+, health & safety B+; Watch: crime C-, employment D, amenities F.
- Burke County (town): math 16% / reading 21% proficiency, ranked #148 of 174 in GA (top 85%) — low school quality limits family demand, transient renter base, plan for 1-2y turnover; 72% free/reduced lunch — lower-income household profile, screen leases tightly.
- Zoned schools: Waynesboro Primary School (961 students, 100% FRL); Burke County Middle School (math 15% / reading 26%, grade F, #345 of 470 statewide, top 74%, 882 students, 100% FRL); Burke County High School (math 4% / reading 17%, grade F, #348 of 424 statewide, top 83%, 1,170 students, 100% FRL) — zoned schools average 100% FRL vs 72% district-wide (28 pts higher); higher-poverty schools than district average — tighter screening recommended.
- Market conditions: 87 active listings in the ZIP; 65 units permitted in Burke County in 2024 (0 in 5+ unit buildings).
Forward outlook
- Local home prices are declining (-3.0%/yr); year-one equity from $795 of loan paydown is wiped out by about $3k of value loss. Plan a longer hold.
- Burke County population projected at -24% by 2050 — secular population decline; favor cash flow + early exit over multi-decade hold.
- At projected returns (-3.0% appreciation + 3.0% rent growth), your $32k cash investment doubles in ~9 years — after that, you're playing with house money.
Negotiation context
- Only 0 days on market — expect competitive offers; lowballing is unlikely to land.
- 2 sale attempts with the ask held roughly flat each time — persistent listings suggest the price (not the market) is what's stuck; bring a comps-based counter.
- Current owner paid $32k; list at $115k implies a 259% gain — meaningful room to come down on a strong offer.
Risks & watch-outs
- Watch-outs: built in 1920 — expect roof / HVAC / electrical / plumbing capex.
- Climate carrying-cost: major wind risk, 78% chance of damaging wind over 30y; extreme-heat days projected 7→18/yr by 2055 (HVAC capex compounding) — expect insurance premiums to compound above CPI over the hold.
Questions for the listing agent
- Built in 1920 — when were the roof, HVAC, electrical panel, plumbing, and water heater last replaced?
- Is there a deadline driving the sale (1031 exchange, divorce, estate, relocation)? That informs how much negotiation room exists.
- Schools are F-rated, which usually means shorter tenancies and higher turnover. Who's the typical renter profile here, and what's been the actual vacancy rate?
- What's the average days-on-market for RENTAL listings here right now (not sales)? A rising rental-DOM trend means longer vacancies and softer asking-rent achievability than the comps imply.
- What's the recent tenant-quality profile in this submarket — average credit score on applications, eviction rate, late-payment / NSF rate, and stable-employment percentage? A property-management company in the area should have these aggregated.
- How much new for-sale + rental construction is in the pipeline within 1–3 miles? Heavy new supply typically softens prices + rents 12–24 months out; constrained supply supports both.
Investment metrics
- 1% rule
- 1.16% ✓
- Cap rate
- 10.09%
- Cash-on-cash
- 13.55%
- DSCR
- 1.60
- GRM
- 7.2
CMA / ARV
- ARV (on-the-fly)
- $203,962
- Comps found
- 8
Show comp detail 8 sales within ~0.75 mi
| Address | Dist | Beds/Ba | Sqft | Sold | Price | $/sf | Match |
|---|---|---|---|---|---|---|---|
| 110 E 8th St | 0.00mi | 2/1.0 (-1) | 1,397 (0%) | 0mo | $115,000 | $82 | 91 |
| 413 Victory Dr | 0.66mi | 3/2.0 | 1,404 (+0%) | 15mo | $205,000 | $146 | 56 |
| 1008 Waters St | 0.44mi | 3/2.0 | 1,480 (+6%) | 16mo | $65,000 | $44 | 56 |
| 511 Forest Dr | 0.51mi | 3/1.5 | 1,248 (-11%) | 6mo | $215,000 | $172 | 51 |
| 505 Anthony Rd | 0.67mi | 3/1.0 | 1,235 (-12%) | 4mo | $230,000 | $186 | 42 |
| 410 Jones Ave | 0.59mi | 2/2.0 (-1) | 1,320 (-6%) | 23mo | $153,450 | $116 | 39 |
| 510 Park Dr | 0.72mi | 3/1.5 | 1,234 (-12%) | 7mo | $205,000 | $166 | 39 |
| 405 Liberty St | 0.54mi | 3/1.0 | 1,573 (+13%) | 23mo | $150,000 | $95 | 31 |
Match score weights: distance 35% · size 25% · config 20% · recency 20%. Top-matched comps best support the ARV.
Projected returns pro-forma
-3.0% appreciation · 3.0% rent growth · sell at horizon
- IRR
- 3.6%
- Equity multiple
- 1.14×
- Total profit
- $4,475
- Equity at exit
- $17,147
- IRR
- 13.1%
- Equity multiple
- 2.04×
- Total profit
- $33,524
- Equity at exit
- $9,943
Cash invested: $32,200 (down + closing). Projections, not guarantees.
Landlord ↔ Tenant lean methodology
- Overall (STATE)
- 90 Strongly Landlord-Friendly
- State Georgia
- 90 Strongly Landlord-Friendly · R+3
- County
- — inherits STATE
- City
- — inherits STATE
ZIP-level market 30830
- Home prices YoY
- -31.3%
- Active inventory
- 87
- Price-to-rent
- 7.2×
Monthly cashflow live
- Estimated rent
- $1,329 medium interval (Pro) →
- Mortgage (P&I)
- −$603
- Tax from tax record
- −$35 /mo · $422/yr
- Insurance
- −$48
- HOA
- −$0
- Vacancy / Maint / Mgmt
- −$279
- Net cashflow
- $364
Break-even live
Sensitivity live
| Price | -10% $429 | -5% $396 | +0% $364 | +5% $331 | +10% $298 |
|---|---|---|---|---|---|
| Rent | -10% $259 | -5% $311 | +0% $364 | +5% $416 | +10% $469 |
| Rate | -1.0pp $421 | -0.5pp $393 | base $364 | +0.5pp $334 | +1.0pp $303 |
UW: 25.0% down · 7.5% · 30yr · 1.5% tax · 5.0% vac · 8.0% maint · 8.0% mgmt
Financing live
Cash to close
- Down payment
- $28,750
- Closing costs
- $3,450
- Reserves months
- —
- Total cash needed
- —
Loan-product check · same deal, 3 products live
Conventional
25% down · 7.5% · 30yr
- Down + closing
- —
- Monthly P&I
- —
- Monthly cashflow
- —
- DSCR
- —
- Eligible?
- —
Personal DTI + credit; lowest rate.
DSCR
20% down · 8.5% · 30yr
- Down + closing
- —
- Monthly P&I
- —
- Monthly cashflow
- —
- DSCR
- —
- Eligible?
- —
No personal income docs; deal must DSCR.
Hard money
10% down · 12.0% · 12mo
- Down + closing
- —
- Monthly P&I
- —
- Monthly cashflow
- —
- DSCR
- —
- Eligible?
- —
Short-term bridge; refi at stabilization.
Listing history 6 events
-
2026-04-24status Pending
-
2026-04-24historical
-
2026-04-24historical
-
2026-04-20$115,000 Active
-
2026-04-20$115,000
-
1991-09-04soldstatus $32,000
ⓘ Source: listings_history table (triggers on properties + properties_extension) + one-shot
backfill from property_details.listing_events for pre-trigger history.
Tax reassessment forecast GA · Resets to sale price
- Current annual tax
- $422 · $35/mo
- Projected year-2 tax
- $1,058 · $88/mo
- Expected delta
- +$636/yr (+$53/mo · 150.8%)
ⓘ Screening estimate from a state-policy table — verify with the county assessor before closing.
Climate risk First Street
- Flood 1/10 Low FEMA zone X (unshaded) · 0% chance over 30 yrs
- Wildfire 3/10 Moderate
- Heat 8/10 Severe 7 d/yr ≥107°F today · 18 d/yr by 30 yrs out
- Wind 7/10 Severe 78% chance of damaging wind over 30 yrs
- Air quality 2/10 Low 2 unhealthy d/yr today · 2 by 30 yrs out
Nearby sold comps map
Loading sold comps map…
Walkable amenities ~0.75 mi
Loading nearby amenities…
Taxation est. · year 1
- Rental income
- $15,945
- − Mortgage interest
- −$6,442
- − Property taxes
- −$422
- − Insurance
- −$575
- − Repairs & maintenance
- −$1,276
- − Management
- −$1,276
- − Depreciation
- −$3,345
- Taxable income
- $2,610
- Est. tax owed @ 24.0%
- −$626
- After-tax cash flow
- $3,737/yr
For passive investors: Depreciation is non-cash, so a rental often shows a tax loss while cash-flowing — sheltering income. Rental losses are passive: they offset passive income freely, and up to $25,000/yr can offset ordinary (W-2) income if you actively participate and your MAGI is under $100k (phasing out to $0 by $150k); unused losses carry forward. On sale, claimed depreciation is recaptured at up to 25%, and gains may owe capital-gains tax (a 1031 exchange can defer both). Figures are a year-1 estimate at your 24.0% rate — not tax advice; consult a CPA.
Schools (NCES district)
- District
- Burke County
- NCES district ID
- 1300660
- Math proficiency
- 16% ▼ -12.00%
- Reading proficiency
- 21% ▼ -6.00%
- Median HH income
- $34,532
- Composite
- 15.18/100
- National rank
- #9343
- State rank
- #148 of 174 in GA
Livability — Waynesboro
- Score
- 65/100
- State rank
- #221
- US rank
- #12962
Category grades
Schools grade is shown separately in the Schools card above.
Census & demographics
- Census place
- Waynesboro, GA
- Population (ZIP)
- 15,073
Population outlook (Burke County) Hauer SSP2
- Today (2025)
- 21,186 people
- By 2030
- 20,207 · -4.6%
- By 2040
- 18,109 · -14.5%
- By 2050
- 16,102 · -24.0%
- By 2075
- 12,103 · -42.9%
- By 2100
- 9,671 · -54.4%
Race, ethnicity, and origin ACS 2023
- Neighborhood character
- Diverse neighborhood (Simpson 0.57)
- Race & ethnicity
- Black 50% White 42% Two or more races 4% Hispanic / Latino 3%
- Common ancestry
- Italian 1% Slovak 1% Lithuanian 1%
- Foreign-born
- 2% · Canada, South Korea
- Languages at home
- 97% English-only · Spanish 2% Korean 1%
Political lean MEDSL · Burke
- 2024 margin
- Lean R (+9.3) · D 45.1% · R 54.4%
- 2008→2024 swing
- -18.6pp toward R · 2008: 9.2pp · 2024: -9.3pp
- All cycles
- 2024: R+9.3 2020: R+1.8 2016: D+2.6 2012: D+11.3 2008: D+9.2
Not yet ingested
- Civics
- —
Market trends
- HPI YoY
- ▼ -87.87%
- Current HPI
- 192.6851
- Rent YoY
- —
- Metro
- —
- State GDP YoY
- ▲ 2.66%
- F500 in state
- 28
Industry mix (Fortune 500 HQ in GA)
| Industry | F500 HQs | Revenue |
|---|---|---|
| Paper / Packaging | 2 | $29B |
|
||
| Retail | 1 | $160B |
|
||
| Transportation / Logistics | 1 | $91B |
|
||
| Airlines | 1 | $62B |
|
||
| Consumer Goods | 1 | $47B |
|
||
| Utilities | 1 | $25B |
|
||
Price history
+259.4% since first listed6 events — show timeline
- 2026-04-24 Pending — Hive MLS
- 2026-04-24 Listing Removed — Hive MLS
- 2026-04-24 Listing Removed — Hive MLS
- 2026-04-20 Listed $115,000 Hive MLS
- 2026-04-20 Listed $115,000 Hive MLS
- 1991-09-04 Sold (Public Records) $32,000 Public Records
Property tax history
-0.9%/yrLatest (2025): $422 · -8.1% YoY. Source: county tax records.
Cash-flow waterfall
monthlySold comps — $/sqft
last 12 mo · ≤1 miLoading sold comps…