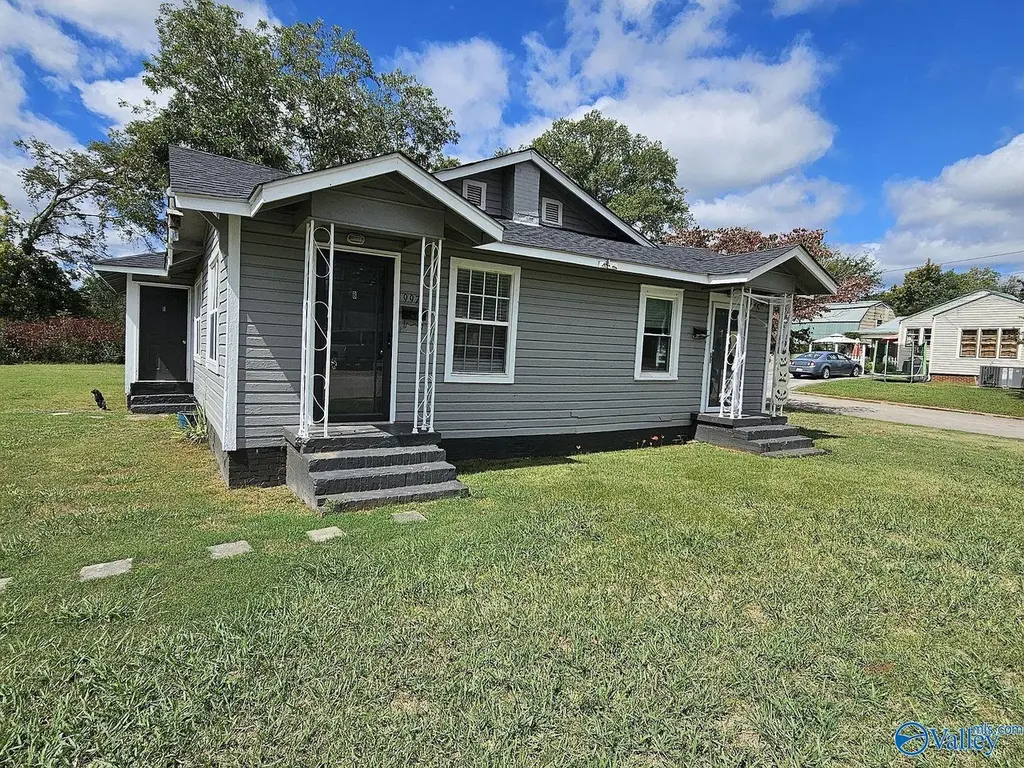
997 Main St · Moulton, AL
Flood risk 1/10 · Minimal
- FEMA flood zone
- X (unshaded)
- Chance of flooding over 30 yrs
- 0.0%
- Est. flood insurance / yr
- $507 – $1,088
Fire risk 5/10 · Moderate
- Est. fire insurance / yr
- $916 – $1,700
Heat risk 5/10 · Moderate
- Hot days now (above 106°F)
- 7 days/yr
- Hot days in 30 yrs
- 20 days/yr
Wind risk 5/10 · Moderate
- Chance of severe wind over 30 yrs
- 26.0%
Air-quality risk 2/10 · Minimal
- Unhealthy air days now
- 1 days/yr
- Unhealthy air days in 30 yrs
- 1 days/yr
Risk factors via First Street. Map © Google.
Why this score? — see what drove the D- grade
The composite is a weighted blend of 9 inputs, each scored 0–100. Each bar is that input's sub-score; the figure is the points it added to the 100-point composite (weight × sub-score).
- Cash flow +15.4/30.0
- ARV discount +5.4/15.0
- DSCR +4.7/10.0
- 1% rule +3.0/10.0
- Livability +3.0/5.0
- Rent growth +2.5/5.0
- Condition / age +2.5/5.0
- Schools +2.2/10.0
- Appreciation +0.0/10.0
$200,000
🖨 Deal sheet 📄 Offer letter ✓ Due diligence
Key facts
- 0.37 acre lot
- 4 parking spots
- Listed 13 days
Property features AI
Finance
- HOA & community: Located in the Heflin Addition subdivision
Exterior
- Parking: Four parking spaces
- Utilities: No gas service
- Home design: Duplex residential income property; Single-story
- Exterior features: Public water; Public sewer; Driveway with concrete surface; On-site parking lot; Open parking available
Interior
- Kitchen: Oven; Refrigerator; Dishwasher
- Interior features: Central heating and central air conditioning; No view
- Laundry & utility: Washer
Neighborhood map
What this means for you Summary
Snapshot
- This is a 2-bed/1.0-bath single-family listed at $200k.
Deal economics
- At list price, monthly cash flow is $78 ($936/yr) — positive.
- The deal already cash-flows at list — no discount required.
- To meet the 1% rule (rent ≥ 1% of price), the offer needs to be $160k (20.0% below list).
- Recommended offer: $160k (20.0% below list) — sets the bar for 1% rule.
- Cap rate 6.8% vs local median 3.5% in Moulton — top-decile yield for the area; either an underpriced asset or a hidden risk that comps aren't pricing in. Stress-test before assuming the spread holds.
Location & tenants
- Location reads 60/100 on livability (#296 in AL) — a middle-class / working-renter tenant base. Strengths: cost of living A+, housing A+; Watch: amenities F, commute F, employment F.
- Lawrence County (rural): math 14% / reading 38% proficiency, ranked #85 of 129 in AL (top 66%) — low school quality limits family demand, transient renter base, plan for 1-2y turnover.
- Zoned schools: Moulton Elementary School (math 32% / reading 53%, grade F, #209 of 627 statewide, top 34%, 644 students, 58% FRL); Moulton Middle School (math 9% / reading 42%, grade F, #158 of 257 statewide, top 63%, 509 students, 65% FRL).
- Market conditions: 94 active listings in the ZIP; 1 comparable units currently listed for rent nearby; 5 units permitted in Lawrence County in 2024 (0 in 5+ unit buildings).
Forward outlook
- Local home prices are declining (-3.0%/yr); year-one equity from $1k of loan paydown is wiped out by about $6k of value loss. Plan a longer hold.
- Lawrence County population projected at -25% by 2050 — secular population decline; favor cash flow + early exit over multi-decade hold.
Negotiation context
- Only 14 days on market — expect competitive offers; lowballing is unlikely to land.
- 2 sale attempts with the ask held roughly flat each time — persistent listings suggest the price (not the market) is what's stuck; bring a comps-based counter.
Risks & watch-outs
- Watch-outs: built in 1940 — expect roof / HVAC / electrical / plumbing capex.
- Climate carrying-cost: moderate wind risk, 26% chance of damaging wind over 30y; moderate wildfire risk; extreme-heat days projected 7→20/yr by 2055 (HVAC capex compounding) — expect insurance premiums to compound above CPI over the hold.
Questions for the listing agent
- Built in 1940 — when were the roof, HVAC, electrical panel, plumbing, and water heater last replaced?
- Is there a deadline driving the sale (1031 exchange, divorce, estate, relocation)? That informs how much negotiation room exists.
- Schools are F-rated, which usually means shorter tenancies and higher turnover. Who's the typical renter profile here, and what's been the actual vacancy rate?
- The area grade is low — what's the realistic commute time and amenity access for the typical tenant pool here? Any planned neighborhood developments (good or bad) we should know about?
- What's the average days-on-market for RENTAL listings here right now (not sales)? A rising rental-DOM trend means longer vacancies and softer asking-rent achievability than the comps imply.
- What's the recent tenant-quality profile in this submarket — average credit score on applications, eviction rate, late-payment / NSF rate, and stable-employment percentage? A property-management company in the area should have these aggregated.
- How much new for-sale + rental construction is in the pipeline within 1–3 miles? Heavy new supply typically softens prices + rents 12–24 months out; constrained supply supports both.
Investment metrics
- 1% rule
- 0.80% ✗
- Cap rate
- 6.76%
- Cash-on-cash
- 1.67%
- DSCR
- 1.07
- GRM
- 10.4
CMA / ARV
- ARV (on-the-fly)
- $191,168
- Comps found
- 12
Show comp detail 12 sales within ~0.75 mi
| Address | Dist | Beds/Ba | Sqft | Sold | Price | $/sf | Match |
|---|---|---|---|---|---|---|---|
| 1134 Main St | 0.15mi | 3/1.0 (+1) | 1,440 (-13%) | 4mo | $39,000 | $27 | 64 |
| 34 Walnut St E | 0.38mi | 3/2.5 (+1) | 1,708 (+4%) | 1mo | $290,000 | $170 | 64 |
| 1147 Main St | 0.16mi | 3/2.0 (+1) | 1,719 (+4%) | 20mo | $199,900 | $116 | 60 |
| 108 Beacon St | 0.26mi | 3/2.0 (+1) | 1,673 (+2%) | 22mo | $220,000 | $132 | 58 |
| 438 East St | 0.49mi | 2/1.0 | 1,676 (+2%) | 23mo | $116,000 | $69 | 55 |
| 15122 Market St | 0.35mi | 3/1.0 (+1) | 1,720 (+4%) | 23mo | $185,000 | $108 | 52 |
| 510 Andrew Ct | 0.41mi | 3/2.0 (+1) | 1,720 (+4%) | 23mo | $300,000 | $174 | 46 |
| 326 Walnut St | 0.40mi | 3/2.0 (+1) | 1,452 (-12%) | 9mo | $162,000 | $112 | 45 |
| 15144 Market St | 0.37mi | 2/2.0 | 1,500 (-9%) | 24mo | $189,900 | $127 | 44 |
| 14079 Market St | 0.70mi | 3/2.0 (+1) | 1,738 (+6%) | 21mo | $169,900 | $98 | 32 |
| 111 Thomas St | 0.69mi | 3/2.0 (+1) | 1,849 (+12%) | 14mo | $276,000 | $149 | 26 |
| 970 Coffey St | 0.74mi | 3/1.0 (+1) | 1,464 (-11%) | 20mo | $155,000 | $106 | 25 |
Match score weights: distance 35% · size 25% · config 20% · recency 20%. Top-matched comps best support the ARV.
Projected returns pro-forma
-3.0% appreciation · 3.0% rent growth · sell at horizon
- IRR
- -13.7%
- Equity multiple
- 0.51×
- Total profit
- $-27,536
- Equity at exit
- $29,821
- IRR
- -4.9%
- Equity multiple
- 0.68×
- Total profit
- $-17,970
- Equity at exit
- $17,292
Cash invested: $56,000 (down + closing). Projections, not guarantees.
Landlord ↔ Tenant lean methodology
- Overall (STATE)
- 90 Strongly Landlord-Friendly
- State Alabama
- 90 Strongly Landlord-Friendly · R+15
- County
- — inherits STATE
- City
- — inherits STATE
ZIP-level market 35650
- Home prices YoY
- -23.4%
- Active inventory
- 94
- Price-to-rent
- 10.4×
Monthly cashflow live
- Estimated rent
- $1,600 medium interval (Pro) →
- Mortgage (P&I)
- −$1,049
- Tax from tax record
- −$54 /mo · $646/yr
- Insurance
- −$83
- HOA
- −$0
- Vacancy / Maint / Mgmt
- −$336
- Net cashflow
- $78
Break-even live
UW: 25.0% down · 7.5% · 30yr · 1.5% tax · 5.0% vac · 8.0% maint · 8.0% mgmt
Financing live
Cash to close
- Down payment
- $50,000
- Closing costs
- $6,000
- Reserves months
- —
- Total cash needed
- —
Loan-product check · same deal, 3 products live
Conventional
25% down · 7.5% · 30yr
- Down + closing
- —
- Monthly P&I
- —
- Monthly cashflow
- —
- DSCR
- —
- Eligible?
- —
Personal DTI + credit; lowest rate.
DSCR
20% down · 8.5% · 30yr
- Down + closing
- —
- Monthly P&I
- —
- Monthly cashflow
- —
- DSCR
- —
- Eligible?
- —
No personal income docs; deal must DSCR.
Hard money
10% down · 12.0% · 12mo
- Down + closing
- —
- Monthly P&I
- —
- Monthly cashflow
- —
- DSCR
- —
- Eligible?
- —
Short-term bridge; refi at stabilization.
Rent comps 1 comps
| Address | Beds | Baths | Sqft | Rent | $/sqft | DOM | Units | Dist |
|---|---|---|---|---|---|---|---|---|
| 160 Swansea Ln Moulton, AL | 3.0 | 2.0 | 1200 | $1,600 | $1.33 | 43d | 1 | 1.24mi |
Listing history 11 events
-
2026-06-19days on market $200,000 Active 14 DOM
-
2026-06-18days on market $200,000 Active 13 DOM
-
2026-06-17days on market $200,000 Active 12 DOM
-
2026-06-16days on market $200,000 Active 11 DOM
-
2026-06-15days on market $200,000 Active 10 DOM
-
2026-06-14days on market $200,000 Active 8 DOM
-
2026-06-13days on market $200,000 Active 7 DOM
-
2026-06-10days on market $200,000 Active 5 DOM
-
2026-06-09days on market $200,000 Active 4 DOM
-
2026-06-08days on market $200,000 Active 3 DOM
-
2026-06-07$200,000 Active 2 DOM
ⓘ Source: listings_history table (triggers on properties + properties_extension) + one-shot
backfill from property_details.listing_events for pre-trigger history.
Tax reassessment forecast AL · Resets to sale price
- Current annual tax
- $646 · $54/mo
- Projected year-2 tax
- $820 · $68/mo
- Expected delta
- +$174/yr (+$15/mo · 27.0%)
ⓘ Screening estimate from a state-policy table — verify with the county assessor before closing.
Climate risk First Street
- Flood 1/10 Low FEMA zone X (unshaded) · 0% chance over 30 yrs
- Wildfire 5/10 Major
- Heat 5/10 Major 7 d/yr ≥106°F today · 20 d/yr by 30 yrs out
- Wind 5/10 Major 26% chance of damaging wind over 30 yrs
- Air quality 2/10 Low 1 unhealthy d/yr today · 1 by 30 yrs out
Nearby sold comps map
Loading sold comps map…
Walkable amenities ~0.75 mi
Loading nearby amenities…
Taxation est. · year 1
- Rental income
- $19,200
- − Mortgage interest
- −$11,203
- − Property taxes
- −$646
- − Insurance
- −$1,000
- − Repairs & maintenance
- −$1,536
- − Management
- −$1,536
- − Depreciation
- −$5,818
- Taxable loss
- −$2,539
- Est. tax savings @ 24.0%
- +$609
- After-tax cash flow
- $1,546/yr
For passive investors: Depreciation is non-cash, so a rental often shows a tax loss while cash-flowing — sheltering income. Rental losses are passive: they offset passive income freely, and up to $25,000/yr can offset ordinary (W-2) income if you actively participate and your MAGI is under $100k (phasing out to $0 by $150k); unused losses carry forward. On sale, claimed depreciation is recaptured at up to 25%, and gains may owe capital-gains tax (a 1031 exchange can defer both). Figures are a year-1 estimate at your 24.0% rate — not tax advice; consult a CPA.
Schools (NCES district)
- District
- Lawrence County
- NCES district ID
- 0102040
- Math proficiency
- 14% ▼ -25.00%
- Reading proficiency
- 38% ▼ -4.00%
- Median HH income
- $40,669
- Composite
- 21.9/100
- National rank
- #8230
- State rank
- #85 of 129 in AL
Livability — Moulton
- Score
- 60/100
- State rank
- #296
- US rank
- #19034
Category grades
Schools grade is shown separately in the Schools card above.
Census & demographics
- Census place
- Moulton, AL
- Population (ZIP)
- 13,485
Population outlook (Lawrence County) Hauer SSP2
- Today (2025)
- 30,827 people
- By 2030
- 29,343 · -4.8%
- By 2040
- 26,268 · -14.8%
- By 2050
- 23,052 · -25.2%
- By 2075
- 17,414 · -43.5%
- By 2100
- 13,600 · -55.9%
Race, ethnicity, and origin ACS 2023
- Neighborhood character
- Predominantly White (82%)
- Race & ethnicity
- White 82% Two or more races 8% Black 4% Native American 3% Hispanic / Latino 3%
- Common ancestry
- Slovak 3% Serbian 1% Italian 1%
- Foreign-born
- 1% · Canada
- Languages at home
- 97% English-only · Spanish 3%
Political lean MEDSL · Lawrence
- 2024 margin
- Solid R (+62.3) · D 18.5% · R 80.8%
- 2008→2024 swing
- -34.3pp toward R · 2008: -28.0pp · 2024: -62.3pp
- All cycles
- 2024: R+62.3 2020: R+54.6 2016: R+48.7 2012: R+27.0 2008: R+28.0
Not yet ingested
- Civics
- —
Market trends
- HPI YoY
- ▼ -61.22%
- Current HPI
- 200.4657
- Rent YoY
- —
- Metro
- —
- State GDP YoY
- ▲ 2.94%
- F500 in state
- 4
Industry mix (Fortune 500 HQ in AL)
| Industry | F500 HQs | Revenue |
|---|---|---|
| Financial Services | 1 | $8B |
|
||
| Healthcare | 1 | $5B |
|
||
Price history
-20.0% since first listed2 events — show timeline
- 2026-06-05 Listed $200,000 VMLS
- 2026-02-02 Listed $250,000 VMLS
Property tax history
+3.4%/yrLatest (2025): $646 · -2.5% YoY. Source: county tax records.
Cash-flow waterfall
monthlySold comps — $/sqft
last 12 mo · ≤1 miLoading sold comps…