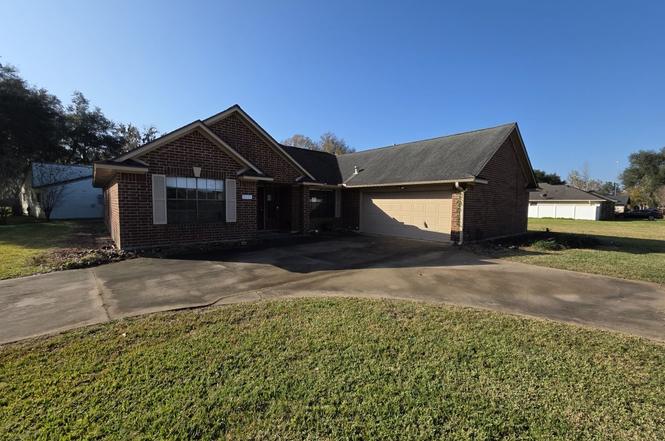
2571 Pinehurst Dr · West Columbia, TX
Flood risk 4/10 · Minor
- FEMA flood zone
- X
- Chance of flooding over 30 yrs
- 0.22%
- Est. flood insurance / yr
- $507 – $1,088
Fire risk 2/10 · Minimal
- Est. fire insurance / yr
- $1,222 – $2,270
Heat risk 9/10 · Severe
- Hot days now (above 110°F)
- 7 days/yr
- Hot days in 30 yrs
- 25 days/yr
Wind risk 9/10 · Severe
- Chance of severe wind over 30 yrs
- 99.0%
Air-quality risk 2/10 · Minimal
- Unhealthy air days now
- 2 days/yr
- Unhealthy air days in 30 yrs
- 2 days/yr
Risk factors via First Street. Map © Google.
Why this score? — see what drove the C+ grade
The composite is a weighted blend of 9 inputs, each scored 0–100. Each bar is that input's sub-score; the figure is the points it added to the 100-point composite (weight × sub-score).
- Cash flow +17.9/30.0
- ARV discount +15.0/15.0
- Appreciation +8.8/10.0
- 1% rule +5.8/10.0
- DSCR +5.6/10.0
- Livability +3.5/5.0
- Schools +3.0/10.0
- Rent growth +2.5/5.0
- Condition / age +2.5/5.0
$249,000
🖨 Deal sheet 📄 Offer letter ✓ Due diligence
Listing remarks MLS
Lovely home in beautiful Columbia Lakes. Home has been taken care of by seller. North to South placement with Solar Screen East and West for energy conservation. Kitchen was remodeled and new flooring replaced throughout in 2009. New roof in 2010. Heated Pool in 2012. Recent replacement of appliances in Kitchen, 2020 Bathroom remodels. All of this and a new HVAC in 2022. Big open area with room for lots of people!! Call today for an appointment!!!
Key facts
- 9,330 sq ft lot
- 2 garage spots
- Pool
Neighborhood map
What this means for you Summary
Snapshot
- This is a 3-bed/3.0-bath single-family listed at $249k.
Deal economics
- At list price, monthly cash flow is $210 ($3k/yr) — positive.
- The deal already cash-flows at list — no discount required.
- Meets the 1% rule at list price ($3k rent vs $249k).
- Recommended offer: $234k (6.0% below list) — sets the bar for market timing.
- Cap rate 7.3% vs local median 4.4% in West Columbia — top-decile yield for the area; either an underpriced asset or a hidden risk that comps aren't pricing in. Stress-test before assuming the spread holds.
Location & tenants
- Location reads 70/100 on livability (#375 in TX) — a middle-class / working-renter tenant base. Strengths: cost of living A+, housing A+, health & safety B+; Watch: amenities F, commute F.
- Columbia-Brazoria ISD (town): math 35% / reading 33% proficiency, ranked #513 of 826 in TX (top 62%) — families likely to look elsewhere, expect single-tenant / working-renter base with shorter leases.
- Zoned schools: West Columbia El (math 47% / reading 39%, grade F, #1,283 of 4,322 statewide, top 30%, 709 students, 60% FRL); West Brazos J H (math 34% / reading 32%, grade F, #930 of 1,662 statewide, top 57%, 676 students, 65% FRL); Columbia H S (math 13% / reading 28%, grade F, #1,389 of 1,632 statewide, top 86%, 889 students, 60% FRL).
- Market conditions: 145 active listings in the ZIP; 1 comparable units currently listed for rent nearby; 3,960 units permitted in Brazoria County in 2024 (593 in 5+ unit buildings).
Forward outlook
- In year one you build about $21k of equity ($2k loan paydown + $19k appreciation (7.6% local appreciation)).
- Brazoria County population projected at +44% by 2050 — long-run rental-demand tailwind backs the buy-and-hold thesis.
- At projected returns (7.6% appreciation + 3.0% rent growth), your $70k cash investment doubles in ~3 years — after that, you're playing with house money.
- By year 2, paydown + projected appreciation supports a ~$33k cash-out refi (75% LTV) — recoverable capital for the next deal without selling this one.
Negotiation context
- It's been on market 85 days — a 6% lower offer ($234k) is reasonable based on typical stale-listing flexibility.
- 2 sale attempts since 3y ago; this cycle's ask has dropped $26k (9%) from the opening price — seller is motivated, your offer sets the floor, not the list.
Risks & watch-outs
- Climate carrying-cost: severe wind risk, 99% chance of damaging wind over 30y; extreme-heat days projected 7→25/yr by 2055 (HVAC capex compounding) — expect insurance premiums to compound above CPI over the hold.
Questions for the listing agent
- It's been on market 85 days. Have you received any prior offers? Is the seller open to a 6% concession, seller financing, or rate buy-down credit?
- What does the HOA fee cover, when was the last increase, and are there any pending special assessments or reserve-fund shortfalls?
- Why hasn't it sold? Are there any deal-killer items the seller is aware of (foundation, flood, title, zoning, code violations)?
- Is there a deadline driving the sale (1031 exchange, divorce, estate, relocation)? That informs how much negotiation room exists.
- Schools are D-rated, which usually means shorter tenancies and higher turnover. Who's the typical renter profile here, and what's been the actual vacancy rate?
- What's the average days-on-market for RENTAL listings here right now (not sales)? A rising rental-DOM trend means longer vacancies and softer asking-rent achievability than the comps imply.
- What's the recent tenant-quality profile in this submarket — average credit score on applications, eviction rate, late-payment / NSF rate, and stable-employment percentage? A property-management company in the area should have these aggregated.
- How much new for-sale + rental construction is in the pipeline within 1–3 miles? Heavy new supply typically softens prices + rents 12–24 months out; constrained supply supports both.
Investment metrics
- 1% rule
- 1.08% ✓
- Cap rate
- 7.31%
- Cash-on-cash
- 3.62%
- DSCR
- 1.16
- GRM
- 7.7
CMA / ARV
- ARV (on-the-fly)
- $341,211
- Comps found
- 12
Show comp detail 12 sales within ~0.75 mi
| Address | Dist | Beds/Ba | Sqft | Sold | Price | $/sf | Match |
|---|---|---|---|---|---|---|---|
| 2571 Pinehurst Dr | 0.00mi | 3/2.0 | 2,019 (0%) | 1mo | $249,000 | $123 | 95 |
| 229 N Amherst Dr | 0.17mi | 3/2.0 | 2,007 (-1%) | 3mo | $354,000 | $176 | 85 |
| 284 Mossy Meadow Dr | 0.25mi | 3/2.0 | 1,996 (-1%) | 2mo | $320,000 | $160 | 81 |
| 2280 Riveroaks Dr | 0.45mi | 3/2.0 | 1,885 (-7%) | 2mo | $399,999 | $212 | 62 |
| 214 Montclaire Dr | 0.53mi | 4/2.0 (+1) | 1,968 (-2%) | 1mo | $365,990 | $186 | 61 |
| 213 Woodhaven | 0.33mi | 4/2.5 (+1) | 2,219 (+10%) | 3mo | $369,990 | $167 | 58 |
| 10 Green Meadows Ln | 0.47mi | 3/2.0 | 1,832 (-9%) | 3mo | $325,000 | $177 | 56 |
| 241 Woodhaven Dr | 0.35mi | 3/2.0 | 1,735 (-14%) | 2mo | $292,900 | $169 | 55 |
| 429 N Amherst Dr | 0.49mi | 3/2.0 | 1,778 (-12%) | 1mo | $276,500 | $156 | 52 |
| 2337 Shalmar Dr | 0.39mi | 4/2.0 (+1) | 1,801 (-11%) | 3mo | $335,000 | $186 | 52 |
| 212 Forest Park Dr | 0.59mi | 4/2.0 (+1) | 1,878 (-7%) | 3mo | $299,990 | $160 | 50 |
| 418 Twin Lakes Blvd W | 0.68mi | 3/2.0 | 1,863 (-8%) | 4mo | $289,000 | $155 | 48 |
Match score weights: distance 35% · size 25% · config 20% · recency 20%. Top-matched comps best support the ARV.
Projected returns pro-forma
7.63% appreciation · 3.0% rent growth · sell at horizon
- IRR
- 22.0%
- Equity multiple
- 2.58×
- Total profit
- $110,269
- Equity at exit
- $182,922
- IRR
- 20.3%
- Equity multiple
- 5.45×
- Total profit
- $310,231
- Equity at exit
- $357,294
Cash invested: $69,720 (down + closing). Projections, not guarantees.
Landlord ↔ Tenant lean methodology
- Overall (STATE)
- 87 Strongly Landlord-Friendly
- State Texas
- 87 Strongly Landlord-Friendly · R+5
- County
- — inherits STATE
- City
- — inherits STATE
ZIP-level market 77486
- Home prices YoY
- 2.4%
- Active inventory
- 145
- Price-to-rent
- 7.7×
Monthly cashflow live
- Estimated rent
- $2,700 medium interval (Pro) →
- Mortgage (P&I)
- −$1,306
- Tax from tax record
- −$463 /mo · $5,556/yr
- Insurance
- −$104
- HOA
- −$50
- Vacancy / Maint / Mgmt
- −$567
- Net cashflow
- $210
Break-even live
UW: 25.0% down · 7.5% · 30yr · 1.5% tax · 5.0% vac · 8.0% maint · 8.0% mgmt
Financing live
Cash to close
- Down payment
- $62,250
- Closing costs
- $7,470
- Reserves months
- —
- Total cash needed
- —
Loan-product check · same deal, 3 products live
Conventional
25% down · 7.5% · 30yr
- Down + closing
- —
- Monthly P&I
- —
- Monthly cashflow
- —
- DSCR
- —
- Eligible?
- —
Personal DTI + credit; lowest rate.
DSCR
20% down · 8.5% · 30yr
- Down + closing
- —
- Monthly P&I
- —
- Monthly cashflow
- —
- DSCR
- —
- Eligible?
- —
No personal income docs; deal must DSCR.
Hard money
10% down · 12.0% · 12mo
- Down + closing
- —
- Monthly P&I
- —
- Monthly cashflow
- —
- DSCR
- —
- Eligible?
- —
Short-term bridge; refi at stabilization.
Rent comps 1 comps
| Address | Beds | Baths | Sqft | Rent | $/sqft | DOM | Units | Dist |
|---|---|---|---|---|---|---|---|---|
| 2363 Ridgewood Dr West Columbia, TX | 4.0 | 2.5 | 2555 | $2,700 | $1.06 | 24d | 1 | 0.39mi |
HOA detail
- Monthly dues
- $50 · $600/yr
- Likely covers
- pool
Listing history 9 events
-
2026-04-08status Pending
-
2026-03-19price $249,000
-
2026-02-18price $262,000
-
2026-01-13$275,000 Active
-
2023-10-17soldstatus
-
2023-10-16soldstatus Sold 457-char remark
Show marketing remark (457 chars)
Lovely home in beautiful Columbia Lakes. Home has been taken care of by seller. North to South placement with Solar Screen East and West for energy conservation. Kitchen was remodeled and new flooring replaced throughout in 2009. New roof in 2010. Heated Pool in 2012. Recent replacement of appliances in Kitchen, 2020 Bathroom remodels. All of this and a new HVAC in 2022. Big open area with room for lots of people!! Call today for an appointment!!!
-
2023-09-23status Pending 457-char remark
Show marketing remark (457 chars)
Lovely home in beautiful Columbia Lakes. Home has been taken care of by seller. North to South placement with Solar Screen East and West for energy conservation. Kitchen was remodeled and new flooring replaced throughout in 2009. New roof in 2010. Heated Pool in 2012. Recent replacement of appliances in Kitchen, 2020 Bathroom remodels. All of this and a new HVAC in 2022. Big open area with room for lots of people!! Call today for an appointment!!!
-
2023-09-14status Option Pending 457-char remark
Show marketing remark (457 chars)
Lovely home in beautiful Columbia Lakes. Home has been taken care of by seller. North to South placement with Solar Screen East and West for energy conservation. Kitchen was remodeled and new flooring replaced throughout in 2009. New roof in 2010. Heated Pool in 2012. Recent replacement of appliances in Kitchen, 2020 Bathroom remodels. All of this and a new HVAC in 2022. Big open area with room for lots of people!! Call today for an appointment!!!
-
2023-08-09$329,900 Active 457-char remark
Show marketing remark (457 chars)
Lovely home in beautiful Columbia Lakes. Home has been taken care of by seller. North to South placement with Solar Screen East and West for energy conservation. Kitchen was remodeled and new flooring replaced throughout in 2009. New roof in 2010. Heated Pool in 2012. Recent replacement of appliances in Kitchen, 2020 Bathroom remodels. All of this and a new HVAC in 2022. Big open area with room for lots of people!! Call today for an appointment!!!
ⓘ Source: listings_history table (triggers on properties + properties_extension) + one-shot
backfill from property_details.listing_events for pre-trigger history.
Tax reassessment forecast TX · Resets to sale price
- Current annual tax
- $5,556 · $463/mo
- Projected year-2 tax
- $5,556 · $463/mo
- Expected delta
- $0/yr ($0/mo · 0.0%)
ⓘ Screening estimate from a state-policy table — verify with the county assessor before closing.
Climate risk First Street
- Flood 4/10 Moderate FEMA zone X · 22% chance over 30 yrs
- Wildfire 2/10 Low
- Heat 9/10 Extreme 7 d/yr ≥110°F today · 25 d/yr by 30 yrs out
- Wind 9/10 Extreme 99% chance of damaging wind over 30 yrs
- Air quality 2/10 Low 2 unhealthy d/yr today · 2 by 30 yrs out
Nearby sold comps map
Loading sold comps map…
Walkable amenities ~0.75 mi
Loading nearby amenities…
Taxation est. · year 1
- Rental income
- $32,400
- − Mortgage interest
- −$13,948
- − Property taxes
- −$5,556
- − Insurance
- −$1,245
- − Repairs & maintenance
- −$2,592
- − Management
- −$2,592
- − HOA
- −$600
- − Depreciation
- −$7,244
- Taxable loss
- −$1,376
- Est. tax savings @ 24.0%
- +$330
- After-tax cash flow
- $2,856/yr
For passive investors: Depreciation is non-cash, so a rental often shows a tax loss while cash-flowing — sheltering income. Rental losses are passive: they offset passive income freely, and up to $25,000/yr can offset ordinary (W-2) income if you actively participate and your MAGI is under $100k (phasing out to $0 by $150k); unused losses carry forward. On sale, claimed depreciation is recaptured at up to 25%, and gains may owe capital-gains tax (a 1031 exchange can defer both). Figures are a year-1 estimate at your 24.0% rate — not tax advice; consult a CPA.
Schools (NCES district)
- District
- Columbia-Brazoria ISD
- NCES district ID
- 4814670
- Math proficiency
- 35% ▼ -4.00%
- Reading proficiency
- 33% ▼ -1.00%
- Median HH income
- $57,256
- Composite
- 30.23/100
- National rank
- #6297
- State rank
- #513 of 826 in TX
Livability — West Columbia
- Score
- 70/100
- State rank
- #375
- US rank
- #7954
Category grades
Schools grade is shown separately in the Schools card above.
Census & demographics
- Population (ZIP)
- 7,330
Population outlook (Brazoria County) Hauer SSP2
- Today (2025)
- 420,414 people
- By 2030
- 457,585 · +8.8%
- By 2040
- 532,232 · +26.6%
- By 2050
- 605,399 · +44.0%
- By 2075
- 779,358 · +85.4%
- By 2100
- 883,759 · +110.2%
Race, ethnicity, and origin ACS 2023
- Neighborhood character
- Majority White (61%)
- Race & ethnicity
- White 61% Hispanic / Latino 27% Two or more races 13% Black 10% Native American 1%
- Hispanic origin (detail)
- Mexican 23%
- Common ancestry
- Italian 5% Slovak 3% Lithuanian 2%
- Foreign-born
- 5% · Canada
- Languages at home
- 86% English-only · Spanish 12% German/W. Germanic 1%
Political lean MEDSL · Brazoria
- 2024 margin
- R (+19.7) · D 39.5% · R 59.2% · Other 1.3%
- 2008→2024 swing
- +9.9pp toward D · 2008: -29.6pp · 2024: -19.7pp
- All cycles
- 2024: R+19.7 2020: R+18.2 2016: R+24.6 2012: R+34.2 2008: R+29.6
Not yet ingested
- Civics
- —
Market trends
- HPI YoY
- ▲ 7.63%
- Current HPI
- 320.7967
- Rent YoY
- —
- Metro
- —
- State GDP YoY
- ▲ 3.95%
- F500 in state
- 110
Industry mix (Fortune 500 HQ in TX)
| Industry | F500 HQs | Revenue |
|---|---|---|
| Energy | 16 | $1,198B |
|
||
| Technology | 5 | $198B |
|
||
| Engineering / Construction | 4 | $72B |
|
||
| Energy Services | 3 | $60B |
|
||
| Utilities | 3 | $41B |
|
||
| Healthcare | 2 | $330B |
|
||
Price history
-24.5% since first listed9 events — show timeline
- 2026-04-08 Pending — HARMLS
- 2026-03-19 Price Changed $249,000 HARMLS
- 2026-02-18 Price Changed $262,000 HARMLS
- 2026-01-13 Listed $275,000 HARMLS
- 2023-10-17 Sold (Public Records) — Public Records
- 2023-10-16 Sold (MLS) — HARMLS
- 2023-09-23 Pending — HARMLS
- 2023-09-14 Pending — HARMLS
- 2023-08-09 Listed $329,900 HARMLS
Property tax history
+1.9%/yrLatest (2025): $5,556 · -5.4% YoY. Source: county tax records.
Cash-flow waterfall
monthlySold comps — $/sqft
last 12 mo · ≤1 miLoading sold comps…