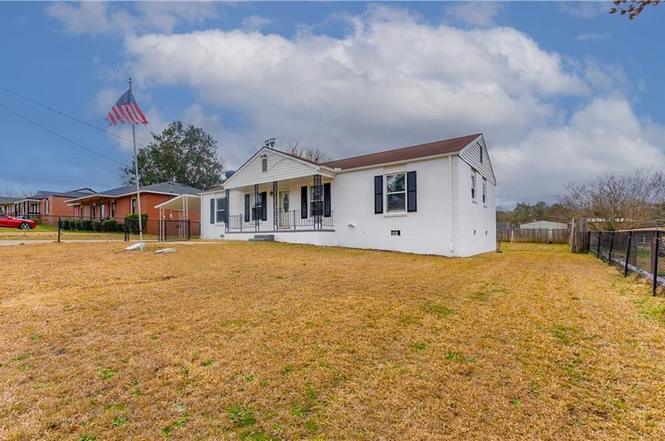
1609 7th St S · Phenix City, AL
Flood risk 1/10 · Minimal
- FEMA flood zone
- X (unshaded)
- Chance of flooding over 30 yrs
- 0.0%
- Est. flood insurance / yr
- $507 – $1,088
Fire risk 4/10 · Minor
- Est. fire insurance / yr
- $916 – $1,700
Heat risk 7/10 · Major
- Hot days now (above 108°F)
- 7 days/yr
- Hot days in 30 yrs
- 20 days/yr
Wind risk 6/10 · Moderate
- Chance of severe wind over 30 yrs
- 76.0%
Air-quality risk 4/10 · Minor
- Unhealthy air days now
- 4 days/yr
- Unhealthy air days in 30 yrs
- 5 days/yr
Risk factors via First Street. Map © Google.
Why this score? — see what drove the D+ grade
The composite is a weighted blend of 9 inputs, each scored 0–100. Each bar is that input's sub-score; the figure is the points it added to the 100-point composite (weight × sub-score).
- Cash flow +23.0/30.0
- DSCR +7.4/10.0
- 1% rule +5.4/10.0
- Livability +3.0/5.0
- Schools +2.7/10.0
- Rent growth +2.6/5.0
- ARV discount +2.5/15.0
- Condition / age +2.5/5.0
- Appreciation +0.0/10.0
$174,900
🖨 Deal sheet (PDF) 📄 Offer letter ✓ Due diligence
Listing remarks MLS
Property is owned by The US Dept of HUD Case #011-645802 Info & Disclosures found at HudHomeStore.com Home is sold as is and no repairs are allowed prior to closing. Home is Insured W/ Escrow subject to appraisal. Seller makes no representation or warranties as to property condition. HUD Homes are sold "As Is". EHO. Earnest Money must be a Cashier Check or Money Order made out to Listing Broker. Seller may contribute 3% CC upon request. Built in 1970 Pre 1978 Properties to include LBP notice Property is owned by the US Dept of HUD. Case Number is 011-645802 Property is Insured W/ Escrow under FHA standards and subject to appraisal. Earnest Money must be Cashier's Check or Money Order made out to Listing Broker. Seller may contribute up to 3% for buyers closing cost upon buyer's request. HUD Homes are sold "As Is" and no repairs are allowed prior to closing. Built in 1970. 3 bed 2.5 bat
Key facts
- Built 1970
- Listed 40 days
Tags
Neighborhood map
What this means for you Summary
Snapshot
- This is a 4-bed/1.0-bath single-family listed at $175k.
Deal economics
- At list price, monthly cash flow is $312 ($4k/yr) — positive.
- The deal already cash-flows at list — no discount required.
- Meets the 1% rule at list price ($2k rent vs $175k).
- Recommended offer: $170k (3.0% below list) — sets the bar for market timing.
- Cap rate 8.4% vs local median 5.0% in Phenix City — top-decile yield for the area; either an underpriced asset or a hidden risk that comps aren't pricing in. Stress-test before assuming the spread holds.
Location & tenants
- Location reads 60/100 on livability (#297 in AL) — a middle-class / working-renter tenant base. Strengths: cost of living A+, housing A+; Watch: schools D+, crime F, amenities F.
- Phenix City (suburban): math 22% / reading 44% proficiency, ranked #59 of 129 in AL (top 46%) — families likely to look elsewhere, expect single-tenant / working-renter base with shorter leases; 64% free/reduced lunch — lower-income household profile, screen leases tightly.
- Market conditions: Rents flat; 107 active listings in the ZIP; 2 comparable units currently listed for rent nearby; 183 units permitted in Russell County in 2024 (0 in 5+ unit buildings).
- This rent runs 43% of the median local income ($50k/yr) — at the standard rent-burdened threshold; future hikes will face affordability resistance.
Forward outlook
- Local home prices are declining (-3.0%/yr); year-one equity from $1k of loan paydown is wiped out by about $5k of value loss. Plan a longer hold.
- Russell County population projected at +42% by 2050 — long-run rental-demand tailwind backs the buy-and-hold thesis.
Negotiation context
- It's been on market 40 days — a 3% lower offer ($170k) is reasonable based on typical stale-listing flexibility.
- 4 sale attempts since 7y ago with the ask held roughly flat each time — persistent listings suggest the price (not the market) is what's stuck; bring a comps-based counter.
- Current owner paid $63k; list at $175k implies a 177% gain — meaningful room to come down on a strong offer.
Risks & watch-outs
- Climate carrying-cost: major wind risk, 76% chance of damaging wind over 30y; extreme-heat days projected 7→20/yr by 2055 (HVAC capex compounding) — expect insurance premiums to compound above CPI over the hold.
Questions for the listing agent
- It's been on market 40 days. Have you received any prior offers? Is the seller open to a 3% concession, seller financing, or rate buy-down credit?
- Built in 1970 — when were the roof, HVAC, electrical panel, plumbing, and water heater last replaced?
- Is there a deadline driving the sale (1031 exchange, divorce, estate, relocation)? That informs how much negotiation room exists.
- Schools are D-rated, which usually means shorter tenancies and higher turnover. Who's the typical renter profile here, and what's been the actual vacancy rate?
- Crime grade is F in this area — have there been break-ins, vandalism, or insurance claims at this property in the last 3 years? What carrier currently insures it and at what premium?
- The area grade is low — what's the realistic commute time and amenity access for the typical tenant pool here? Any planned neighborhood developments (good or bad) we should know about?
- What's the average days-on-market for RENTAL listings here right now (not sales)? A rising rental-DOM trend means longer vacancies and softer asking-rent achievability than the comps imply.
- What's the recent tenant-quality profile in this submarket — average credit score on applications, eviction rate, late-payment / NSF rate, and stable-employment percentage? A property-management company in the area should have these aggregated.
- How much new for-sale + rental construction is in the pipeline within 1–3 miles? Heavy new supply typically softens prices + rents 12–24 months out; constrained supply supports both.
Investment metrics
- 1% rule
- 1.04% ✓
- Cap rate
- 8.43%
- Cash-on-cash
- 7.64%
- DSCR
- 1.34
- GRM
- 8.0
CMA / ARV
- ARV (on-the-fly)
- $157,410
- Comps found
- 8
Show comp detail 8 sales within ~0.75 mi
| Address | Dist | Beds/Ba | Sqft | Sold | Price | $/sf | Match |
|---|---|---|---|---|---|---|---|
| 1110 16th Ct S | 0.29mi | 3/2.0 (-1) | 1,394 (-3%) | 1mo | $158,605 | $114 | 72 |
| 1703 Ridgecrest Dr | 0.42mi | 4/2.0 | 1,456 (+2%) | 4mo | $222,500 | $153 | 70 |
| 802 17th Ave S | 0.11mi | 3/2.0 (-1) | 1,416 (-1%) | 20mo | $137,000 | $97 | 68 |
| 1605 7th St S | 0.03mi | 4/2.0 | 1,269 (-11%) | 20mo | $174,000 | $137 | 59 |
| 1718 Epworth St | 0.27mi | 3/2.0 (-1) | 1,404 (-2%) | 20mo | $154,000 | $110 | 59 |
| 709 9th Ave S | 0.75mi | 3/2.0 (-1) | 1,426 (-0%) | 16mo | $119,700 | $84 | 42 |
| 1301 8th St South | 0.52mi | 3/2.0 (-1) | 1,640 (+15%) | 5mo | $165,000 | $101 | 38 |
| 1616 Ridgecrest Dr | 0.43mi | 3/2.0 (-1) | 1,612 (+13%) | 23mo | $155,000 | $96 | 30 |
Match score weights: distance 35% · size 25% · config 20% · recency 20%. Top-matched comps best support the ARV.
Projected returns pro-forma
-3.0% appreciation · 0.43% rent growth · sell at horizon
- IRR
- -7.4%
- Equity multiple
- 0.73×
- Total profit
- $-13,087
- Equity at exit
- $26,078
- IRR
- -1.3%
- Equity multiple
- 0.92×
- Total profit
- $-3,746
- Equity at exit
- $15,122
Cash invested: $48,972 (down + closing). Projections, not guarantees.
Landlord ↔ Tenant lean methodology
- Overall (STATE)
- 90 Strongly Landlord-Friendly
- State Alabama
- 90 Strongly Landlord-Friendly · R+15
- County
- — inherits STATE
- City
- — inherits STATE
ZIP-level market 36869
- Home prices YoY
- -22.2%
- Rents YoY
- 0.4%
- Active inventory
- 107
- Price-to-rent
- 8.0×
Monthly cashflow live
- Estimated rent
- $1,811 medium interval (Pro) →
- Mortgage (P&I)
- −$917
- Tax from tax record
- −$129 /mo · $1,546/yr
- Insurance
- −$73
- HOA
- −$0
- Vacancy / Maint / Mgmt
- −$380
- Net cashflow
- $312
Break-even live
Sensitivity live
| Price | -10% $411 | -5% $361 | +0% $312 | +5% $262 | +10% $213 |
|---|---|---|---|---|---|
| Rent | -10% $169 | -5% $240 | +0% $312 | +5% $383 | +10% $455 |
| Rate | -1.0pp $400 | -0.5pp $356 | base $312 | +0.5pp $266 | +1.0pp $220 |
UW: 25.0% down · 7.5% · 30yr · 1.5% tax · 5.0% vac · 8.0% maint · 8.0% mgmt
Financing live
Cash to close
- Down payment
- $43,725
- Closing costs
- $5,247
- Reserves months
- —
- Total cash needed
- —
Loan-product check · same deal, 3 products live
Conventional
25% down · 7.5% · 30yr
- Down + closing
- —
- Monthly P&I
- —
- Monthly cashflow
- —
- DSCR
- —
- Eligible?
- —
Personal DTI + credit; lowest rate.
DSCR
20% down · 8.5% · 30yr
- Down + closing
- —
- Monthly P&I
- —
- Monthly cashflow
- —
- DSCR
- —
- Eligible?
- —
No personal income docs; deal must DSCR.
Hard money
10% down · 12.0% · 12mo
- Down + closing
- —
- Monthly P&I
- —
- Monthly cashflow
- —
- DSCR
- —
- Eligible?
- —
Short-term bridge; refi at stabilization.
Rent comps 2 comps
| Address | Beds | Baths | Sqft | Rent | $/sqft | DOM | Units | Dist |
|---|---|---|---|---|---|---|---|---|
| 14 Brentwood Dr Phenix City, AL | 4.0 | 2.0 | 1718 | $1,795 | $1.04 | 14d | 1 | 1.11mi |
| 414 21st Ave Phenix City, AL | 3.0 | 1.0 | 1080 | $1,250 | $1.16 | 14d | 1 | 1.45mi |
Listing history 10 events
-
2025-04-24status Pending
-
2025-04-10price $174,900
-
2025-04-03status Active
-
2025-03-25status Pending
-
2025-03-06$179,900 Active
-
2020-07-23soldstatus $63,200 924-char remark
Show marketing remark (512 chars)
Property is owned by The US Dept of HUD Case #011-645802 Info & Disclosures found at HudHomeStore.com Home is sold as is and no repairs are allowed prior to closing. Home is Insured W/ Escrow subject to appraisal. Seller makes no representation or warranties as to property condition. HUD Homes are sold "As Is". EHO. Earnest Money must be a Cashier Check or Money Order made out to Listing Broker. Seller may contribute 3% CC upon request. Built in 1970 Pre 1978 Properties to include LBP notice
-
2020-07-23soldstatus $63,200 512-char remark
Show marketing remark (512 chars)
Property is owned by The US Dept of HUD Case #011-645802 Info & Disclosures found at HudHomeStore.com Home is sold as is and no repairs are allowed prior to closing. Home is Insured W/ Escrow subject to appraisal. Seller makes no representation or warranties as to property condition. HUD Homes are sold "As Is". EHO. Earnest Money must be a Cashier Check or Money Order made out to Listing Broker. Seller may contribute 3% CC upon request. Built in 1970 Pre 1978 Properties to include LBP notice
-
2019-12-13$63,200 924-char remark
Show marketing remark (512 chars)
Property is owned by The US Dept of HUD Case #011-645802 Info & Disclosures found at HudHomeStore.com Home is sold as is and no repairs are allowed prior to closing. Home is Insured W/ Escrow subject to appraisal. Seller makes no representation or warranties as to property condition. HUD Homes are sold "As Is". EHO. Earnest Money must be a Cashier Check or Money Order made out to Listing Broker. Seller may contribute 3% CC upon request. Built in 1970 Pre 1978 Properties to include LBP notice
-
2019-12-13$63,200 512-char remark
Show marketing remark (512 chars)
Property is owned by The US Dept of HUD Case #011-645802 Info & Disclosures found at HudHomeStore.com Home is sold as is and no repairs are allowed prior to closing. Home is Insured W/ Escrow subject to appraisal. Seller makes no representation or warranties as to property condition. HUD Homes are sold "As Is". EHO. Earnest Money must be a Cashier Check or Money Order made out to Listing Broker. Seller may contribute 3% CC upon request. Built in 1970 Pre 1978 Properties to include LBP notice
-
2005-06-09soldstatus $85,395
ⓘ Source: listings_history table (triggers on properties + properties_extension) + one-shot
backfill from property_details.listing_events for pre-trigger history.
Tax reassessment forecast AL · Resets to sale price
- Current annual tax
- $1,546 · $129/mo
- Projected year-2 tax
- $1,546 · $129/mo
- Expected delta
- $0/yr ($0/mo · 0.0%)
ⓘ Screening estimate from a state-policy table — verify with the county assessor before closing.
Climate risk First Street
- Flood 1/10 Low FEMA zone X (unshaded) · 0% chance over 30 yrs
- Wildfire 4/10 Moderate
- Heat 7/10 Severe 7 d/yr ≥108°F today · 20 d/yr by 30 yrs out
- Wind 6/10 Major 76% chance of damaging wind over 30 yrs
- Air quality 4/10 Moderate 4 unhealthy d/yr today · 5 by 30 yrs out
Nearby sold comps map
Loading sold comps map…
Walkable amenities ~0.75 mi
Loading nearby amenities…
Taxation est. · year 1
- Rental income
- $21,729
- − Mortgage interest
- −$9,797
- − Property taxes
- −$1,546
- − Insurance
- −$874
- − Repairs & maintenance
- −$1,738
- − Management
- −$1,738
- − Depreciation
- −$5,088
- Taxable income
- $947
- Est. tax owed @ 24.0%
- −$227
- After-tax cash flow
- $3,512/yr
For passive investors: Depreciation is non-cash, so a rental often shows a tax loss while cash-flowing — sheltering income. Rental losses are passive: they offset passive income freely, and up to $25,000/yr can offset ordinary (W-2) income if you actively participate and your MAGI is under $100k (phasing out to $0 by $150k); unused losses carry forward. On sale, claimed depreciation is recaptured at up to 25%, and gains may owe capital-gains tax (a 1031 exchange can defer both). Figures are a year-1 estimate at your 24.0% rate — not tax advice; consult a CPA.
Schools (NCES district)
- District
- Phenix City
- NCES district ID
- 0102700
- Math proficiency
- 22% ▼ -24.00%
- Reading proficiency
- 44% ▼ -1.00%
- Median HH income
- $36,228
- Composite
- 27.29/100
- National rank
- #7001
- State rank
- #59 of 129 in AL
Livability — Phenix City
- Score
- 60/100
- State rank
- #297
- US rank
- #19037
Category grades
Schools grade is shown separately in the Schools card above.
Census & demographics
- Census place
- Phenix City, AL
- County
- Russell County · 53,055 people
- City population
- 62,290
- Metro
- Columbus, GA-AL
- Population (ZIP)
- 21,518
- Household income
- $50,061
- Rent vs Own
- Severe rent burden
- 789.0
Population outlook (Russell County) Hauer SSP2
- Today (2025)
- 70,137 people
- By 2030
- 75,826 · +8.1%
- By 2040
- 87,858 · +25.3%
- By 2050
- 99,721 · +42.2%
- By 2075
- 128,009 · +82.5%
- By 2100
- 149,251 · +112.8%
Race, ethnicity, and origin ACS 2023
- Neighborhood character
- Diverse neighborhood (Simpson 0.58)
- Race & ethnicity
- Black 50% White 41% Hispanic / Latino 5% Two or more races 4%
- Common ancestry
- Slovak 1% Lithuanian 1% Portuguese 1%
- Foreign-born
- 3% · Canada
- Languages at home
- 95% English-only · Spanish 4%
Political lean MEDSL · Russell
- 2024 margin
- Toss-up / Even · D 50.4% · R 48.7%
- 2008→2024 swing
- -5.6pp toward R · 2008: 7.3pp · 2024: 1.7pp
- All cycles
- 2024: D+1.7 2020: D+6.4 2016: D+1.9 2012: D+11.8 2008: D+7.3
Not yet ingested
- Civics
- —
Market trends
- HPI YoY
- ▼ -47.69%
- Current HPI
- 166.9094
- Rent YoY
- ▲ 0.43%
- Metro
- Columbus, GA-AL
- State GDP YoY
- ▲ 2.94%
- F500 in state
- 4
Industry mix (Fortune 500 HQ in AL)
| Industry | F500 HQs | Revenue |
|---|---|---|
| Financial Services | 1 | $8B |
|
||
| Healthcare | 1 | $5B |
|
||
Price history
+104.8% since first listed10 events — show timeline
- 2025-04-24 Pending — EABOR
- 2025-04-10 Price Changed $174,900 EABOR
- 2025-04-03 Relisted — EABOR
- 2025-03-25 Pending — EABOR
- 2025-03-06 Listed $179,900 EABOR
- 2020-07-23 Sold (MLS) $63,200 EABOR
- 2020-07-23 Sold (MLS) $63,200 EABOR
- 2019-12-13 Listed $63,200 EABOR
- 2019-12-13 Listed $63,200 EABOR
- 2005-06-09 Sold (Public Records) $85,395 Public Records
Property tax history
+20.0%/yrLatest (2025): $1,546 · +0.0% YoY. Source: county tax records.
Cash-flow waterfall
monthlySold comps — $/sqft
last 12 mo · ≤1 miLoading sold comps…