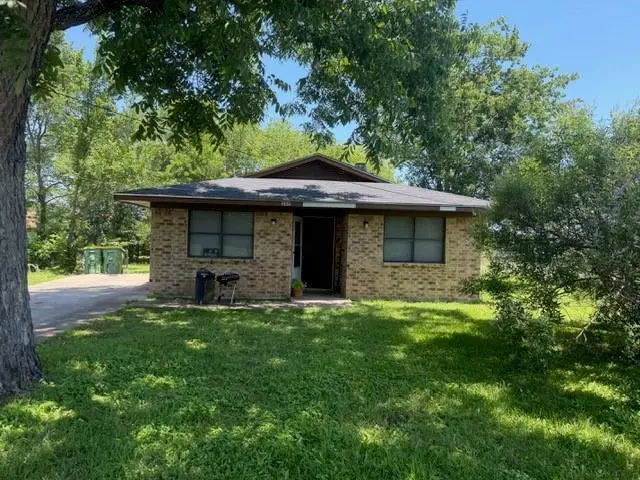
205 E Sabine St · Groesbeck, TX
Flood risk 1/10 · Minimal
- FEMA flood zone
- X (unshaded)
- Chance of flooding over 30 yrs
- 0.0%
- Est. flood insurance / yr
- $507 – $1,088
Fire risk 5/10 · Moderate
- Est. fire insurance / yr
- $1,222 – $2,270
Heat risk 7/10 · Major
- Hot days now (above 109°F)
- 7 days/yr
- Hot days in 30 yrs
- 25 days/yr
Wind risk 8/10 · Major
- Chance of severe wind over 30 yrs
- 80.0%
Air-quality risk 1/10 · Minimal
- Unhealthy air days now
- 0 days/yr
- Unhealthy air days in 30 yrs
- 0 days/yr
Risk factors via First Street. Map © Google.
Why this score? — see what drove the B- grade
The composite is a weighted blend of 9 inputs, each scored 0–100. Each bar is that input's sub-score; the figure is the points it added to the 100-point composite (weight × sub-score).
- Cash flow +30.0/30.0
- DSCR +10.0/10.0
- ARV discount +9.7/15.0
- 1% rule +9.1/10.0
- Livability +3.2/5.0
- Rent growth +2.5/5.0
- Schools +2.5/10.0
- Condition / age +2.5/5.0
- Appreciation +0.0/10.0
$80,000
🖨 Deal sheet (PDF) 📄 Offer letter ✓ Due diligence
Listing remarks
This 3 bedroom, 1 bath brick home offers a convenient location close to schools and town amenities. This home is a great opportunity for new homeowners or investors alike with plenty of potential to make it your own.
Key facts
- Close to schools
- Town amenities
- Convenient location
Tags
Property features AI
Finance
- Other: Property listed as Active; possession at closing/funding
- Financial info: Accepting cash and conventional offers; Treat As Clear loan type; No second mortgage indicated
- HOA & community: No association
Exterior
- Parking: Driveway
- Security: No specific security features provided
- Utilities: City water; City sewer; No municipal utility district
- Home design: Single family residence (residential); Not attached
- Construction: Built in 1986
- Exterior features: Lot less than 0.5 acre (about 0.133 acres); City water; City sewer; Directions: From Groesbeck go north on Hwy 14, turn right onto Jacinto. After crossing the railroad tracks turn right onto Rusk Street, then left onto Sabine. The house is the 2nd on left.
Interior
- Kitchen: Other appliances
- Bedrooms: 3 bedrooms (primary bedroom on main level)
- Flooring: No flooring details provided
- Bathrooms: 1 full bathroom
- Heating & cooling: No heating or cooling details provided
- Interior features: One-level layout; Living area approximately 1,136; Living room; Dining area; Other interior features
- Laundry & utility: No specific laundry details provided
Neighborhood map
What this means for you Summary
Snapshot
- This is a 3-bed/1.0-bath single-family listed at $80k.
Deal economics
- At list price, monthly cash flow is $343 ($4k/yr) — positive.
- The deal already cash-flows at list — no discount required.
- Meets the 1% rule at list price ($1k rent vs $80k).
- Cap rate 11.4% vs local median 1.6% in Groesbeck — top-decile yield for the area; either an underpriced asset or a hidden risk that comps aren't pricing in. Stress-test before assuming the spread holds.
Location & tenants
- Location reads 64/100 on livability (#777 in TX) — a middle-class / working-renter tenant base. Strengths: cost of living A+, housing A+; Watch: amenities F, commute F, employment F.
- Groesbeck ISD (rural): math 28% / reading 31% proficiency, ranked #634 of 826 in TX (top 77%) — low school quality limits family demand, transient renter base, plan for 1-2y turnover.
- Zoned schools: H O Whitehurst El (math 37% / reading 32%, grade F, #1,995 of 4,322 statewide, top 50%, 501 students, 73% FRL); Groesbeck Middle (math 28% / reading 41%, grade F, #858 of 1,662 statewide, top 54%, 277 students, 70% FRL); Groesbeck H S (math 32% / reading 42%, grade F, #897 of 1,632 statewide, top 57%, 458 students, 57% FRL).
- Market conditions: 122 active listings in the ZIP; 4 comparable units currently listed for rent nearby; rentals at typical pace (median 23d on market — plan ~3-4 weeks tenant-placement turnaround); 17 units permitted in Limestone County in 2024 (0 in 5+ unit buildings).
Forward outlook
- Local home prices are declining (-3.0%/yr); year-one equity from $553 of loan paydown is wiped out by about $2k of value loss. Plan a longer hold.
- Limestone County population projected to shrink 4% by 2050 — rents likely to lag national; underwrite the cash flow, not the appreciation.
- At projected returns (-3.0% appreciation + 3.0% rent growth), your $22k cash investment doubles in ~7 years — after that, you're playing with house money.
Negotiation context
- Only 12 days on market — expect competitive offers; lowballing is unlikely to land.
Risks & watch-outs
- Climate carrying-cost: severe wind risk, 80% chance of damaging wind over 30y; moderate wildfire risk; extreme-heat days projected 7→25/yr by 2055 (HVAC capex compounding) — expect insurance premiums to compound above CPI over the hold.
Questions for the listing agent
- Is there a deadline driving the sale (1031 exchange, divorce, estate, relocation)? That informs how much negotiation room exists.
- Schools are F-rated, which usually means shorter tenancies and higher turnover. Who's the typical renter profile here, and what's been the actual vacancy rate?
- What's the average days-on-market for RENTAL listings here right now (not sales)? A rising rental-DOM trend means longer vacancies and softer asking-rent achievability than the comps imply.
- What's the recent tenant-quality profile in this submarket — average credit score on applications, eviction rate, late-payment / NSF rate, and stable-employment percentage? A property-management company in the area should have these aggregated.
- How much new for-sale + rental construction is in the pipeline within 1–3 miles? Heavy new supply typically softens prices + rents 12–24 months out; constrained supply supports both.
Investment metrics
- 1% rule
- 1.41% ✓
- Cap rate
- 11.44%
- Cash-on-cash
- 18.37%
- DSCR
- 1.82
- GRM
- 5.9
CMA / ARV
- ARV (on-the-fly)
- $84,064
- Comps found
- 12
Show comp detail 12 sales within ~0.75 mi
| Address | Dist | Beds/Ba | Sqft | Sold | Price | $/sf | Match |
|---|---|---|---|---|---|---|---|
| 110 E Angeline St | 0.10mi | 3/1.0 | 1,140 (+0%) | 4mo | $39,800 | $35 | 92 |
| 511 W Navasota St | 0.46mi | 3/1.0 | 1,242 (+9%) | 1mo | $92,500 | $74 | 62 |
| 709 W Navasota St | 0.58mi | 2/1.5 (-1) | 1,125 (-1%) | 3mo | $60,000 | $53 | 62 |
| 309 E State St | 0.26mi | 3/1.0 | 988 (-13%) | 8mo | $134,900 | $137 | 60 |
| 307 E State St | 0.25mi | 3/2.0 | 1,008 (-11%) | 8mo | $75,000 | $74 | 59 |
| 807 Henderson Blvd | 0.59mi | 3/2.0 | 1,170 (+3%) | 8mo | $160,000 | $137 | 57 |
| 801 W Navasota | 0.60mi | 3/1.0 | 1,206 (+6%) | 9mo | $70,000 | $58 | 54 |
| 510 S Waco St | 0.59mi | 2/1.0 (-1) | 1,056 (-7%) | 3mo | $145,000 | $137 | 53 |
| 801 W State St | 0.62mi | 2/2.0 (-1) | 1,104 (-3%) | 6mo | $69,000 | $63 | 52 |
| 609 W Navasota St | 0.52mi | 3/1.0 | 1,241 (+9%) | 11mo | $55,000 | $44 | 51 |
| 706 W Navasota St | 0.57mi | 2/1.0 (-1) | 1,243 (+9%) | 3mo | $139,900 | $113 | 50 |
| 207 N Archer St | 0.70mi | 2/1.0 (-1) | 1,304 (+15%) | 3mo | $162,960 | $125 | 35 |
Match score weights: distance 35% · size 25% · config 20% · recency 20%. Top-matched comps best support the ARV.
Projected returns pro-forma
-3.0% appreciation · 3.0% rent growth · sell at horizon
- IRR
- 10.0%
- Equity multiple
- 1.40×
- Total profit
- $8,883
- Equity at exit
- $11,928
- IRR
- 19.2%
- Equity multiple
- 2.60×
- Total profit
- $35,900
- Equity at exit
- $6,917
Cash invested: $22,400 (down + closing). Projections, not guarantees.
Landlord ↔ Tenant lean methodology
- Overall (STATE)
- 87 Strongly Landlord-Friendly
- State Texas
- 87 Strongly Landlord-Friendly · R+5
- County
- — inherits STATE
- City
- — inherits STATE
ZIP-level market 76642
- Home prices YoY
- -18.0%
- Active inventory
- 122
- Price-to-rent
- 5.9×
Monthly cashflow live
- Estimated rent
- $1,124 medium interval (Pro) →
- Mortgage (P&I)
- −$420
- Tax from tax record
- −$92 /mo · $1,110/yr
- Insurance
- −$33
- HOA
- −$0
- Vacancy / Maint / Mgmt
- −$236
- Net cashflow
- $343
Break-even live
Sensitivity live
| Price | -10% $388 | -5% $365 | +0% $343 | +5% $320 | +10% $298 |
|---|---|---|---|---|---|
| Rent | -10% $254 | -5% $298 | +0% $343 | +5% $387 | +10% $432 |
| Rate | -1.0pp $383 | -0.5pp $363 | base $343 | +0.5pp $322 | +1.0pp $301 |
UW: 25.0% down · 7.5% · 30yr · 1.5% tax · 5.0% vac · 8.0% maint · 8.0% mgmt
Financing live
Cash to close
- Down payment
- $20,000
- Closing costs
- $2,400
- Reserves months
- —
- Total cash needed
- —
Loan-product check · same deal, 3 products live
Conventional
25% down · 7.5% · 30yr
- Down + closing
- —
- Monthly P&I
- —
- Monthly cashflow
- —
- DSCR
- —
- Eligible?
- —
Personal DTI + credit; lowest rate.
DSCR
20% down · 8.5% · 30yr
- Down + closing
- —
- Monthly P&I
- —
- Monthly cashflow
- —
- DSCR
- —
- Eligible?
- —
No personal income docs; deal must DSCR.
Hard money
10% down · 12.0% · 12mo
- Down + closing
- —
- Monthly P&I
- —
- Monthly cashflow
- —
- DSCR
- —
- Eligible?
- —
Short-term bridge; refi at stabilization.
Rent comps 4 comps
| Address | Beds | Baths | Sqft | Rent | $/sqft | DOM | Units | Dist |
|---|---|---|---|---|---|---|---|---|
| 102 E State St Groesbeck, TX | 2.0 | 2.0 | 1100 | $1,300 | $1.18 | 15d | 1 | 0.29mi |
| 408 W Trinity St Groesbeck, TX | 2.0 | 1.0 | 1174 | $1,300 | $1.11 | 15d | 1 | 0.41mi |
| 706 W Sabine St Groesbeck, TX | 2.0 | 1.0 | 1020 | $695 | $0.68 | 22d | 1 | 0.55mi |
| 807 W Sabine St Groesbeck, TX | 2.0 | 1.0 | 720 | $795 | $1.10 | 22d | 1 | 0.66mi |
Listing history 10 events
-
2026-06-21days on market $80,000 Active 12 DOM
-
2026-06-21days on market $80,000 Active 11 DOM
-
2026-06-18days on market $80,000 Active 9 DOM
-
2026-06-17days on market $80,000 Active 8 DOM
-
2026-06-16days on market $80,000 Active 7 DOM
-
2026-06-15days on market $80,000 Active 6 DOM
-
2026-06-13days on market $80,000 Active 4 DOM
-
2026-06-12days on market $80,000 Active 3 DOM
-
2026-06-09remarks 216-char remark
-
2026-06-09$80,000 Active 1 DOM
ⓘ Source: listings_history table (triggers on properties + properties_extension) + one-shot
backfill from property_details.listing_events for pre-trigger history.
Tax reassessment forecast TX · Resets to sale price
- Current annual tax
- $1,110 · $92/mo
- Projected year-2 tax
- $1,464 · $122/mo
- Expected delta
- +$354/yr (+$30/mo · 31.9%)
ⓘ Screening estimate from a state-policy table — verify with the county assessor before closing.
Climate risk First Street
- Flood 1/10 Low FEMA zone X (unshaded) · 0% chance over 30 yrs
- Wildfire 5/10 Major
- Heat 7/10 Severe 7 d/yr ≥109°F today · 25 d/yr by 30 yrs out
- Wind 8/10 Severe 80% chance of damaging wind over 30 yrs
- Air quality 1/10 Low 0 unhealthy d/yr today · 0 by 30 yrs out
Nearby sold comps map
Loading sold comps map…
Walkable amenities ~0.75 mi
Loading nearby amenities…
Taxation est. · year 1
- Rental income
- $13,491
- − Mortgage interest
- −$4,481
- − Property taxes
- −$1,110
- − Insurance
- −$400
- − Repairs & maintenance
- −$1,079
- − Management
- −$1,079
- − Depreciation
- −$2,327
- Taxable income
- $3,014
- Est. tax owed @ 24.0%
- −$723
- After-tax cash flow
- $3,390/yr
For passive investors: Depreciation is non-cash, so a rental often shows a tax loss while cash-flowing — sheltering income. Rental losses are passive: they offset passive income freely, and up to $25,000/yr can offset ordinary (W-2) income if you actively participate and your MAGI is under $100k (phasing out to $0 by $150k); unused losses carry forward. On sale, claimed depreciation is recaptured at up to 25%, and gains may owe capital-gains tax (a 1031 exchange can defer both). Figures are a year-1 estimate at your 24.0% rate — not tax advice; consult a CPA.
Schools (NCES district)
- District
- Groesbeck ISD
- NCES district ID
- 4821810
- Math proficiency
- 28% ▼ -10.00%
- Reading proficiency
- 31% ▼ -9.00%
- Median HH income
- $44,929
- Composite
- 25.3/100
- National rank
- #7487
- State rank
- #634 of 826 in TX
Livability — Groesbeck
- Score
- 64/100
- State rank
- #777
- US rank
- #14137
Category grades
Schools grade is shown separately in the Schools card above.
Census & demographics
- Census place
- Groesbeck, TX
- Population (ZIP)
- 6,226
Population outlook (Limestone County) Hauer SSP2
- Today (2025)
- 23,396 people
- By 2030
- 23,214 · -0.8%
- By 2040
- 22,829 · -2.4%
- By 2050
- 22,516 · -3.8%
- By 2075
- 22,088 · -5.6%
- By 2100
- 20,354 · -13.0%
Race, ethnicity, and origin ACS 2023
- Neighborhood character
- Diverse neighborhood (Simpson 0.58)
- Race & ethnicity
- White 59% Black 22% Hispanic / Latino 16% Two or more races 13% Asian 1%
- Hispanic origin (detail)
- Mexican 14%
- Common ancestry
- Lithuanian 4% Slovak 2% Iranian 1%
- Foreign-born
- 7% · Canada, Vietnam
- Languages at home
- 88% English-only · Spanish 10% Vietnamese 1%
Political lean MEDSL · Limestone
- 2024 margin
- Solid R (+56.9) · D 21.2% · R 78.1%
- 2008→2024 swing
- -23.4pp toward R · 2008: -33.5pp · 2024: -56.9pp
- All cycles
- 2024: R+56.9 2020: R+50.3 2016: R+52.3 2012: R+40.7 2008: R+33.5
Not yet ingested
- Civics
- —
Market trends
- HPI YoY
- ▼ -41.70%
- Current HPI
- 190.097
- Rent YoY
- —
- Metro
- —
- State GDP YoY
- ▲ 3.95%
- F500 in state
- 110
Industry mix (Fortune 500 HQ in TX)
| Industry | F500 HQs | Revenue |
|---|---|---|
| Energy | 16 | $1,198B |
|
||
| Technology | 5 | $198B |
|
||
| Engineering / Construction | 4 | $72B |
|
||
| Energy Services | 3 | $60B |
|
||
| Utilities | 3 | $41B |
|
||
| Healthcare | 2 | $330B |
|
||
Price history
4 events — show timeline
- 2026-06-09 Listed $80,000 NTREIS
- 2006-02-03 Sold (Public Records) — Public Records
- 2004-04-21 Sold (Public Records) — Public Records
- 1983-05-25 Sold (Public Records) — Public Records
Property tax history
+1.3%/yrLatest (2025): $1,110 · +7.3% YoY. Source: county tax records.
Cash-flow waterfall
monthlySold comps — $/sqft
last 12 mo · ≤1 miLoading sold comps…