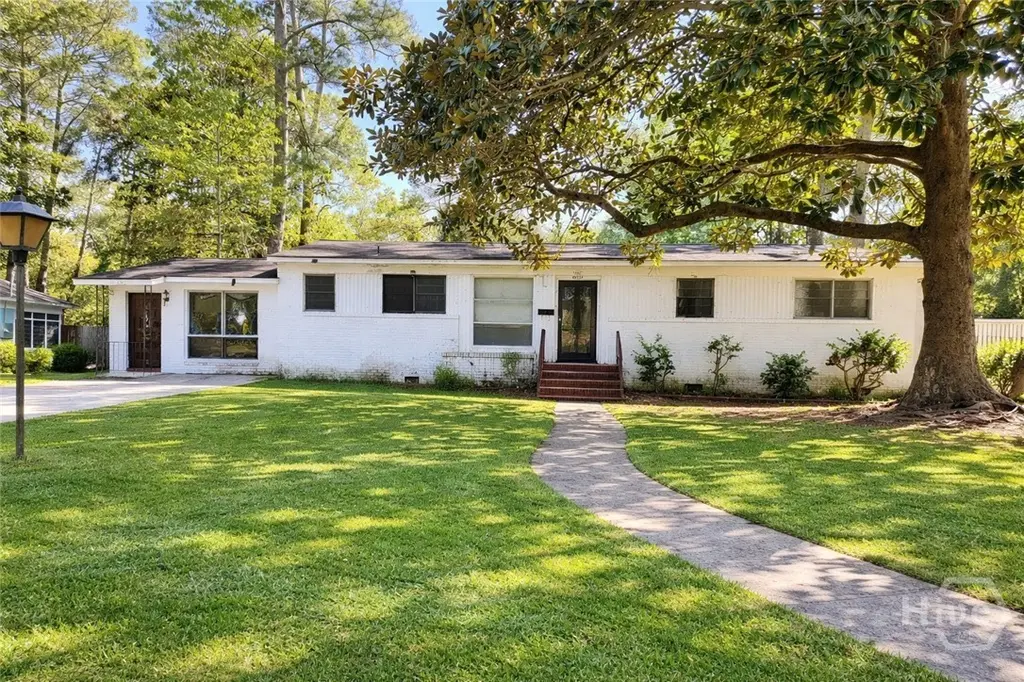
5442 Magnolia Ave · Savannah, GA
Flood risk 1/10 · Minimal
- FEMA flood zone
- X (unshaded)
- Chance of flooding over 30 yrs
- 0.0%
- Est. flood insurance / yr
- $507 – $1,088
Fire risk 1/10 · Minimal
- Est. fire insurance / yr
- $963 – $1,789
Heat risk 10/10 · Severe
- Hot days now (above 106°F)
- 7 days/yr
- Hot days in 30 yrs
- 18 days/yr
Wind risk 9/10 · Severe
- Chance of severe wind over 30 yrs
- 99.0%
Air-quality risk 2/10 · Minimal
- Unhealthy air days now
- 2 days/yr
- Unhealthy air days in 30 yrs
- 2 days/yr
Risk factors via First Street. Map © Google.
Why this score? — see what drove the C grade
The composite is a weighted blend of 9 inputs, each scored 0–100. Each bar is that input's sub-score; the figure is the points it added to the 100-point composite (weight × sub-score).
- Cash flow +19.8/30.0
- ARV discount +15.0/15.0
- DSCR +6.3/10.0
- 1% rule +4.8/10.0
- Livability +4.3/5.0
- Rent growth +2.5/5.0
- Condition / age +2.5/5.0
- Schools +2.0/10.0
- Appreciation +0.0/10.0
$249,000
🖨 Deal sheet 📄 Offer letter ✓ Due diligence
Listing remarks MLS
Great opportunity in the desirable Savannah magnolia Park location! This 3BR/2BA, one-story home offers approximately 2,109 sq ft and is ready for your vision and TLC. With a solid footprint, spacious layout, and established surroundings, this property is ideal for investors or buyers looking to add value. Conveniently located near Bacon Park and local amenities, the property benefits from strong area appeal and long-term potential. Whether you’re planning a flip, rental, or custom renovation, this is a chance to transform a property in a sought-after neighborhood. Sold as-is.
Key facts
- 0.26 acre lot
- Built 1953
- Listed 59 days
Neighborhood map
What this means for you Summary
Snapshot
- This is a 3-bed/2.0-bath single-family listed at $249k.
Deal economics
- At list price, monthly cash flow is $298 ($4k/yr) — positive.
- The deal already cash-flows at list — no discount required.
- To meet the 1% rule (rent ≥ 1% of price), the offer needs to be $245k (1.8% below list).
- Recommended offer: $242k (3.0% below list) — sets the bar for market timing.
- Cap rate 7.7% vs local median 4.0% in Savannah — top-decile yield for the area; either an underpriced asset or a hidden risk that comps aren't pricing in. Stress-test before assuming the spread holds.
Location & tenants
- Location reads 86/100 on livability (#1 in GA, #397 nationally) — a professional / high-income tenant draw. Strengths: crime A+, amenities A+, commute A+; Watch: employment D, schools F.
- Savannah-Chatham County (urban): math 20% / reading 26% proficiency, ranked #134 of 174 in GA (top 77%) — low school quality limits family demand, transient renter base, plan for 1-2y turnover.
- Market conditions: Rents flat; 176 active listings in the ZIP; 26 comparable units currently listed for rent nearby; rentals lingering (median 44d on market — plan ~5-8 weeks vacancy on turnover, expect pricing pressure); 50% of comp listings sitting > 30 days — soft ceiling on asking rent; 2,694 units permitted in Chatham County in 2024 (973 in 5+ unit buildings).
- This rent runs 44% of the median local income ($67k/yr) — at the standard rent-burdened threshold; future hikes will face affordability resistance.
Forward outlook
- Local home prices are declining (-3.0%/yr); year-one equity from $2k of loan paydown is wiped out by about $7k of value loss. Plan a longer hold.
- Chatham County population projected at +33% by 2050 — long-run rental-demand tailwind backs the buy-and-hold thesis.
Negotiation context
- It's been on market 59 days — a 3% lower offer ($242k) is reasonable based on typical stale-listing flexibility.
- Current owner paid $88k; list at $249k implies a 185% gain — meaningful room to come down on a strong offer.
Risks & watch-outs
- Watch-outs: built in 1953 — expect roof / HVAC / electrical / plumbing capex.
- Climate carrying-cost: severe wind risk, 99% chance of damaging wind over 30y; extreme-heat days projected 7→18/yr by 2055 (HVAC capex compounding) — expect insurance premiums to compound above CPI over the hold.
Questions for the listing agent
- It's been on market 59 days. Have you received any prior offers? Is the seller open to a 3% concession, seller financing, or rate buy-down credit?
- Built in 1953 — when were the roof, HVAC, electrical panel, plumbing, and water heater last replaced?
- Is there a deadline driving the sale (1031 exchange, divorce, estate, relocation)? That informs how much negotiation room exists.
- Schools are F-rated, which usually means shorter tenancies and higher turnover. Who's the typical renter profile here, and what's been the actual vacancy rate?
- What's the average days-on-market for RENTAL listings here right now (not sales)? A rising rental-DOM trend means longer vacancies and softer asking-rent achievability than the comps imply.
- What's the recent tenant-quality profile in this submarket — average credit score on applications, eviction rate, late-payment / NSF rate, and stable-employment percentage? A property-management company in the area should have these aggregated.
- How much new for-sale + rental construction is in the pipeline within 1–3 miles? Heavy new supply typically softens prices + rents 12–24 months out; constrained supply supports both.
Investment metrics
- 1% rule
- 0.98% ✗
- Cap rate
- 7.73%
- Cash-on-cash
- 5.14%
- DSCR
- 1.23
- GRM
- 8.5
CMA / ARV
- ARV (median comp)
- $378,051
- List price
- $249,000
- Delta
- -34.14%
- Verdict
- UNDERPRICED
- Comps
- 20 within 1.0 mi
Show comp detail 12 sales within ~0.75 mi
| Address | Dist | Beds/Ba | Sqft | Sold | Price | $/sf | Match |
|---|---|---|---|---|---|---|---|
| 5442 Magnolia Ave | 0.00mi | 3/2.0 | 2,109 (0%) | 1mo | $220,000 | $104 | 99 |
| 5507 Woodland Dr | 0.22mi | 3/2.0 | 2,216 (+5%) | 7mo | $655,000 | $296 | 76 |
| 1848 Cokesbury Dr | 0.15mi | 3/2.0 | 1,925 (-9%) | 5mo | $285,000 | $148 | 74 |
| 1844 Cokesbury Dr | 0.14mi | 4/2.5 (+1) | 2,278 (+8%) | 1mo | $440,000 | $193 | 72 |
| 1940 Speir St | 0.25mi | 4/2.0 (+1) | 1,920 (-9%) | 7mo | $350,000 | $182 | 63 |
| 2006 Cokesbury Dr | 0.32mi | 3/2.5 | 1,839 (-13%) | 3mo | $375,000 | $204 | 59 |
| 1321 Brightwood Dr | 0.45mi | 3/2.5 | 2,232 (+6%) | 11mo | $534,000 | $239 | 58 |
| 2221 Walz Dr | 0.46mi | 4/2.0 (+1) | 1,932 (-8%) | 6mo | $422,650 | $219 | 54 |
| 1316 Brightwood Dr | 0.47mi | 3/3.0 | 2,398 (+14%) | 5mo | $475,000 | $198 | 47 |
| 1221 E 68th St | 0.60mi | 4/3.0 (+1) | 2,000 (-5%) | 9mo | $413,000 | $207 | 47 |
| 1207 Bacon Park Dr | 0.72mi | 3/2.0 | 2,351 (+12%) | 4mo | $700,000 | $298 | 44 |
| 5410 Waters Dr | 0.68mi | 3/2.0 | 1,804 (-14%) | 5mo | $224,000 | $124 | 40 |
Match score weights: distance 35% · size 25% · config 20% · recency 20%. Top-matched comps best support the ARV.
Projected returns pro-forma
-3.0% appreciation · 0.04% rent growth · sell at horizon
- IRR
- -11.6%
- Equity multiple
- 0.59×
- Total profit
- $-28,432
- Equity at exit
- $37,127
- IRR
- -7.2%
- Equity multiple
- 0.60×
- Total profit
- $-27,713
- Equity at exit
- $21,529
Cash invested: $69,720 (down + closing). Projections, not guarantees.
Landlord ↔ Tenant lean methodology
- Overall (STATE)
- 90 Strongly Landlord-Friendly
- State Georgia
- 90 Strongly Landlord-Friendly · R+3
- County
- — inherits STATE
- City
- — inherits STATE
ZIP-level market 31406
- Rents YoY
- 0.0%
- Active inventory
- 176
- Price-to-rent
- 8.5×
Monthly cashflow live
- Estimated rent
- $2,446 high interval (Pro) →
- Mortgage (P&I)
- −$1,306
- Tax from tax record
- −$224 /mo · $2,690/yr
- Insurance
- −$104
- HOA
- −$0
- Vacancy / Maint / Mgmt
- −$514
- Net cashflow
- $298
Break-even live
UW: 25.0% down · 7.5% · 30yr · 1.5% tax · 5.0% vac · 8.0% maint · 8.0% mgmt
Financing live
Cash to close
- Down payment
- $62,250
- Closing costs
- $7,470
- Reserves months
- —
- Total cash needed
- —
Loan-product check · same deal, 3 products live
Conventional
25% down · 7.5% · 30yr
- Down + closing
- —
- Monthly P&I
- —
- Monthly cashflow
- —
- DSCR
- —
- Eligible?
- —
Personal DTI + credit; lowest rate.
DSCR
20% down · 8.5% · 30yr
- Down + closing
- —
- Monthly P&I
- —
- Monthly cashflow
- —
- DSCR
- —
- Eligible?
- —
No personal income docs; deal must DSCR.
Hard money
10% down · 12.0% · 12mo
- Down + closing
- —
- Monthly P&I
- —
- Monthly cashflow
- —
- DSCR
- —
- Eligible?
- —
Short-term bridge; refi at stabilization.
Rent comps 26 comps
| Address | Beds | Baths | Sqft | Rent | $/sqft | DOM | Units | Dist |
|---|---|---|---|---|---|---|---|---|
| 5416 Waters Dr Savannah, GA | 3.0 | 1.0 | 1723 | $2,000 | $1.16 | 23d | 1 | 0.67mi |
| 2337 Shirley Dr Savannah, GA | 3.0 | 2.0 | 1850 | $2,600 | $1.41 | 23d | 1 | 0.74mi |
| 5525 Waters Dr Savannah, GA | 4.0 | 2.0 | 2543 | $2,295 | $0.90 | 43d | 1 | 0.76mi |
| 2222 Bacon Park Dr Savannah, GA | 4.0 | 2.0 | 2246 | $2,995 | $1.33 | 43d | 1 | 0.76mi |
| 2233 E De Renne Ave Savannah, GA | 4.0 | 2.0 | 1476 | $2,400 | $1.63 | 23d | 1 | 0.77mi |
| 5505 Betty Dr Savannah, GA | 3.0 | 2.0 | 1550 | $1,859 | $1.20 | 43d | 1 | 0.81mi |
| 1802 E 62nd St Savannah, GA | 4.0 | 2.0 | 1475 | $2,800 | $1.90 | 44d | 1 | 0.84mi |
| 130 Andover Dr Savannah, GA | 3.0 | 2.0 | 1642 | $2,300 | $1.40 | 13d | 1 | 0.90mi |
| 5908 Fairview Ave Savannah, GA | 3.0 | 2.0 | 1625 | $1,950 | $1.20 | 43d | 1 | 0.92mi |
| 606 McLaws St Savannah, GA | 4.0 | 2.0 | 1997 | $2,595 | $1.30 | 43d | 1 | 0.93mi |
| 5020 La Roche Ave Savannah, GA | 3.0 | 2.5 | 2170 | $3,350 | $1.54 | 13d | 1 | 0.95mi |
| 317 Oxford Dr Savannah, GA | 3.0 | 2.0 | 1413 | $2,400 | $1.70 | 43d | 1 | 0.97mi |
| 317 Oxford Dr Savannah, GA | 3.0 | 2.0 | 1413 | $2,400 | $1.70 | 23d | 1 | 0.97mi |
| 5 Sidney Dr Savannah, GA | 3.0 | 2.0 | 1700 | $2,600 | $1.53 | 23d | 1 | 1.10mi |
| 637 Columbus Dr Savannah, GA | 3.0 | 2.0 | 1600 | $2,895 | $1.81 | 13d | 1 | 1.19mi |
| 28 Gerald Dr Savannah, GA | 4.0 | 2.0 | 1519 | $2,650 | $1.74 | 21d | 1 | 1.20mi |
| 3712 Oakland Ct Savannah, GA | 3.0 | 1.5 | 1903 | $2,495 | $1.31 | 13d | 1 | 1.23mi |
| 6803 Waters Ave Ph 05 Savannah, GA | 4.0 | 2.0 | 1680 | $2,150 | $1.28 | 43d | 1 | 1.27mi |
| 1534 E 53rd St Unit A Savannah, GA | 3.0 | 2.0 | 1606 | $2,950 | $1.84 | 23d | 1 | 1.29mi |
| 329 E 63rd St Savannah, GA | 3.0 | 2.0 | 1451 | $2,515 | $1.73 | 43d | 1 | 1.31mi |
| 3601 Eastgate Dr Savannah, GA | 3.0 | 2.0 | 1400 | $2,500 | $1.79 | 43d | 1 | 1.36mi |
| 1507 E 51st St Savannah, GA | 3.0 | 2.0 | 2135 | $2,880 | $1.35 | 43d | 1 | 1.39mi |
| 1904 E 51st St Savannah, GA | 4.0 | 2.5 | 1800 | $2,300 | $1.28 | 13d | 1 | 1.39mi |
| 206 Brandywine Rd Savannah, GA | 4.0 | 2.0 | 1691 | $3,100 | $1.83 | 43d | 1 | 1.40mi |
| 5545 Varn Dr Savannah, GA | 3.0 | 1.0 | 1403 | $2,195 | $1.56 | 23d | 1 | 1.40mi |
| 1405 E 51st St Savannah, GA | 3.0 | 2.0 | 1458 | $2,850 | $1.95 | 43d | 1 | 1.40mi |
Listing history 4 events
-
2026-04-29price $249,000 589-char remark
Show marketing remark (589 chars)
Great opportunity in the desirable Savannah magnolia Park location! This 3BR/2BA, one-story home offers approximately 2,109 sq ft and is ready for your vision and TLC. With a solid footprint, spacious layout, and established surroundings, this property is ideal for investors or buyers looking to add value. Conveniently located near Bacon Park and local amenities, the property benefits from strong area appeal and long-term potential. Whether you’re planning a flip, rental, or custom renovation, this is a chance to transform a property in a sought-after neighborhood. Sold as-is.
-
2026-04-13price $280,000 589-char remark
Show marketing remark (589 chars)
Great opportunity in the desirable Savannah magnolia Park location! This 3BR/2BA, one-story home offers approximately 2,109 sq ft and is ready for your vision and TLC. With a solid footprint, spacious layout, and established surroundings, this property is ideal for investors or buyers looking to add value. Conveniently located near Bacon Park and local amenities, the property benefits from strong area appeal and long-term potential. Whether you’re planning a flip, rental, or custom renovation, this is a chance to transform a property in a sought-after neighborhood. Sold as-is.
-
2026-03-26$299,000 Active 589-char remark
Show marketing remark (589 chars)
Great opportunity in the desirable Savannah magnolia Park location! This 3BR/2BA, one-story home offers approximately 2,109 sq ft and is ready for your vision and TLC. With a solid footprint, spacious layout, and established surroundings, this property is ideal for investors or buyers looking to add value. Conveniently located near Bacon Park and local amenities, the property benefits from strong area appeal and long-term potential. Whether you’re planning a flip, rental, or custom renovation, this is a chance to transform a property in a sought-after neighborhood. Sold as-is.
-
1997-05-30soldstatus $87,500
ⓘ Source: listings_history table (triggers on properties + properties_extension) + one-shot
backfill from property_details.listing_events for pre-trigger history.
Tax reassessment forecast GA · Resets to sale price
- Current annual tax
- $2,690 · $224/mo
- Projected year-2 tax
- $2,690 · $224/mo
- Expected delta
- $0/yr ($0/mo · 0.0%)
ⓘ Screening estimate from a state-policy table — verify with the county assessor before closing.
Climate risk First Street
- Flood 1/10 Low FEMA zone X (unshaded) · 0% chance over 30 yrs
- Wildfire 1/10 Low
- Heat 10/10 Extreme 7 d/yr ≥106°F today · 18 d/yr by 30 yrs out
- Wind 9/10 Extreme 99% chance of damaging wind over 30 yrs
- Air quality 2/10 Low 2 unhealthy d/yr today · 2 by 30 yrs out
Nearby sold comps map
Loading sold comps map…
Walkable amenities ~0.75 mi
Loading nearby amenities…
Taxation est. · year 1
- Rental income
- $29,349
- − Mortgage interest
- −$13,948
- − Property taxes
- −$2,690
- − Insurance
- −$1,245
- − Repairs & maintenance
- −$2,348
- − Management
- −$2,348
- − Depreciation
- −$7,244
- Taxable loss
- −$473
- Est. tax savings @ 24.0%
- +$114
- After-tax cash flow
- $3,695/yr
For passive investors: Depreciation is non-cash, so a rental often shows a tax loss while cash-flowing — sheltering income. Rental losses are passive: they offset passive income freely, and up to $25,000/yr can offset ordinary (W-2) income if you actively participate and your MAGI is under $100k (phasing out to $0 by $150k); unused losses carry forward. On sale, claimed depreciation is recaptured at up to 25%, and gains may owe capital-gains tax (a 1031 exchange can defer both). Figures are a year-1 estimate at your 24.0% rate — not tax advice; consult a CPA.
Schools (NCES district)
- District
- Savannah-Chatham County
- NCES district ID
- 1301020
- Math proficiency
- 20% ▼ -11.00%
- Reading proficiency
- 26% ▼ -5.00%
- Median HH income
- $47,443
- Composite
- 20.14/100
- National rank
- #8639
- State rank
- #134 of 174 in GA
Livability — Savannah
- Score
- 86/100
- State rank
- #1
- US rank
- #397
Category grades
Schools grade is shown separately in the Schools card above.
Census & demographics
- Census place
- Savannah, GA
- County
- Chatham County · 271,602 people
- City population
- 216,564
- Metro
- Savannah, GA
- Population (ZIP)
- 34,904
- Household income
- $67,120
- Rent vs Own
- Severe rent burden
- 1453.0
Population outlook (Chatham County) Hauer SSP2
- Today (2025)
- 332,584 people
- By 2030
- 355,508 · +6.9%
- By 2040
- 400,030 · +20.3%
- By 2050
- 443,019 · +33.2%
- By 2075
- 534,579 · +60.7%
- By 2100
- 583,863 · +75.6%
Race, ethnicity, and origin ACS 2023
- Neighborhood character
- Diverse neighborhood (Simpson 0.63)
- Race & ethnicity
- White 47% Black 38% Hispanic / Latino 7% Two or more races 6% Asian 4%
- Hispanic origin (detail)
- Mexican 2% Puerto Rican 2%
- Common ancestry
- Slovak 3% Lithuanian 1% Serbian 1%
- Foreign-born
- 7% · Canada, China, Vietnam
- Languages at home
- 91% English-only · Spanish 4% Chinese 2% Other Asian/Pacific 1%
Political lean MEDSL · Chatham
- 2024 margin
- D (+18.0) · D 58.6% · R 40.6%
- 2008→2024 swing
- +3.6pp toward D · 2008: 14.4pp · 2024: 18.0pp
- All cycles
- 2024: D+18.0 2020: D+18.8 2016: D+14.5 2012: D+12.0 2008: D+14.4
Not yet ingested
- Civics
- —
Market trends
- HPI YoY
- ▼ -240.18%
- Current HPI
- 280.3587
- Rent YoY
- ▬ 0.04%
- Metro
- Savannah, GA
- State GDP YoY
- ▲ 2.66%
- F500 in state
- 28
Industry mix (Fortune 500 HQ in GA)
| Industry | F500 HQs | Revenue |
|---|---|---|
| Paper / Packaging | 2 | $29B |
|
||
| Retail | 1 | $160B |
|
||
| Transportation / Logistics | 1 | $91B |
|
||
| Airlines | 1 | $62B |
|
||
| Consumer Goods | 1 | $47B |
|
||
| Utilities | 1 | $25B |
|
||
Price history
+184.6% since first listed4 events — show timeline
- 2026-04-29 Price Changed $249,000 Hive MLS
- 2026-04-13 Price Changed $280,000 Hive MLS
- 2026-03-26 Listed $299,000 Hive MLS
- 1997-05-30 Sold (Public Records) $87,500 Public Records
Property tax history
+4.1%/yrLatest (2023): $2,690 · +51.0% YoY. Source: county tax records.
Cash-flow waterfall
monthlySold comps — $/sqft
last 12 mo · ≤1 miLoading sold comps…